. 2024 May 18;10(1):240.
doi: 10.1038/s41420-024-01997-2.

NAT10-mediated upregulation of GAS5 facilitates immune cell infiltration in non-small cell lung cancer via the MYBBP1A-p53/IRF1/type I interferon signaling axis

Affiliations

NAT10-mediated upregulation of GAS5 facilitates immune cell infiltration in non-small cell lung cancer via the MYBBP1A-p53/IRF1/type I interferon signaling axis

Zimu Wang et al. Cell Death Discov. .

Abstract

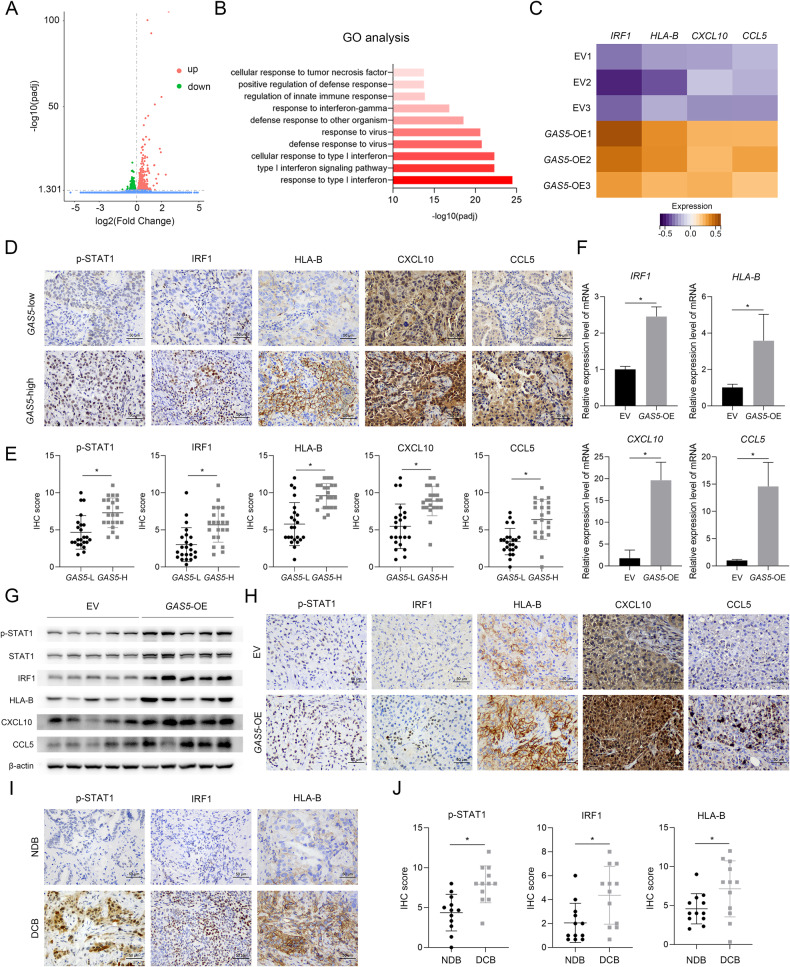
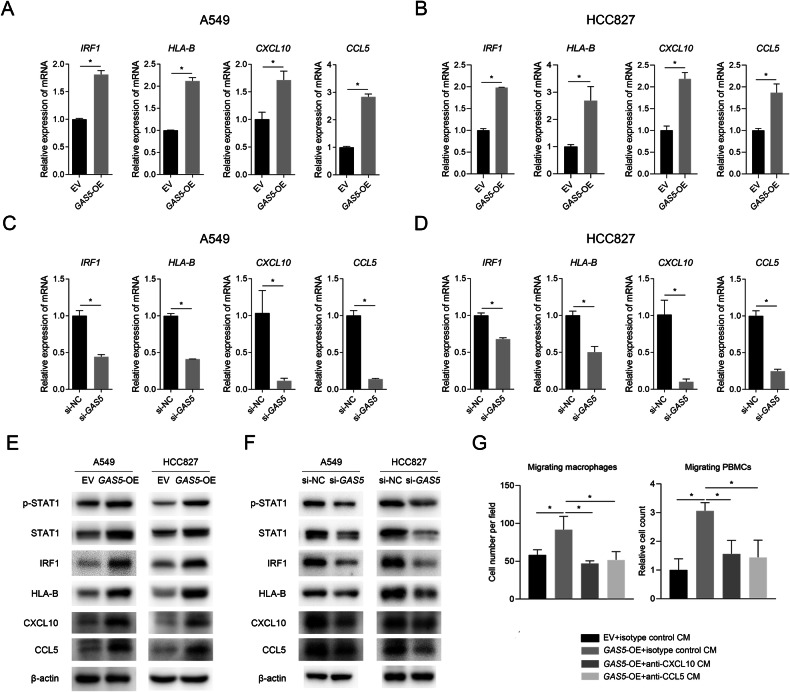
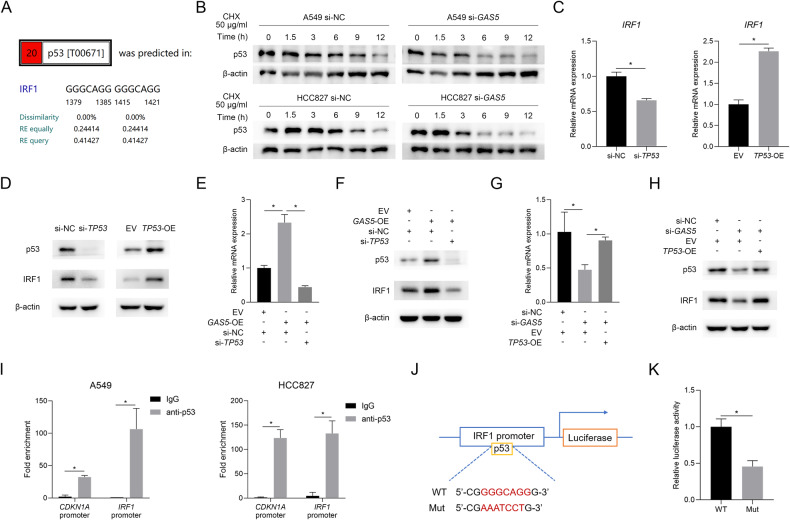
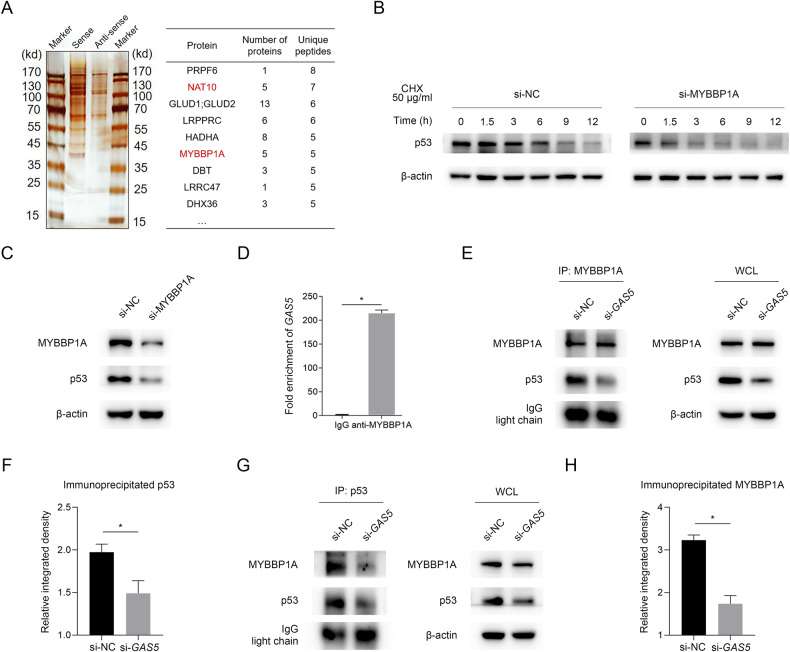
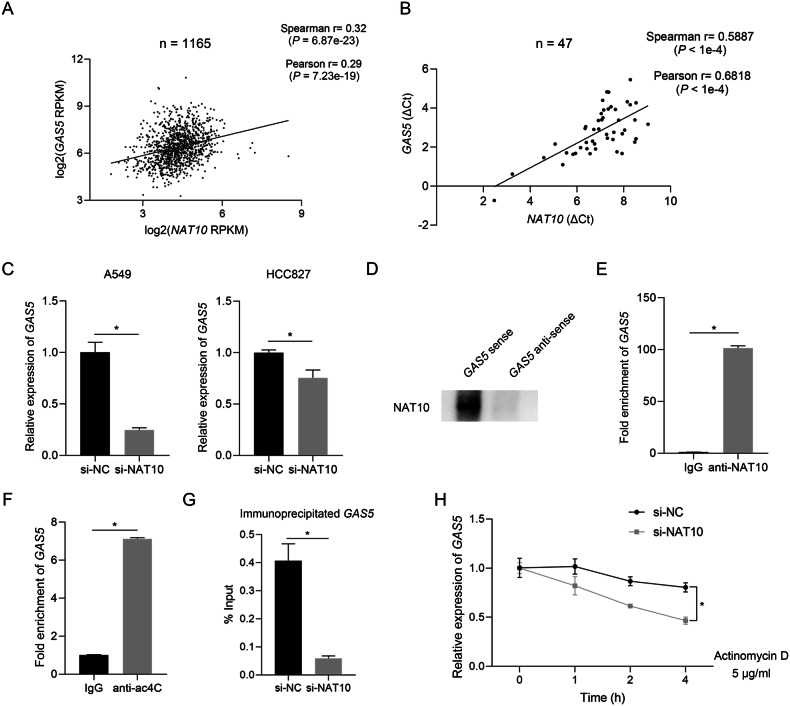
Interactions of tumor cells with immune cells in the tumor microenvironment play an important role during malignancy progression. We previously identified that GAS5 inhibited tumor development by suppressing proliferation of tumor cells in non-small cell lung cancer (NSCLC). Herein, we discovered a tumor-suppressing role for tumor cell-derived GAS5 in regulating tumor microenvironment. GAS5 positively coordinated with the infiltration of macrophages and T cells in NSCLC clinically, and overexpression of GAS5 promoted macrophages and T cells recruitment both in vitro and in vivo. Mechanistically, GAS5 stabilized p53 by directly binding to MYBBP1A and facilitating MYBBP1A-p53 interaction, and enhanced p53-mediated transcription of IRF1, which activated type I interferon signaling and increased the production of downstream CXCL10 and CCL5. We also found that activation of type I interferon signaling was associated with better immunotherapy efficacy in NSCLC. Furthermore, the stability of GAS5 was regulated by NAT10, the key enzyme responsible for N4-acetylcytidine (ac4C) modification, which bound to GAS5 and mediated its ac4C modification. Collectively, tumor cell-derived GAS5 could activate type I interferon signaling via the MYBBP1A-p53/IRF1 axis, promoting immune cell infiltration and potentially correlating with immunotherapy efficacy, which suppressed NSCLC progression. Our results suggested GAS5 as a promising predictive marker and potential therapeutic target for combination therapy in NSCLC. A schematic diagram demonstrating the regulatory effect of GAS5 on immune cell infiltration by activating type I interferon signaling via MYBBP1A-p53/IRF1 axis in non-small cell lung cancer. IFN, interferon.


Conflict of interest statement

The authors declare no competing interests.

Figures

None
A schematic diagram demonstrating the regulatory effect of GAS5 on immune cell infiltration by activating type I interferon signaling via MYBBP1A-p53/IRF1 axis in non-small cell lung cancer. IFN, interferon.
Fig. 1
Fig. 1. GAS5 inhibits tumor growth and facilitates immune cell infiltration in NSCLC.
Representative images (A) and statistical results (B) of CD68, CD3, CD4, and CD8 staining in GAS5-high and GAS5-low NSCLC tissue samples. Scale bar = 50 μm. GAS5-low n = 23, GAS5-high n = 22. C Graphic illustration of a transwell assay. Immune cells were placed into the upper chamber initially, and the conditioned medium from tumor cells was placed in the lower chamber. D More macrophages and PBMCs migrated when the lower chamber was filled with conditioned medium collected from GAS5-overexpressing cells. E Less macrophages and PBMCs migrated when the lower chamber was filled with conditioned medium collected from GAS5-knockdown cells. FH GAS5-overexpressing cells and control cells were injected subcutaneously into the right flank of each BALB/c nude mouse. Tumor volume and weight were significantly suppressed in the GAS5-overexpressing group. n = 5 in each group. I Representative images of Ki-67 and F4/80 staining in subcutaneous tumors. Scale bar = 50 μm. J The expression of Il12a, Il23a, Tnf, and Il10 analyzed by qPCR in subcutaneous tumors. n = 5 in each group. Data are represented as mean ± SD. *P < 0.05.
Fig. 2
Fig. 2. GAS5 modulates type I interferon signaling in NSCLC.
The volcano plot (A) and the GO analysis (B) of the RNA sequencing of GAS5-overexpressing cells and control cells (n = 3). C The expression profile of IRF1, HLA-B, CXCL10, and CCL5 in RNA sequencing of GAS5-overexpressing cells and control cells. Representative images (D) and statistical analyses (E) of p-STAT1, IRF1, HLA-B, CXCL10, and CCL5 staining in human NSCLC tissue samples. Scale bar = 50 μm. GAS5-low n = 23, GAS5-high n = 22. F The mRNA expression of IRF1, HLA-B, CXCL10, and CCL5 was analyzed by qPCR in subcutaneous tumors. n = 5 in each group. G The protein level of IRF1, HLA-B, CXCL10, and CCL5 was analyzed by western blot in subcutaneous tumors. n = 5 in each group. H Representative images of p-STAT1, IRF1, HLA-B, CXCL10, and CCL5 staining in subcutaneous tumors. Scale bar = 50 μm. Representative images (I) and statistical results (J) of GAS5-downstream molecules staining in FFPE specimens of NSCLC patients receiving anti-PD-1/anti-PD-L1 treatment. Scale bar = 50 μm. NDB n = 11, DCB n = 11. DCB: Durable clinical benefit; NDB no durable benefit. Data are represented as mean ± SD. *P < 0.05.
Fig. 3
Fig. 3. GAS5 regulates immune cell infiltration via type I interferon signaling.
A, B The mRNA expression of IRF1, HLA-B, CXCL10, and CCL5 in GAS5-overexpressing cells and control cells. C, D The mRNA expression of IRF1, HLA-B, CXCL10, and CCL5 in GAS5-knockdown and control cells. E The protein level of molecules in type I signaling in GAS5-overexpressing cells and control cells. F The protein level of molecules in type I signaling in GAS5-knockdown and control cells. G Decreased number of migrated macrophages and PBMCs with the presence of anti-CXCL10 antibody (2.0 μg/ml) or anti-CCL5 antibody (2.0 μg/ml) was observed. Data are represented as mean ± SD. *P < 0.05.
Fig. 4
Fig. 4. GAS5 regulates type I interferon signaling by modulating IRF1.
A The result of the transcription factor enrichment analysis of changed genes in type I interferon signaling using ChEA3. Knockdown of IRF1 downregulated the GAS5-overexpression-induced increased mRNA (B) and protein (C) level of molecules in type I interferon signaling. Overexpression of IRF1 upregulated the GAS5-knockdown-induced decreased mRNA (D) and protein (E) level of molecules in type I interferon signaling. F Knockdown or overexpression of IRF1 in tumor cells rescued the GAS5-induced changed migration of macrophages. Data are represented as mean ± SD. *P < 0.05.
Fig. 5
Fig. 5. p53 is involved in the regulation of IRF1 by GAS5.
A p53 was predicted as a potential transcription factor of IRF1 by PROMO. B GAS5-knockdown cells or control cells were treated with cycloheximide (CHX) for the indicated times and western blot analyses of p53 and β-actin were performed. The expression of IRF1 was regulated by p53 at the mRNA level (C) and protein level (D). Knockdown of p53 rescued the GAS5-overexpression-induced increased mRNA (E) and protein (F) level of IRF1. Overexpression of p53 rescued the GAS5-knockdown-induced decreased mRNA (G) and protein (H) level of IRF1. I ChIP-qPCR was performed to determine the binding of p53 to the IRF1 promoter region and CDKN1A promoter region. J Graphic illustration of the potential p53-binding sequence in the IRF1 promoter region. K The wild-type and mutated luciferase reporter plasmids, p53 plasmid, and Renilla luciferase control plasmid were transfected into HEK293 cells, followed by dual-luciferase reporter assays. Data are represented as mean ± SD. *P < 0.05.
Fig. 6
Fig. 6. MYBBP1A/p53-mediated the regulatory effect of GAS5 on IRF1.
A An RNA pull-down was performed to identify GAS5-binding proteins. B MYBBBP1A-knockdown cells or control cells were treated with cycloheximide (CHX) for the indicated times and western blot analyses of p53 and β-actin were performed. C Level of p53 protein with the knockdown of MYBBP1A. D RIP analyses were performed to determine the binding of MYBBP1A protein to GAS5. E GAS5-knockdown or control A549 cells were subjected to co-IP with anti-MYBBP1A antibody and immunoprecipitated proteins were analyzed by western blotting. F After quantification of western blotting bands by ImageJ, relative integrated density was calculated using the following formula: relative integrated density = integrated density of p53 in co-IP sample/integrated density of p53 in corresponding group of WCL. G GAS5-knockdown or control A549 cells were subjected to co-IP with anti-p53 antibody and immunoprecipitated proteins were analyzed by western blotting. H After quantification of western blotting bands by ImageJ, relative integrated density was calculated using the following formula: relative integrated density = integrated density of MYBBP1A in co-IP sample/integrated density of MYBBP1A in corresponding group of WCL. WCL whole cell lysate. Data are represented as mean ± SD. *P < 0.05.
Fig. 7
Fig. 7. NAT10 regulates GAS5 expression by mediating ac4C modification and influencing GAS5 stability.
A The correlation analysis of NAT10 and GAS5 at RNA level in CCLE datasets via cbioportal (n = 1165). B The correlation analysis of NAT10 and GAS5 at RNA level in NSCLC tissue samples (n = 47). C GAS5 was downregulated with the knockdown of NAT10. D Western blot analysis of RNA pull-down products using anti-NAT10 antibody. E RIP analyses were performed to confirm the binding of NAT10 to GAS5 using anti-NAT10 antibody. F RIP analyses were performed to confirm the presence of ac4C modification on GAS5 using anti-ac4C antibody. G The expression of ac4C-modified GAS5 was explored in NAT10-knockdown cells and control cells using RIP analyses. H NAT10-knockdown cells or control cells were treated with Actinomycin D for the indicated time and qPCR analyses of GAS5 and β-actin were performed. Data are represented as mean ± SD. *P < 0.05.

Similar articles

Cited by

References

    1. Sung H, Ferlay J, Siegel RL, Laversanne M, Soerjomataram I, Jemal A, et al. Global Cancer Statistics 2020: GLOBOCAN estimates of incidence and mortality worldwide for 36 cancers in 185 countries. CA Cancer J Clin. 2021;71:209–49. doi: 10.3322/caac.21660. - DOI - PubMed
    1. Altorki NK, Markowitz GJ, Gao D, Port JL, Saxena A, Stiles B, et al. The lung microenvironment: an important regulator of tumour growth and metastasis. Nat Rev Cancer. 2019;19:9–31. doi: 10.1038/s41568-018-0081-9. - DOI - PMC - PubMed
    1. Galon J, Bruni D. Approaches to treat immune hot, altered and cold tumours with combination immunotherapies. Nat Rev Drug Discov. 2019;18:197–218. doi: 10.1038/s41573-018-0007-y. - DOI - PubMed
    1. Quail DF, Joyce JA. Microenvironmental regulation of tumor progression and metastasis. Nat Med. 2013;19:1423–37. doi: 10.1038/nm.3394. - DOI - PMC - PubMed
    1. Lindenmann J, Burke DC, Isaacs A. Studies on the production, mode of action and properties of interferon. Br J Exp Pathol. 1957;38:551–62. - PMC - PubMed