. 2024 May 18;14(1):11345.
doi: 10.1038/s41598-024-61094-3.

In vitro selection of DNA aptamers against staphylococcal enterotoxin A

Affiliations

In vitro selection of DNA aptamers against staphylococcal enterotoxin A

Ricardo Oliveira et al. Sci Rep. .

Abstract

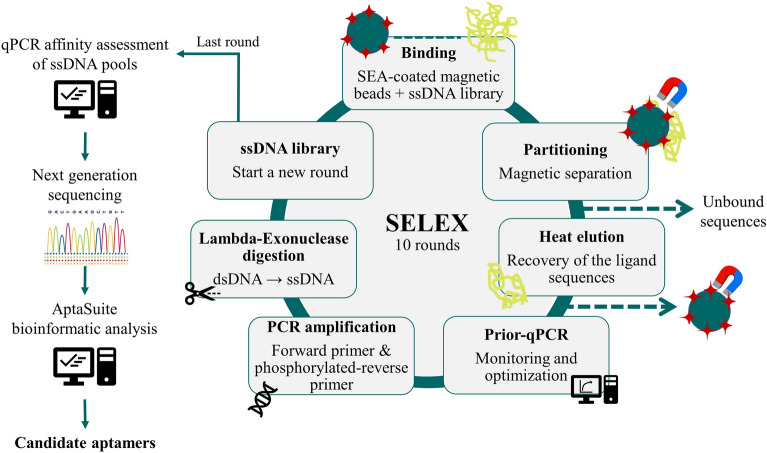
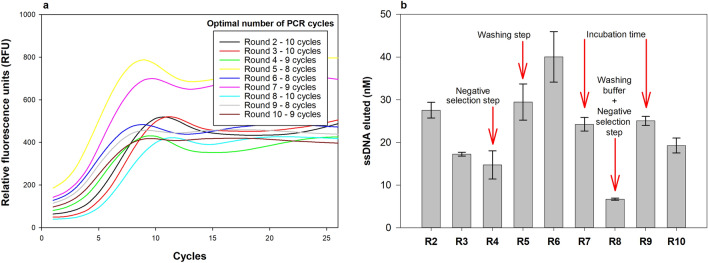
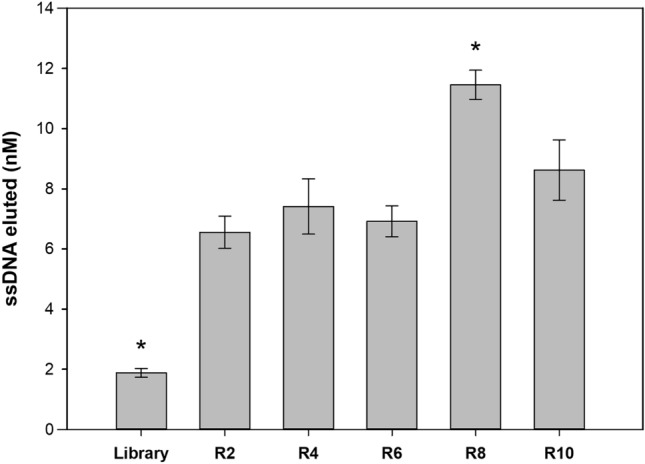
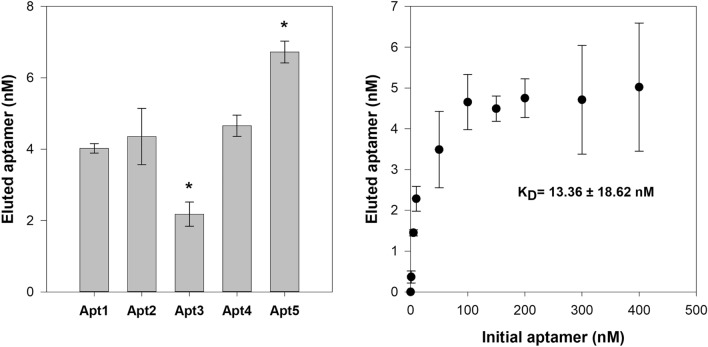
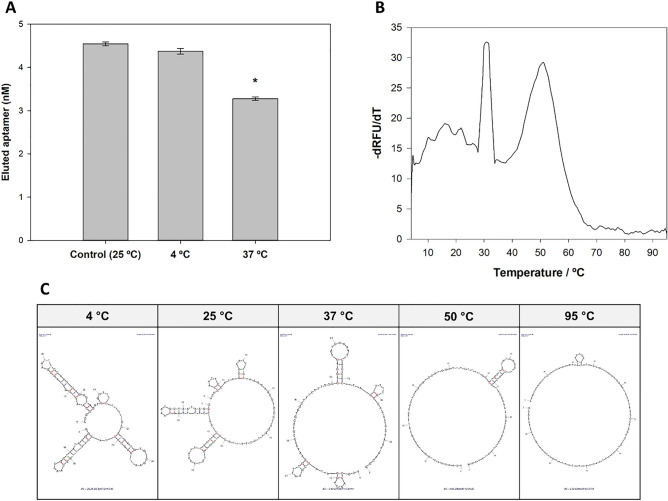
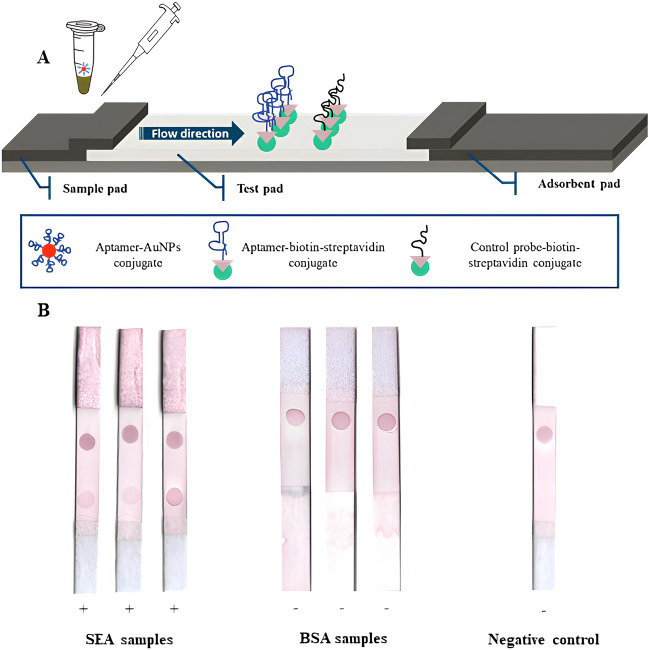
Staphylococcal enterotoxin A (SEA) is the most frequently reported in staphylococcal food poisoning (SFP) outbreaks. Aptamers are single-stranded nucleic acids that are seen as promising alternatives to antibodies in several areas, including diagnostics. In this work, systematic evolution of ligands by exponential enrichment (SELEX) was used to select DNA aptamers against SEA. The SELEX protocol employed magnetic beads as an immobilization matrix for the target molecule and real-time quantitative PCR (qPCR) for monitoring and optimizing sequence enrichment. After 10 selection cycles, the ssDNA pool with the highest affinity was sequenced by next generation sequencing (NGS). Approximately 3 million aptamer candidates were identified, and the most representative cluster sequences were selected for further characterization. The aptamer with the highest affinity showed an experimental dissociation constant (KD) of 13.36 ± 18.62 nM. Increased temperature negatively affected the affinity of the aptamer for the target. Application of the selected aptamers in a lateral flow assay demonstrated their functionality in detecting samples containing 100 ng SEA, the minimum amount capable of causing food poisoning. Overall, the applicability of DNA aptamers in SEA recognition was demonstrated and characterized under different conditions, paving the way for the development of diagnostic tools.

Keywords: Aptamers; Lateral flow assay; SEA; SELEX.


Conflict of interest statement

The authors declare no competing interests.

Figures

Figure 1
Figure 1
SELEX methodology assembled using streptavidin magnetic beads as an immobilization matrix for the target molecule. In a first step, SEA-coated magnetic beads were incubated with a synthetic library of random sequences under well-defined conditions. Then, SEA-binding sequences were separated by magnetic separation, and the non-binding sequences were discarded. The sequences bound to the immobilized SEA were eluted by heat treatment (95 °C for 10 min). In the amplification step, a qPCR analysis was previously performed to determine the optimal number of PCR cycles for amplification of the ssDNA pool to avoid the formation of nonspecific sequences and/or amplification artifacts. Quantification of the eluted ssDNA pool was also performed to monitor sequence enrichment through the rounds. After that, PCR amplification of the total ssDNA pool was performed using forward primer and phosphorylated-reverse primer according to the optimized PCR cycles. The resulting enriched dsDNA pool was then converted into a new ssDNA pool by Lambda-Exonuclease digestion (selectively digests the 5´-phosphorylated strand of dsDNA) to start a new round of SELEX. These steps were repeated until stabilized enrichment (according to qPCR monitoring) in sequences with affinity for SEA was verified. In the last round, the ssDNA pools from each round were analysed to verify affinity enrichment, and the best ssDNA pool was sent for next generation sequencing (NGS). The raw data was then entered into the AptaSuite software that allowed the identification of all candidate aptamers selected in the process.
Figure 2
Figure 2
(a) Amplification profiles of the prior-qPCR reaction from each round of SELEX used to determine the minimum number of cycles for the PCR amplification step that prevent the formation of by-products and artifacts, i.e., the number of cycles before the amplification curve reaches maximum SYBR green fluorescence. (b) Control of the enrichment of the eluted ssDNA pools in each round (R) by qPCR. The arrows highlight the rounds in which different selection conditions (increased stringency) were applied. Duplicates of the reactions as well as a non-target control (NTC) were included in each qPCR assay to ensure the absence of contamination.
Figure 3
Figure 3
Affinity assay of ssDNA pools (standardized to 125 nM) from rounds 2, 4, 6, 8 and 10 against ≈ 28.6 pmols SEA (107 coated beads) under the same incubation conditions (i.e., 30 min at 25 °C in 100 µL of BB). Duplicates of the reactions as well as an NTC were included in each qPCR assay to ensure the absence of contamination. *ssDNA concentration is statistically different when compared with the other rounds (one-way ANOVA; P < 0.05).
Figure 4
Figure 4
Secondary structures with minimum Gibbs free energies (ΔG) of the sequences representing the top 5 clusters predicted using DNA folding form of the mFold software. The structures were predicted using the following conditions: 25 °C, 138 mM Na+ and 0.5 mM Mg2+.
Figure 5
Figure 5
(a) Affinity assay of the candidate aptamers (standardized to 125 nM) against ≈28.6 pmols SEA (107 coated beads) under the same incubation conditions (i.e., 30 min at 25 °C in 100 µL of BB). Triplicates of the binding reactions were performed, and duplicates as well as a NTC were included in each qPCR assay to ensure the absence of contamination. *ssDNA concentration is statistically different when compared with the other aptamer candidates (one-way ANOVA; P < 0.05). (b) Binding saturation curve of Apt5 against SEA. Approximately ≈28.6 pmols SEA (107 coated beads) were incubated with increasing concentrations of aptamer (0, 1, 5, 10, 50, 100, 150, 200, 300 and 400 nM) and the concentration of bound sequences was then measured by qPCR. Data points represent the mean of three replicates. A non-linear regression curve was fitted to the data using SigmaPlot version 12.5 and the dissociation constant (KD) is shown as the mean ± standard deviation (SD).
Figure 6
Figure 6
Effect of temperature on Apt5 properties. (A) Binding assay of a single concentration (125 nM) of Apt5 at different temperatures (4 °C, 25 °C and 37 °C). Amount of bound aptamer was quantified by qPCR. *ssDNA concentration is statistically different when compared with the other conditions tested (one-way ANOVA; P < 0.05). (B) Melting curve of Apt5 in binding buffer using SYBR green between 4 °C and 95 °C. (C) Secondary structure prediction of the DNA sequence at 4 °C, 25 °C, 37 °C, 50 °C and 95 °C at 138 mM Na2+ and 0.5 mM Mg2+ using mfold software.
Figure 7
Figure 7
Lateral flow test based on aptamers selected for SEA. (A) Schematic of the structure and composition of the assembled LFA assay. (B) Proof-of-concept test of SEA samples (100 ng) as well as BSA and BB samples on LFA strips assembled on the basis of previous work.

Similar articles

Cited by

References

    1. World Health Organization. WHO Estimates of the Global Burden of Foodborne Diseases (2015).
    1. World Health Organization. Estimating the Burden of Foodborne Diseases: A Practical Handbook for Countries (2021).
    1. EFSA & ECDC. The European Union One Health 2021 Zoonoses Report. EFSA J.20 (2022). - PMC - PubMed
    1. Scallan E, et al. Foodborne illness acquired in the united states—Major pathogens. Emerg. Infect. Dis. 2011;17:7. doi: 10.3201/eid1701.P11101. - DOI - PMC - PubMed
    1. Jaffee, S., Henson, S., Unnevehr, L., Grace, D. & Cassou, E. The Safe Food Imperative: Accelerating Progress in Low- and Middle-Income Countries. The Safe Food Imperative: Accelerating Progress in Low- and Middle-Income Countries (The World Bank, 2018). 10.1596/978-1-4648-1345-0.

MeSH terms

Substances