. 2024 May 18;15(1):4227.
doi: 10.1038/s41467-024-48699-y.

Enhanced CD95 and interleukin 18 signalling accompany T cell receptor Vβ21.3+ activation in multi-inflammatory syndrome in children

Affiliations

Enhanced CD95 and interleukin 18 signalling accompany T cell receptor Vβ21.3+ activation in multi-inflammatory syndrome in children

Zhenguang Zhang et al. Nat Commun. .

Abstract

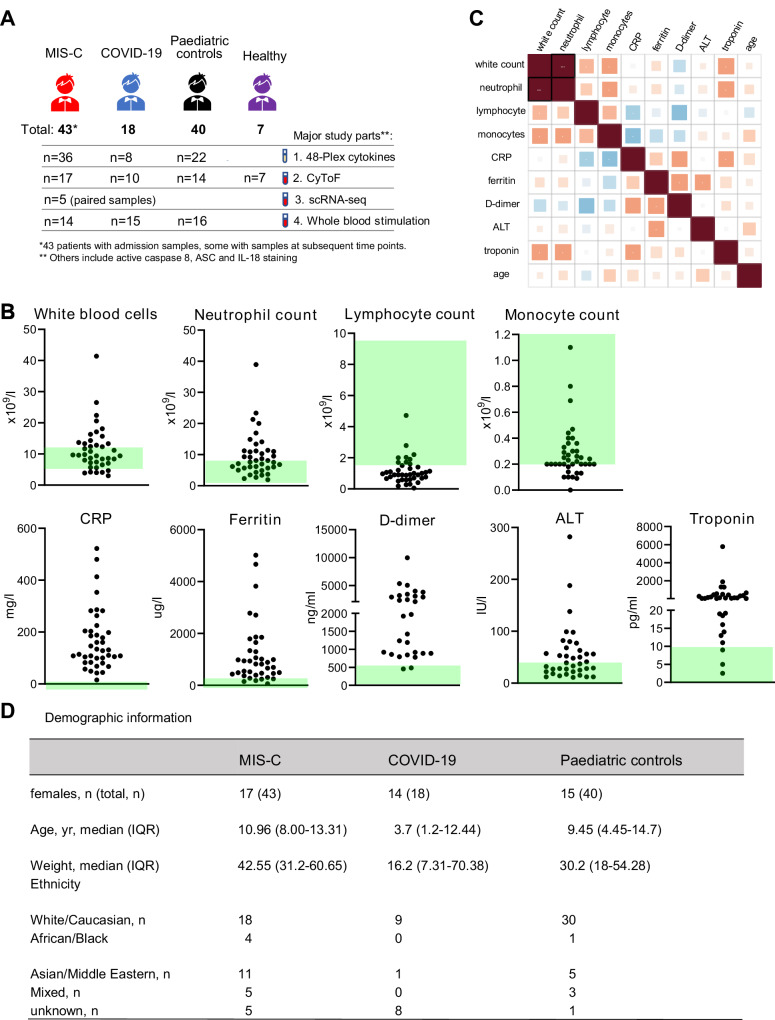
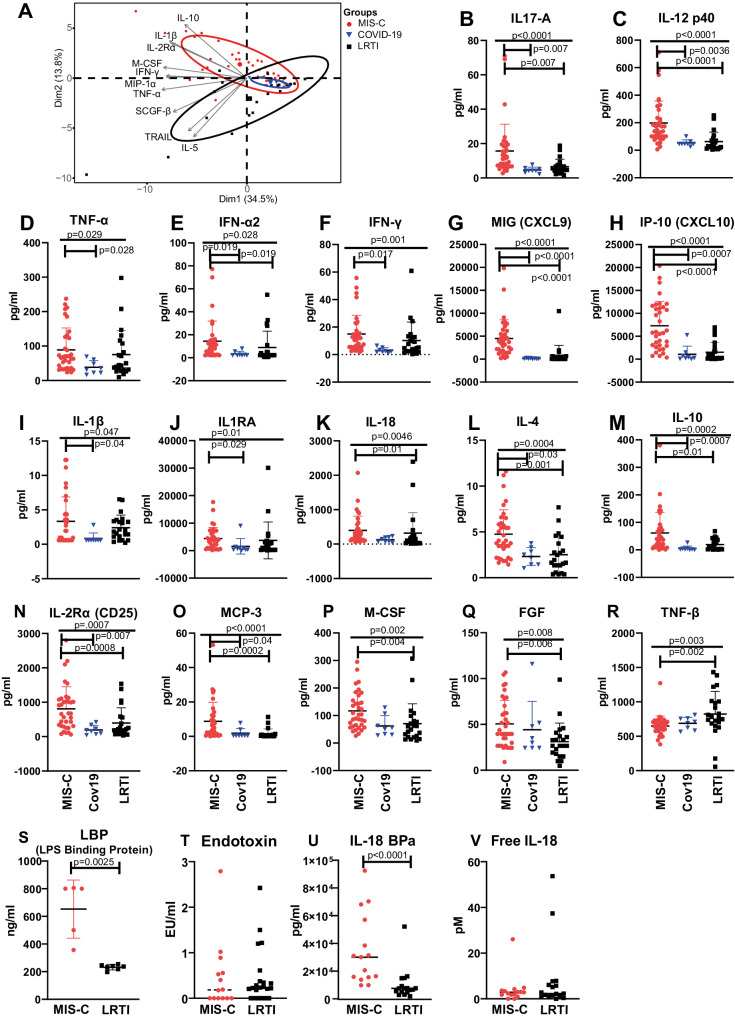
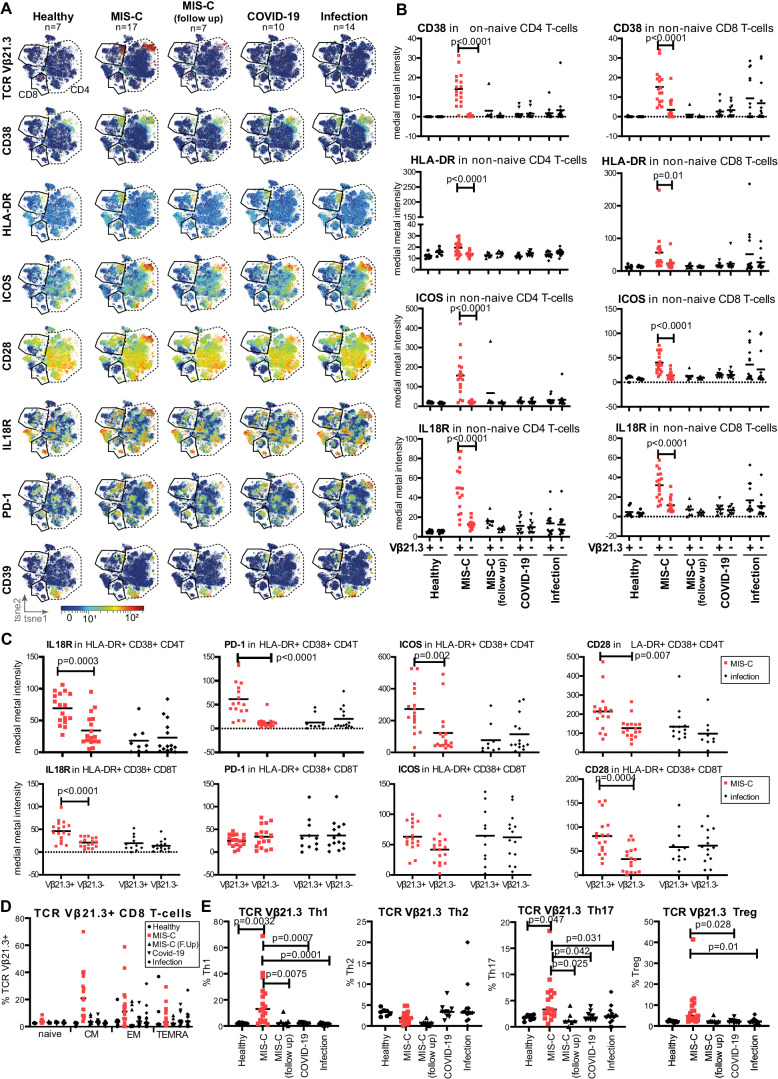
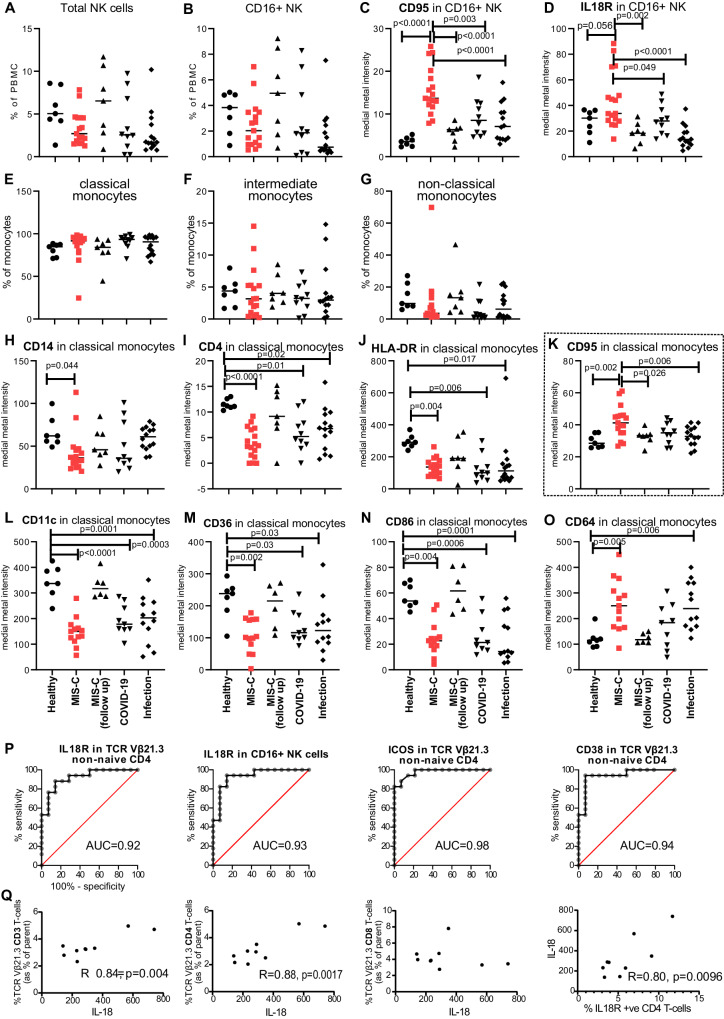
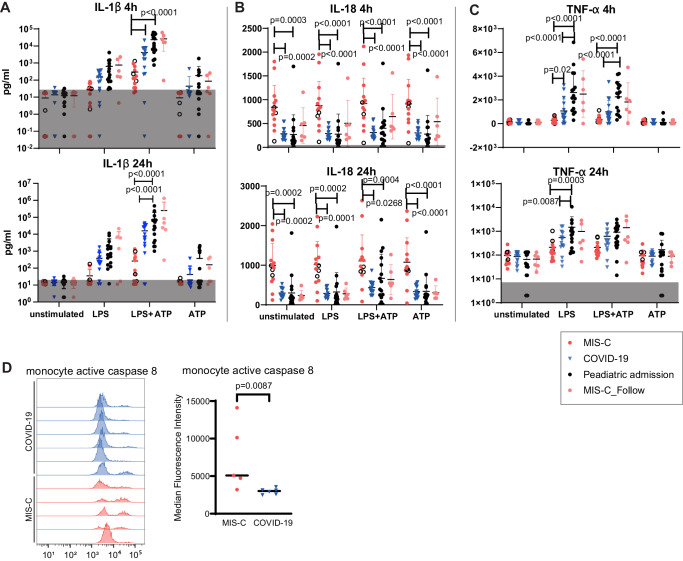
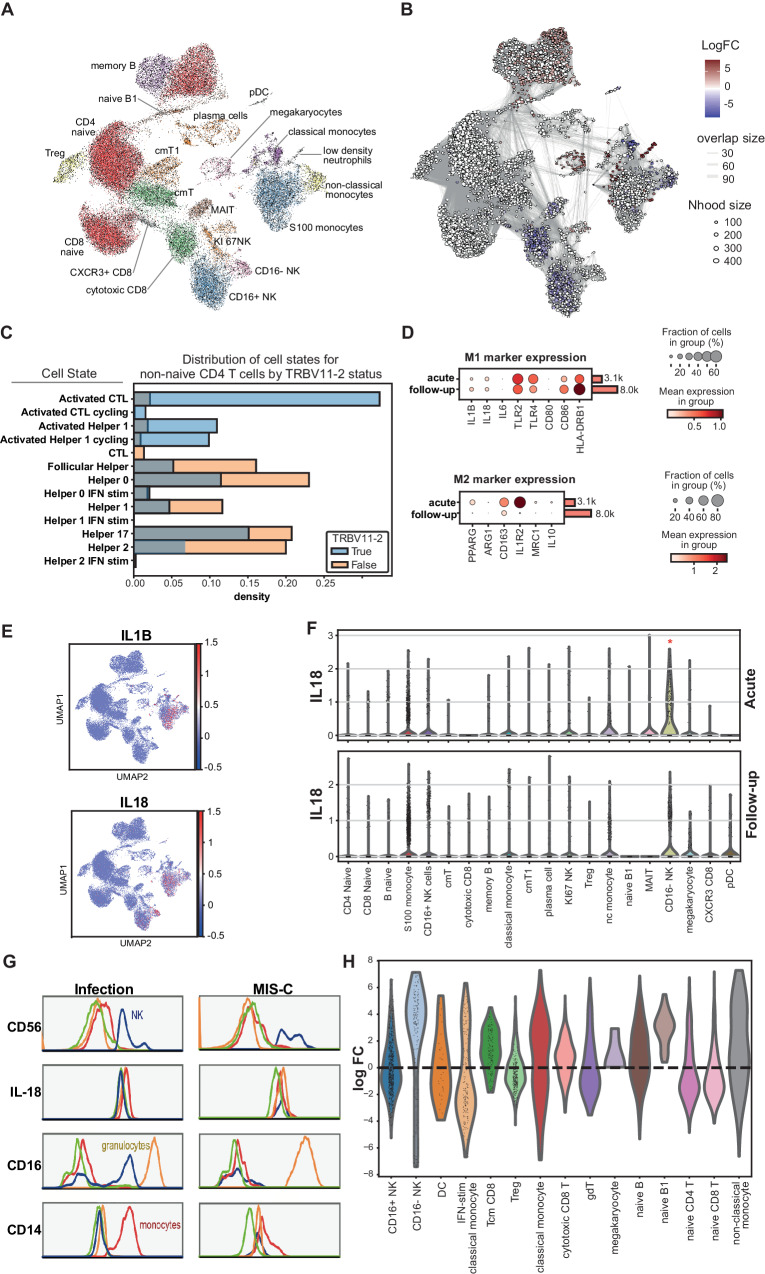
Multisystem inflammatory syndrome in children is a post-infectious presentation SARS-CoV-2 associated with expansion of the T cell receptor Vβ21.3+ T-cell subgroup. Here we apply muti-single cell omics to compare the inflammatory process in children with acute respiratory COVID-19 and those presenting with non SARS-CoV-2 infections in children. Here we show that in Multi-Inflammatory Syndrome in Children (MIS-C), the natural killer cell and monocyte population demonstrate heightened CD95 (Fas) and Interleuking 18 receptor expression. Additionally, TCR Vβ21.3+ CD4+ T-cells exhibit skewed differentiation towards T helper 1, 17 and regulatory T cells, with increased expression of the co-stimulation receptors ICOS, CD28 and interleukin 18 receptor. We observe no functional evidence for NLRP3 inflammasome pathway overactivation, though MIS-C monocytes show elevated active caspase 8. This, coupled with raised IL18 mRNA expression in CD16- NK cells on single cell RNA sequencing analysis, suggests interleukin 18 and CD95 signalling may trigger activation of TCR Vβ21.3+ T-cells in MIS-C, driven by increased IL-18 production from activated monocytes and CD16- Natural Killer cells.


Conflict of interest statement

In the past three years, S.A.T. has received remuneration for Scientific Advisory Board Membership from Sanofi, GlaxoSmithKline, Foresite Labs and Qiagen. S.A.T. is a co-founder and holds equity in Transition Bio. C.E.B. is on the SAB of NodThera, Lightcast, Related Sciences and Janssen Pharmaceuticals and is a co-founder of Polypharmakos and Danger Bio. N.P. received an honorarium from Biomerieux Diagnostics. The other authors declare no competing interests.

Figures

Fig. 1
Fig. 1. Clinical test results of children with MIS-C.
A Graphic summary of the study. Children with MIS-C or COVID-19 pneumonia were studied alongside control paediatric patients and healthy volunteers. There were 4 major parts to the study: 48-plex biomarker assay of plasma samples, high dimensional CyToF study of cell surface markers, scRNA-Seq, and whole blood functional assays. Child icon was from Microsoft PowerPoint 2020. B Clinical test results of MIS-C patients including white blood cell, neutrophil, lymphocyte and monocyte counts, C-Reactive Protein (CRP), ferritin, D-dimer, alanine transaminase (ALT) and troponin levels. Green area indicates the reference range. C Correlation matrix of clinical test results. Statistical significance (p < 0.05) is indicated with star symbols (without adjustment for multiple comparisons by FDR method unless there was a black box outline), with red and blue colours indicating positive and negative correlation respectively. D Table of demographic and ethnicity information for the study subjects. Median and interquartile range (IQR) are provided for age and weight data. Source data are provided as a Source Data file.
Fig. 2
Fig. 2. Multiplex cytokine analysis identifies prominent Th1 plasma inflammatory markers in acute MIS-C.
Plasma cytokine and chemokine levels were measured for 3 groups of acutely ill paediatric patients: MIS-C, PICU COVID-19 pneumonia and LRTI patients (n = 38, n = 8 and n = 22 respectively). Horizontal line indicates the median value of each group. A PCA analysis of 48-plex Luminex assay results showing the ten most variable analytes; different shapes & colours are used for each patient group. BR Results for 17 of the 48 cytokines and chemokines analysed, including IL-12 p40, IL-18 and IFN-γ. Star symbols above a straight line denoted significant changes for the initial Kruskal–Wallis test while those above the capped line denote significant changes for the subsequent Dunn’s multiple comparison test. S LBP levels in acute plasma samples of MIS-C and LRTI groups (n = 5 and 7, respectively. P = 0.0025). T LPS levels in acute plasma samples of MIS-C and respiratory groups (n = 14 and 22, respectively. P = 0.65). U IL-18BPa levels in acute plasma samples of MIS-C and LRTI groups. (n = 15 and 17, respectively. P < 0.0001). V Free IL-18 levels calculated by comparing IL-18 and IL-18 BPa levels for the samples analysed in (U); p = 0.77. Data shown in (SV) were analysed by Mann–Whitney test. Horizontal lines in the graphs indicate the median for each group. Source data are provided as a Source Data file.
Fig. 3
Fig. 3. Deep CyToF phenotyping of TCR Vβ21.3 T cells in MIS-C.
Cryopreserved PBMCs from healthy volunteers (n = 7) or patients with: acute MIS-C (n = 17), MIS-C follow-up (n = 7), PICU COVID-19 pneumonia (n = 10) or acute paediatric infection (n = 14, mixed chest, gastrointestinal and systemic infections) were analysed by CyTOF. A Opt-SNE plotting of non-naïve CD3+ T cells (selected by Boolean gating of CD27+ CD45RA+ cells) using a maximum of 10,000 cells per sample. Note that the TCR Vβ21.3 parameter was not used to construct the tSNE projection. For each plot, colours show expression levels of the following markers from each group: TCR Vβ21.3, CD38, HLA-DR, ICOS, CD28, IL-18R, PD-1 and CD39. B Median metal staining intensities of CD38, HLA-DR, ICOS and IL-18R were quantified in TCR Vβ21.3± non-naïve CD4 and CD8 T cells identified by human gating of the data. Two-way ANOVA was conducted with Šídák’s multiple comparisons test to compare between TCR Vβ21.3+ and TCR Vβ21.3– cells for each group. C Comparison of IL-18R, PD-1, ICOS and CD28 levels between TCR Vβ21.3+ and TCR Vβ21.3 activated T cells (cells positive for HLA-DR+ and CD38+) Two-way ANOVA was conducted with Šídák’s multiple comparisons test to compare between TCR Vβ21.3+ and – cells for each group. D Percentage of TCR Vβ21.3+ cells in CD8 T cells (divided by differentiation state, based on CD45RA and CD27 levels) subsets. Ordinary one-way ANOVA test was used to compare the five groups, with Dunn’s multiple comparisons test to compare each group to the MIS-C group. Naïve T cells were CD45RA+ CD27+, central memory (CM) CD45RA− CD27+, effector memory (EM) CD45RA− CD27− and terminal effector (TE) CD45RA+ CD27. MIS-C (F.Up): MIS-C follow-up. E Percentage of TCR Vβ21.3+ cells in CD4+ T cells (divided into Th1, Th2, Th17 and Treg subsets based on chemokine receptor expression). Ordinary one-way ANOVA test was used to compare the five groups, with Dunn’s multiple comparisons test to compare each group to the MIS-C group. Horizontal lines in graphs in (BE) indicate the median for each group. Source data are provided as a Source Data file.
Fig. 4
Fig. 4. CD16+ NK cells and monocytes of acute MIS-C patients have increased cell surface levels of IL-18R and CD95.
Monocyte and NK cell populations were analysed in (AK) in the same experiment groups shown in Fig. 3: acute MIS-C (n = 17), MIS-C follow-up (n = 7), PICU COVID-19 pneumonia (n = 10) or acute paediatric infection (n = 14, mixed chest, gastrointestinal and systemic infections). Frequency in PBMCs of A total NK cells or B CD16+ NK cells and median metal staining intensity of C CD95 or D IL-18R on CD16+ NK cells. EG show the proportion of each subject’s monocytes classified into the three canonical subsets: classical (CD14++ CD16−), intermediate (CD14+ CD16+), or non-classical (CD14+ CD16++) monocytes. HO show the MFI of the indicated proteins on the surface of classical monocytes using data from the T cell (HK) or monocyte (LO) CyTOF antibody panels (healthy children (n = 7), acute MIS-C (n = 13), MIS-C follow-up (n = 6), acute paediatric COVID-19 pneumonia (n = 9) or acute paediatric infection patients (n = 12, mixed chest, gastrointestinal and systemic infections)). Horizontal line indicates the median value of each group tested. Statistical testing was performed using ordinary one-way ANOVA; results of Dunnett’s multiple comparisons test comparing the acute MIS-C group to all other groups is shown in (AD, K) and comparing healthy children to all other groups in (HJ, LO). P Receiver operating characteristic curves of the indicated markers on particular cell subsets for MIS-C diagnosis (n = 17, acute samples) with infection samples as control (n = 14). Area under the curve values are shown in each graph. All four marker/cell combinations were significantly different between the two groups. Q Correlation between plasma IL-18 levels and frequency of the indicated cell populations. Pearson correlation coefficient and significance are shown on each graph. N = 9. Source data are provided as a Source Data file.
Fig. 5
Fig. 5. Lack of overaction of NLRP3 inflammation activation in MIS-C and increased active caspase 8 activity in MIS-C monocytes.
Whole blood samples from children with MIS-C (n = 14), acute COVID-19 pneumonia (COVID-19, n = 15), other paediatric admissions (Paediatric Admission, n = 16) and MIS-C follow-up patients (MIS-C_Follow, collected about 1 month post hospital discharge, n = 6) were stimulated in vitro with LPS (50 ng/ml), ATP (5 mM), or LPS plus ATP (50 ng/ml and 5 mM respectively, ATP was added 3 h after the LPS addition). Cytokines were measured 4 h and 24 h after stimulation. Levels of IL-1β, IL-18 and TNF-α levels were shown in (AC). The lower limit of quantification of IL-1β is about 18 pg/ml, 16.5 pg/ml for IL-18 and 7.3 pg/ml for TNF-α (grey-shaded areas). In the MIS-C group, samples with glucocorticoids/IVIG treatment in the last 24 h before sampling were marked as unfilled circle. Horizontal line and error bars show the mean and standard deviation. Results of two-way ANOVA with post hoc Tukey’s multiple comparisons test between the first 3 groups (all collected at the acute stage) within each treatment condition are shown. There were no significant differences between the MIS-C-Follow and paediatric admission group by multiple Mann–Whitney tests with each treatment condition. D Monocyte active caspase staining signals from 5 MIS-C and 6 COVID-19 blood monocyte samples. Left: histograms of active caspase 8 staining (red lines indicate MIS-C, blue COVID-19). Right: Quantification of active caspase 8 median fluorescence intensity. Mann–Whitney test was used to compare the 2 groups. Source data are provided as a Source Data file.
Fig. 6
Fig. 6. scRNA-Seq reveals CD16- NK cells express high IL-18 transcripts in acute MIS-C patients.
ScRNA-seq analysis of paired PBMC samples from five children with acute MIS-C and at follow-up (approximately one month later). A PBMC UMAP projection showing annotated cell populations B Differential cell abundance test result from miloR analysis, comparing acute and follow-up groups. Significantly changed clusters were colour indicated. C Distribution of TCR Vβ21.3+ and − T cells in different CD4 T subtypes. D selected M1, M2 marker expression in acute and follow-up monocyte populations (including the 4 different monocyte subtypes). E Expression of IL1B and IL-18 mRNA transcripts in the UMAP. F Violin plots of IL-18 mRNA levels in different PBMC populations from MIS-C patients at the acute or follow-up stage. There was a significant change in IL-18 mRNA levels for the CD16- NK population when comparing admission and follow-up samples by Wilcoxon’s tests (q value = 3.81E-06). G Intracellular staining of IL-18 in fixed blood samples. Left: staining in an infectious disease sample; right: example in an MIS-C (acute) sample. H Cell abundance comparing PBMC samples from healthy and MIS-C follow-up children. The healthy children PBMC data are from published dataset. FC fold change, nc non-classical, cm central memory.

Similar articles

Cited by

References

    1. Clark, J. A. & Pathan, N. Hide and seek in a pandemic: review of SARS-CoV-2 infection and sequelae in children. Exp Physiol10.1113/EP089399 (2021). - PMC - PubMed
    1. Hoste L, et al. TIM3+ TRBV11-2 T cells and IFNγ signature in patrolling monocytes and CD16+ NK cells delineate MIS-C. J. Exp. Med. 2021;219:e20211381. doi: 10.1084/jem.20211381. - DOI - PMC - PubMed
    1. Porritt RA, et al. HLA class I–associated expansion of TRBV11-2 T cells in multisystem inflammatory syndrome in children. J. Clin. Invest. 2021;131:e146614. doi: 10.1172/JCI146614. - DOI - PMC - PubMed
    1. Moreews M, et al. Polyclonal expansion of TCR Vβ 21.3+ CD4+ and CD8+ T cells is a hallmark of multisystem inflammatory syndrome in children. Sci. Immunol. 2021;6:eabh1516. doi: 10.1126/sciimmunol.abh1516. - DOI - PMC - PubMed
    1. Ramaswamy A, et al. Immune dysregulation and autoreactivity correlate with disease severity in SARS-CoV-2-associated multisystem inflammatory syndrome in children. Immunity. 2021;54:1083–1095.e7. doi: 10.1016/j.immuni.2021.04.003. - DOI - PMC - PubMed

MeSH terms

Supplementary concepts