. 2024 May 18;15(1):4244.
doi: 10.1038/s41467-024-48695-2.

Mitochondrial respiratory function is preserved under cysteine starvation via glutathione catabolism in NSCLC

Affiliations

Mitochondrial respiratory function is preserved under cysteine starvation via glutathione catabolism in NSCLC

Nathan P Ward et al. Nat Commun. .

Abstract

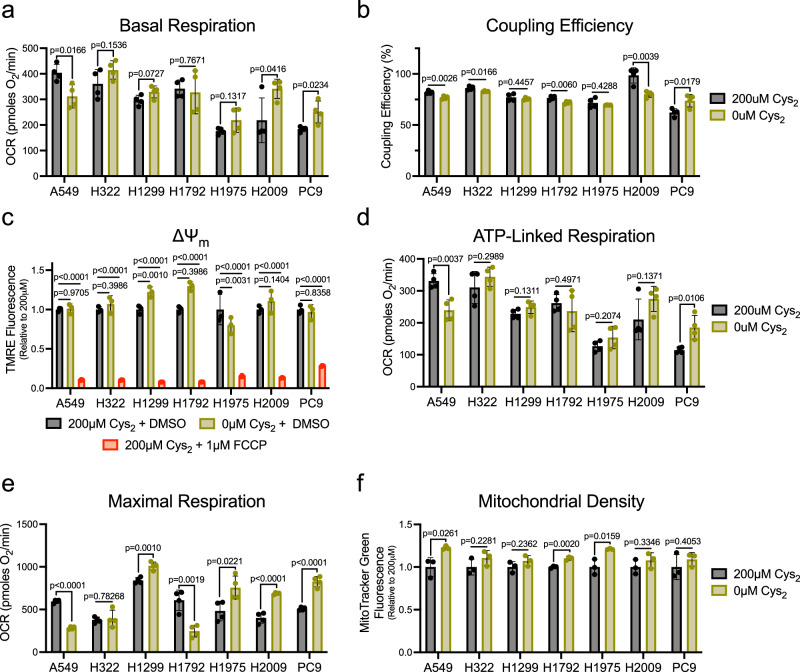
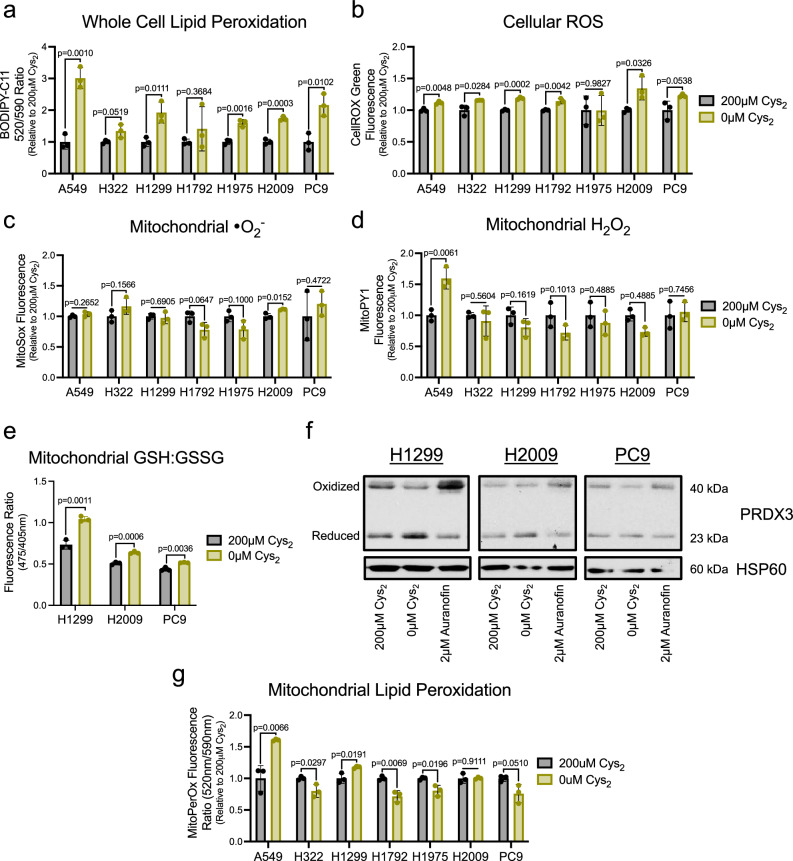
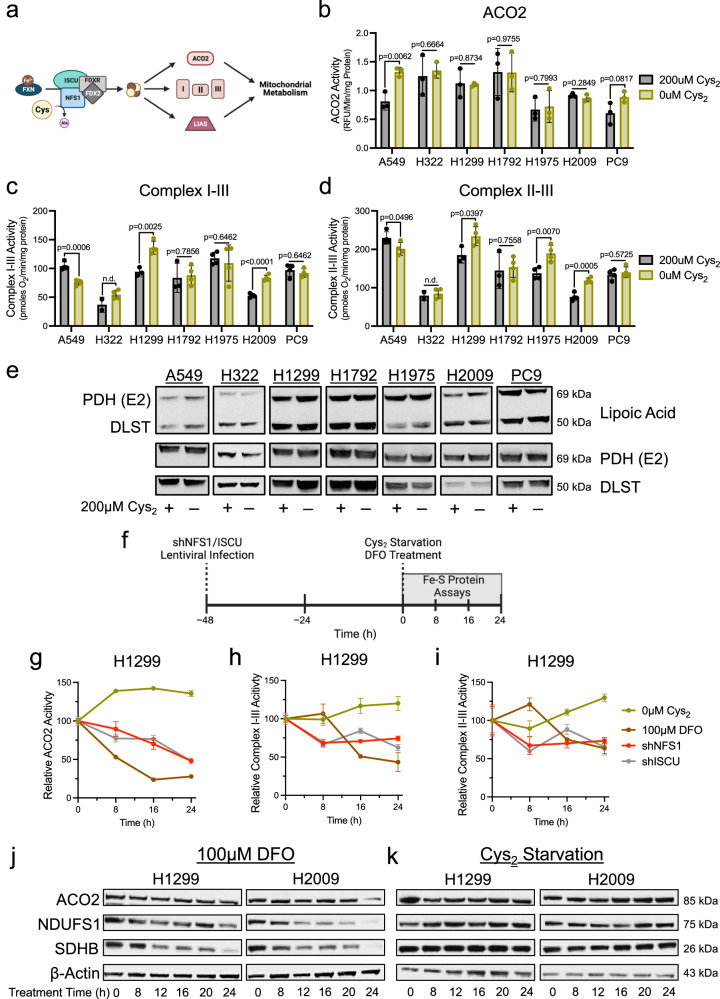
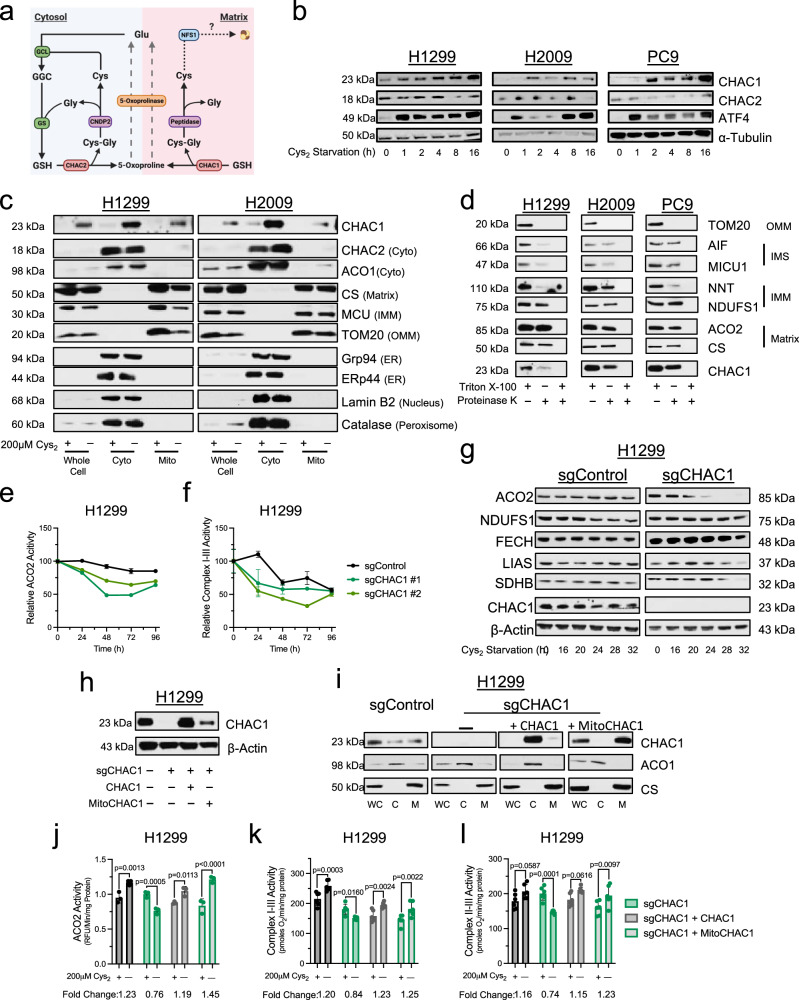
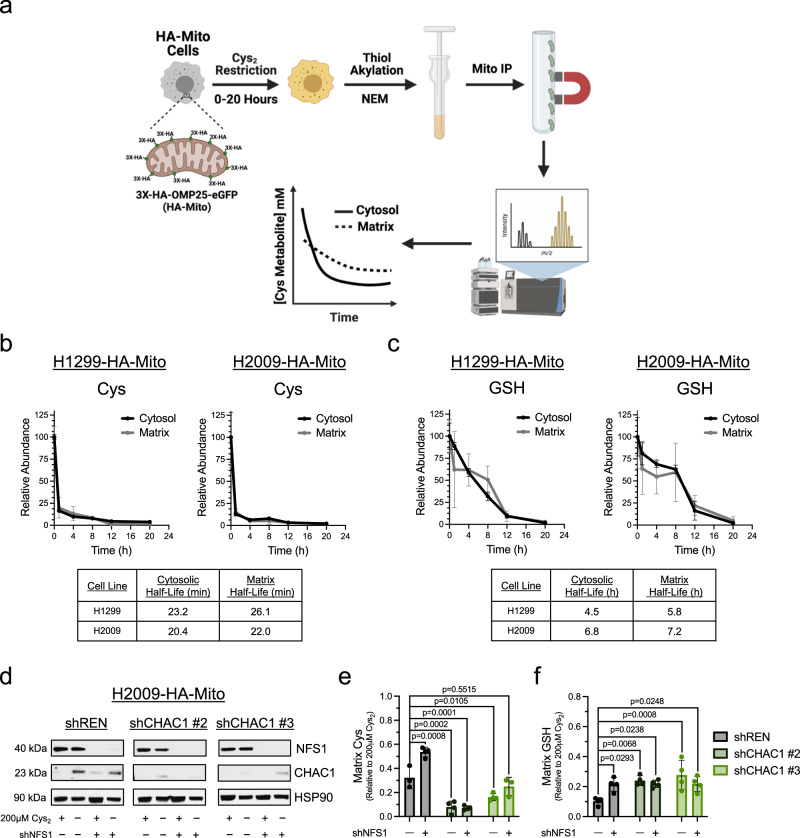
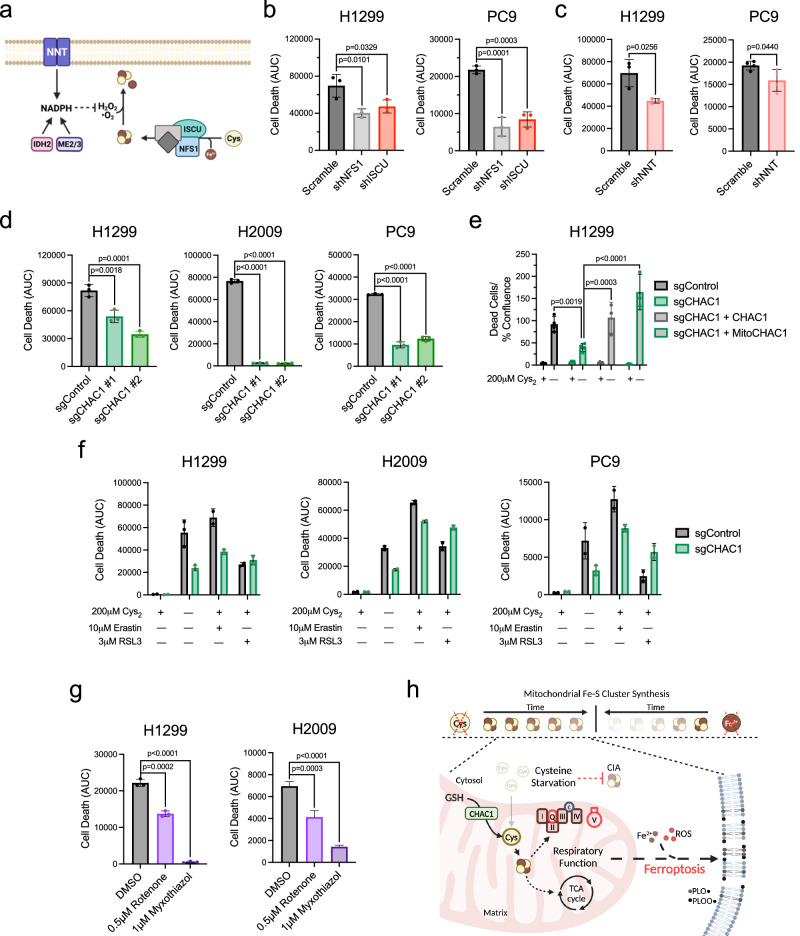
Cysteine metabolism occurs across cellular compartments to support diverse biological functions and prevent the induction of ferroptosis. Though the disruption of cytosolic cysteine metabolism is implicated in this form of cell death, it is unknown whether the substantial cysteine metabolism resident within the mitochondria is similarly pertinent to ferroptosis. Here, we show that despite the rapid depletion of intracellular cysteine upon loss of extracellular cystine, cysteine-dependent synthesis of Fe-S clusters persists in the mitochondria of lung cancer cells. This promotes a retention of respiratory function and a maintenance of the mitochondrial redox state. Under these limiting conditions, we find that glutathione catabolism by CHAC1 supports the mitochondrial cysteine pool to sustain the function of the Fe-S proteins critical to oxidative metabolism. We find that disrupting Fe-S cluster synthesis under cysteine restriction protects against the induction of ferroptosis, suggesting that the preservation of mitochondrial function is antagonistic to survival under starved conditions. Overall, our findings implicate mitochondrial cysteine metabolism in the induction of ferroptosis and reveal a mechanism of mitochondrial resilience in response to nutrient stress.


Conflict of interest statement

The authors declare no competing interests.

Figures

Fig. 1
Fig. 1. Mitochondrial respiration is sustained in the absence of extracellular Cys2.
a Basal oxygen consumption rate of NSCLC cells stimulated with 10 mM glucose and 2mM L-glutamine following culture in the presence or absence of cystine (n = 4 biologically independent samples per condition). b Percentage of basal oxygen consumption linked to the generation of ATP in NSCLC cells fed or starved of cystine (n = 4 biologically independent samples per condition). c Average relative TMRE fluorescence of NSCLC cells cultured with indicated [cystine] or treated with FCCP for 15 min (n = 3 biologically independent samples per condition). d Oligomycin-sensitive oxygen consumption rate of cystine-fed or starved NSCLC cells (n = 4 biologically independent samples per condition). e FCCP-stimulated oxygen consumption rate in in NSCLC cells fed or starved of cystine (n = 4 biologically independent samples per condition). f Average relative MitoTracker Green fluorescence of NSCLC cells cultured in the presence or absence of cystine (n = 3 biologically independent samples per condition). For all experiments, cells were cultured in the indicated [cystine] for 20 h prior to the indicated analysis. Data represent mean values ± s.d. For (a, b, df), P values were calculated using a two-tailed unpaired Student’s t-test. For (c), P values were calculated using a one-way ANOVA. All data are representative of at least 3 experimental replicates. For (af), source data provided as a Source Data file.
Fig. 2
Fig. 2. Cys2 starvation does not promote mitochondrial oxidative stress.
Following culture in the presence or absence of cystine, NSCLC cells were treated with ROS-sensitive fluorescent dyes to determine the average relative levels of (a) cellular membrane lipid peroxides, (b) cellular ROS, (c) mitochondrial superoxide, or (d) mitochondrial hydrogen peroxide (n = 3 biologically independent samples per condition for each experiment). e Ratio of Mito-Grx1-roGFP2 fluorescence as indicative of the proportion of the biosensor bound to reduced (GSH) or oxidized (GSSG) glutathione in H1299, H2009, and PC9 cells cultured with or without cystine for 16 h (n = 3 biologically independent samples per condition). f Redox immunoblotting of HSP60 and the PRDX3 oxidation state in H1299, H2009, and PC9 cells following culture with the indicated [cystine] or 1 h treatment with auranofin. g Relative MitoPerOX fluorescence ratio of NSCLC cells cultured in the presence or absence of cystine to indicate the extent of mitochondrial membrane lipid peroxidation (n = 3 biologically independent samples per condition). For (ad, f, g) cells were cultured in the indicated [cystine] for 20 h prior to the indicated analysis. Data represent mean values ± s.d. For (ae, g) P values were calculated using two-tailed unpaired Student’s t-test. All data are representative of at least 3 experimental replicates. For (ag), source data provided as a Source Data file.
Fig. 3
Fig. 3. Fe-S protein function is preserved under Cys2 deprivation.
a Schematic of Fe-S cluster synthesis and its contribution to enzymatic function that supports mitochondrial metabolism; Ala, alanine, Cys, cysteine, Fe2+, iron, I, complex I, II, complex II, III, complex III. b ACO2 activity in mitochondrial lysates of NSCLC cells fed or starved of cystine (n = 3 biologically independent samples per condition). c Supercomplex I-III activity in permeabilized NSCLC cells following culture in the presence or absence of cystine (n = 4 biologically independent samples per condition, except when n = 2 for H322 + 200 μM and n = 3 for H1299 and H1792 + 200 μM). d Supercomplex II-III activity in permeabilized NSCLC cells following culture in the presence or absence of cystine (n = 4 biologically independent samples per condition, except when n = 2 for H322 + 200 μM and n = 3 for H1299 and H1792 + 200 μM). e Immunoblot analysis of PDH complex subunit E2 and α-ketoglutarate dehydrogenase subunit DLST lipoylation following culture in cystine replete or starved conditions. f Experimental timeline for the assessment of Fe-S proteins in response to insults to Fe-S cluster synthesis (gi). g ACO2 activity in mitochondrial lysates of H1299 cells following treatment with cystine starvation, DFO, or upon knockdown of NFS1 or ISCU at the indicated time points (n = 3 biologically independent samples per condition). h, i ETC supercomplex activities in permeabilized H1299 cells following treatment with cystine starvation, DFO, or upon knockdown of NFS1 or ISCU at the indicated time points (n = 3 biologically independent samples per condition). For (gi), data points are representative of the activity of each Fe-S protein relative to the activity of that protein at time 0 h. Immunoblot analyses of mitochondrial Fe-S proteins (ACO2, NDUFS1, and SDHB) in H1299 and H2009 cells following culture in (j), cystine-deficient media or (k), DFO for the indicated time. For (gi), all cells were cultured in the presence of 1 μM ferrostatin-1. Data represent mean values ± s.d; n.d. not determined. For (bd) P values were calculated using two-tailed unpaired Student’s t-test. All data are representative of at least 3 experimental replicates. a, f created with BioRender.com released under a Creative Commons Attribution-NonCommercial-NoDerivs 4.0 International license, https://creativecommons.org/licenses/by-nc-nd/4.0/deed.en. For (be) and (gk), source data provided as a Source Data file.
Fig. 4
Fig. 4. CHAC1 loss diminishes Fe-S protein function under Cys2 starvation.
a Schematic of the intracellular GSH cleavage system; Cys, cysteine, Cys2, cystine, Cys-Gly, cysteinylglycine, GGC, γ-glutamylcysteine, Gly, glycine, Glu, glutamate, GSH, glutathione. b Immunoblot analysis of CHAC1, CHAC2, ATF4, and α-Tubulin expression in NSCLC cells under cystine starvation. c Immunoblot analysis of CHAC1, CHAC2, ACO1, CS, MCU, TOM20, Grp94, Erp44, Catalase, and Lamin B2 expression in whole cell or fractionated lysates upon mitochondrial immunoprecipitation from cells cultured in the indicated [cystine] for 20 h. d Immunoblot analysis of TOM20, AIF, MICU1, NNT, NDUFS1, ACO2, CS, and CHAC1 in mitochondrial isolates subject to proteinase K treatment in the presence or absence of detergent; IMM inner mitochondrial membrane, IMS intermembrane space, OMM outer mitochondrial membrane. e ACO2 (n = 3 biologically independent samples per condition, except when n = 2 for sgControl-96h) and (f), supercomplex I–III activities (n = 3 biologically independent samples per condition) in CHAC1 expressing or deficient H1299 cells following treatment with cystine-deficient media supplemented with 1 μM ferrostatin-1 for the indicated time. g Immunoblot analysis of ACO2, NDUFS1, FECH, LIAS, SDHB, CHAC1, and β-Actin in CHAC1 expressing or deficient H1299 cells following culture in cystine-deficient media supplemented with 1 μM ferrostatin-1 for the indicated time. h Immunoblot analysis of CHAC1 and β-Actin expression in control or CHAC1-deficient H1299 cells reconstituted with vector control, untargeted, or mitochondrially-targeted CHAC1. i Immunoblot analysis of CHAC1, ACO1 (cytosol), and CS (mitochondria) expression in fractionated lysates from cells in (h); C cytosol, M mitochondria, WC whole cell. j ACO2 activities (n = 3 biologically independent samples per condition) and (k, l) ETC supercomplex activities (n = 6 biologically independent samples per condition) in control or CHAC1-deficient H1299 cells reconstituted with vector control, untargeted, or mitochondrially-targeted CHAC1 following 20 h culture with or without cystine. For (e, f) data points are representative of the activity of each Fe-S protein relative to cystine-replete conditions (time 0 h). Data represent mean values ± s.d. For (jl) data are representative of at least 3 experimental replicates and P values were calculated using a two-way ANOVA. a created with BioRender.com released under a Creative Commons Attribution-NonCommercial-NoDerivs 4.0 International license, https://creativecommons.org/licenses/by-nc-nd/4.0/deed.en. For (bl), source data is provided as a Source Data file.
Fig. 5
Fig. 5. CHAC1 supports the matrix cys under Cys2 deprivation.
a Schematic workflow of mitochondrial isolation coupled to LC-MS for the compartmentalized detection of thiol-containing metabolites; Mito IP, mitochondrial immunoprecipitation. NEM, n-ethylmaleimide. b Determination of the half-life of cytosolic and matrix Cys in H1299-HA-Mito and H2009-HA-Mito cells cultured in the absence of extracellular Cys for 20 h (n = 3 biologically independent samples per time point). c Determination of the half-life of cytosolic and matrix GSH in H1299-HA-Mito and H2009-HA-Mito cells cultured in the absence of extracellular Cys for 20 h (n = 3 biologically independent samples per time point). d Immunoblot analysis of NFS1, CHAC1, and β-Actin expression in cystine-fed or starved H2009-HA-Mito cells 3-days post-lentiviral infection with either a scramble control or NFS1-targeting hairpin that were also subject to 5-days of 0.2 μg/mL doxycycline treatment to induce shRNA-mediated knockdown of CHAC1. e Matrix cysteine levels in H2009-HA-Mito cells deficient in CHAC1 and or NFS1 that were subjected to 2 h of cystine starvation (n = 4 biologically independent samples per condition, except when n = 3 for shREN + scramble and shCHAC1 #3 + shNFS1). f Matrix GSH levels in H2009-HA-Mito cells deficient in CHAC1 and or NFS1 that were subjected to 12 h of cystine starvation (n = 4 biologically independent samples per condition). For (e, f) data are representative of the matrix pool of each metabolite relative to cystine replete conditions. Data represent mean values ± s.d. For (e, f) P values were calculated using a two-way ANOVA with a Šidák’s multiple comparisons test. a created with BioRender.com released under a Creative Commons Attribution-NonCommercial-NoDerivs 4.0 International license, https://creativecommons.org/licenses/by-nc-nd/4.0/deed.en. For (bf), source data provided as a Source Data File.
Fig. 6
Fig. 6. Mitochondrial respiratory function antagonizes NSCLC viability in the absence of extracellular Cys2.
a Schematic representation of the two major aspects of Fe-S cluster homeostasis: de novo synthesis and mitigation of cluster oxidation; Cys, cysteine, Fe2+, iron, H2O2, hydrogen peroxide, NADPH, nicotinamide adenine dinucleotide phosphate, •O2, superoxide. b, c Quantification of cell death over 48 h of cystine starvation in H1299 and PC9 cells following the disruption of Fe-S cluster homeostasis through shRNA knockdown of (b) NFS1 and ISCU (n = 3 biologically independent samples per condition), or (c) NNT (n = 3 biologically independent samples per condition for H1299, and n = 4 for PC9). d Measurement of CHAC1-deficient NSCLC cell death under 48 h of cystine starvation (n = 3 biologically independent samples per condition). e Quantification of cell death in control, CHAC1-defcient, or CHAC1-reconstituted H1299 cells following a 48 h incubation in the presence or absence of cystine (n = 4 biologically independent samples per condition, except when n = 3 for sgCHAC1 + CHAC1-0 μM and sgCHAC1 + MitoCHAC1-0 μM). f Analysis of CHAC1-deficient NSCLC cell death over 48 h of treatment with indicated inducers of ferroptosis (n = 2 biologically independent samples per condition, except when n = 3 for H1299 + sgControl-DMSO-0 μM, H1299 + sgCHAC1-DMSO-0 μM, and PC9 +  sgCHAC1-DMSO-0 μM). g Quantification of cell death over 48 h in H1299 and H2009 cells subject to ETC inhibition under cystine starvation (n = 3 biologically independent samples per condition). h Summary schematic depicting that mitochondrial Fe-S cluster synthesis is more resistant to sulfur (Cys) than iron restriction due to CHAC1 catabolism of mitochondrial GSH. This contrasts with the cytosolic iron-sulfur cluster assembly system (CIA), which exhibits sensitivity to Cys starvation. The persistence of respiratory function under Cys limitation potentiates the iron-mediated generation of membrane phospholipid alkoxyl (PLO•) and peroxy (PLOO•) radicals that mediate ferroptosis; GSH glutathione, ROS reactive oxygen species. Data represent mean values ± s.d. For (bg) data are representative of at least 3 experimental replicates. For (bd) and (g) P values were calculated using a one-way ANOVA. For (e) P values were calculated using a two-way ANOVA with a Šidák’s multiple comparisons test. a, h created with BioRender.com released under a Creative Commons Attribution-NonCommercial-NoDerivs 4.0 International license, https://creativecommons.org/licenses/by-nc-nd/4.0/deed.en. For bg, source data provided as a Source Data file.

Similar articles

Cited by

References

    1. Ward NP, DeNicola GM. Sulfur metabolism and its contribution to malignancy. Int. Rev. Cell Mol. Biol. 2019;347:39–103. doi: 10.1016/bs.ircmb.2019.05.001. - DOI - PubMed
    1. Cramer SL, et al. Systemic depletion of L-cyst(e)ine with cyst(e)inase increases reactive oxygen species and suppresses tumor growth. Nat. Med. 2017;23:120–127. doi: 10.1038/nm.4232. - DOI - PMC - PubMed
    1. Badgley MA, et al. Cysteine depletion induces pancreatic tumor ferroptosis in mice. Science. 2020;368:85–89. doi: 10.1126/science.aaw9872. - DOI - PMC - PubMed
    1. Lei G, Zhuang L, Gan B. Targeting ferroptosis as a vulnerability in cancer. Nat. Rev. Cancer. 2022;22:381–396. doi: 10.1038/s41568-022-00459-0. - DOI - PMC - PubMed
    1. Kang YP, et al. Non-canonical glutamate-cysteine ligase activity protects against ferroptosis. Cell Metab. 2021;33:174–189.e7. doi: 10.1016/j.cmet.2020.12.007. - DOI - PMC - PubMed