. 2024 May 18;4(1):93.
doi: 10.1038/s43856-024-00522-x.

Proteomic features of soft tissue tumours in adolescents and young adults

Affiliations

Proteomic features of soft tissue tumours in adolescents and young adults

Yuen Bun Tam et al. Commun Med (Lond). .

Abstract

Background: Adolescents and young adult (AYA) patients with soft tissue tumours including sarcomas are an underserved group with disparities in treatment outcomes.

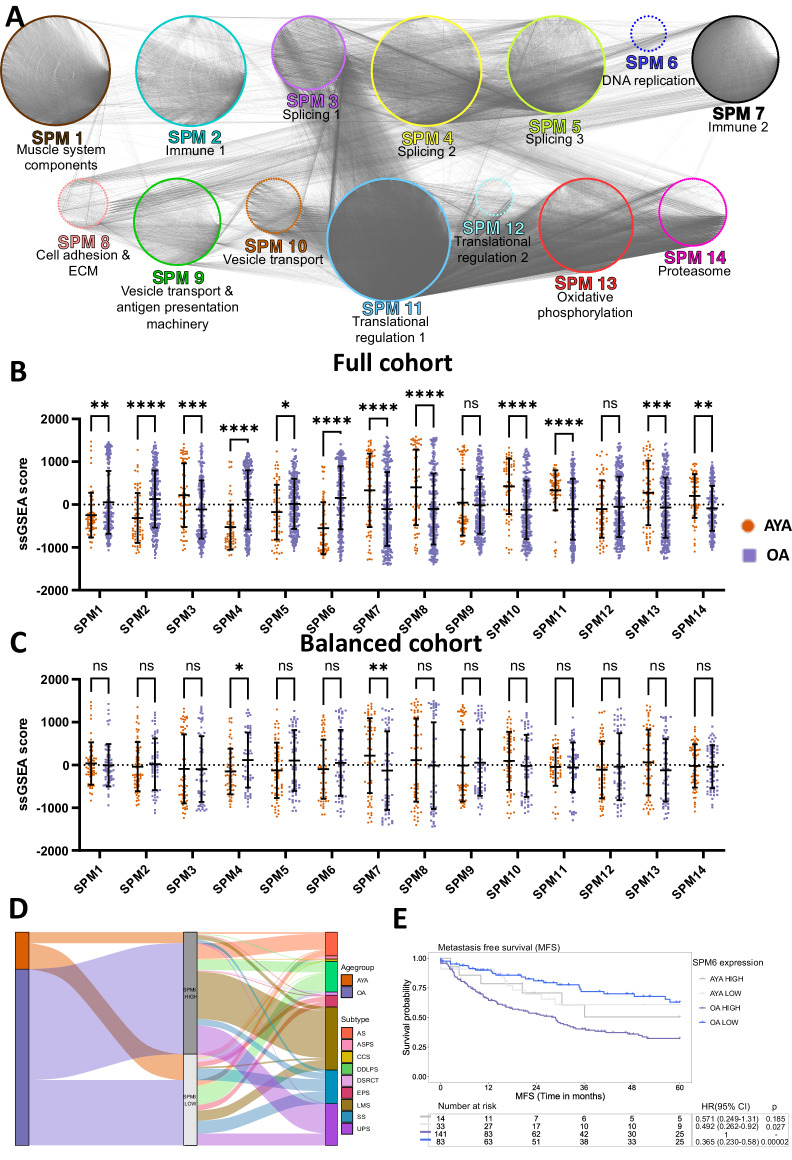
Methods: To define the molecular features between AYA and older adult (OA) patients, we analysed the proteomic profiles of a large cohort of soft tissue tumours across 10 histological subtypes (AYA n = 66, OA n = 243), and also analysed publicly available functional genomic data from soft tissue tumour cell lines (AYA n = 5, OA n = 8).

Results: Biological hallmarks analysis demonstrates that OA tumours are significantly enriched in MYC targets compared to AYA tumours. By comparing the patient-level proteomic data with functional genomic profiles from sarcoma cell lines, we show that the mRNA splicing pathway is an intrinsic vulnerability in cell lines from OA patients and that components of the spliceosome complex are independent prognostic factors for metastasis free survival in AYA patients.

Conclusions: Our study highlights the importance of performing age-specific molecular profiling studies to identify risk stratification tools and targeted agents tailored for the clinical management of AYA patients.

Plain language summary

Soft tissue tumours are cancers that develop in the connective and supporting tissues of the body, such as muscle or fat. These tumours arise in patients across the entire age range. However, improvements in survival outcomes in adolescent and young adult (AYA) patients have lagged behind outcomes in older adults (OA) and children. To better understand the biology of AYA patients with soft tissue tumours, we analysed protein profiles across 10 different types. We identified biological differences between AYA and OA patients and report an age-specific signature that can potentially be used to help predict which AYA patients are more likely to have aggressive cancers that will spread to other parts of the body. Our study highlights the importance of performing age-specific studies to identify new tools to predict patient outcomes and potentially find more suitable treatments.


Conflict of interest statement

The authors declare no competing interests.

Figures

Fig. 1
Fig. 1. Overview of the adolescent and young adult (AYA) and older adult (OA) patients in the cohort.
a Distribution of patient sex, anatomical site, and histological subtype within the AYA and OA cohorts. b Kaplan–Meier plot of overall survival (OS) for AYA and OA patients. Hazard ratio (HR), 95% confidence intervals (CI) and p value determined by univariable Cox regression. AS angiosarcoma, ASPS alveolar soft part sarcoma, CCS clear cell sarcoma, DDLPS dedifferentiated liposarcoma, DSRCT desmoplastic small round cell tumour, DE desmoid tumour, EPS epithelioid sarcoma, LMS leiomyosarcoma, SS synovial sarcoma, UPS undifferentiated pleomorphic sarcoma.
Fig. 2
Fig. 2. Analysis of the adolescent and young adult (AYA) and older adult (OA) proteomic landscape.
a Annotated heatmap showing the unsupervised clustering (Pearson’s distance) of 3299 proteins across the study cohort. Patients are ordered from youngest (left) to oldest (right). From top to bottom, panels indicate tumour size, anatomical site, tumour grade, patient sex, histological subtype, and patient age group. b Volcano plot showing significantly upregulated proteins in AYA and OA patient tumours. Significant proteins (false discovery rate <0.05, fold change >2) determined by multiple t-test followed by Benjamini–Hochberg procedure are shown in yellow. Proteins that remained significant after multivariable logistic regression analysis to account for confounding factors are shown in purple. c Significantly enriched hallmark gene sets (q < 0.05) in OA patients using single sample gene set enrichment analysis (ssGSEA) scores, as determined by two-way analysis of variance (ANOVA) followed by Šidák correction. Following multivariable logistic regression to account for confounding factors, the MYC targets hallmark gene set remained significant (p = 0.047). Boxplots show ssGSEA scores, with boxes indicating the 25th and 75th percentile and the black dot indicating the 50th percentile. Whiskers extend from the 25th percentile − (1.5* interquartile range) to the 75th percentile + (1.5* interquartile range), and outliers are plotted as grey points. AS angiosarcoma, ASPS alveolar soft part sarcoma, CCS clear cell sarcoma, DDLPS dedifferentiated liposarcoma, DSRCT desmoplastic small round cell tumour, DES desmoid tumour, EPS epithelioid sarcoma, LMS leiomyosarcoma, SS synovial sarcoma, UPS undifferentiated pleomorphic sarcoma.
Fig. 3
Fig. 3. Differential expression of sarcoma proteomic modules (SPM) in adolescent and young adult (AYA) and older adult (OA) patients.
a Protein co-expression network showing the 14 previously described SPM identified in the full proteomic cohort. Nodes indicate proteins and are coloured based on SPM membership. Edges indicate a correlation between protein expression and thickness of edges are scaled to the correlation score. b Plot showing single sample gene set enrichment analysis (ssGSEA) scores of the 14 SPMs for AYA and OA patients in the full cohort (n = 309, 66 AYA, 243 OA). c Plot showing single sample gene set enrichment analysis (ssGSEA) scores of the 14 SPMs for AYA and OA patients in a balanced number of cases in both age groups for each histological subtype (n = 120, 60 AYA, 60 OA). Error bars indicate the mean ± 1 standard deviation. Statistical significance was determined by two-way analysis of variance (ANOVA) using an uncorrected Fisher’s least significant difference (LSD) test. ****p < 0.0001, ***p < 0.001, **p < 0.01, *p < 0.05. d Sankey plot showing the distribution of each patient age group and histological subtype that falls into the SPM6-high and low expression groups. e Kaplan–Meier plot of metastasis free survival (MFS) for AYA and OA patients with high and low median expression levels of SPM6 proteins. Hazard ratio (HR), 95% confidence intervals (CI) and p value determined by univariable Cox regression. AS angiosarcoma, ASPS alveolar soft part sarcoma, CCS clear cell sarcoma, DDLPS dedifferentiated liposarcoma, DSRCT desmoplastic small round cell tumour, ECM extracellular matrix, EPS epithelioid sarcoma, LMS leiomyosarcoma, SS synovial sarcoma, UPS undifferentiated pleomorphic sarcoma.
Fig. 4
Fig. 4. Comparative functional genomic and proteomic analysis identifies the prognostic value of the spliceosome.
a Overview schematic of the comparative functional genomic and proteomic analysis. b Gene set enrichment analysis (GSEA) results showing the top five enriched reactome gene sets based on normalised enrichment score (NES) in the older adult (OA) group in the cell line functional genomics data from The Cancer Cell Line Encyclopaedia (CCLE) (left) and patient proteomics data (right). Overlapping gene sets enriched in both datasets are highlighted in blue. c Small nuclear ribonucleoprotein (snRNP) subunit genes that comprise the spliceosome complex found within the mRNA splicing Reactome gene set, which are identified in the CCLE cell line functional genomic and patient proteomic datasets. Genes that are only identified in the cell line functional genomic dataset are indicated with a dotted border. Genes that are core enriched as determined by GSEA leading-edge analysis in OA versus adolescent and young adult (AYA) patients in the CCLE cell line functional genomic and patient proteomic datasets are shown in green and yellow, respectively. Linkages indicate protein–protein interaction scores obtained from the STRING database, with a darker line indicating a higher score (cut-off >0.7). d Overview of multivariable Cox results for AYA and OA patients with high and low expression of each of the 21 subunits of the spliceosome complex as defined by Hegele et al. (based on median protein expression), and metastasis free survival (MFS). e Kaplan–Meier plot of MFS for AYA and OA patients with high and low expression of U2 snRNP proteins. Hazard ratio (HR), 95% confidence intervals (CI) and p value determined by univariable Cox regression. FDR false discovery rate.

Similar articles

Cited by

References

    1. WHO Classification of Tumours Editorial Board. Soft Tissue and Bone Tumours (International Agency for Research on Cancer, 2020).
    1. Trama A, Botta L, Steliarova-Foucher E. Cancer burden in adolescents and young adults: a review of epidemiological evidence. Cancer J. 2018;24:256–266. doi: 10.1097/PPO.0000000000000346. - DOI - PubMed
    1. Papworth KE, et al. Soft-tissue sarcoma in adolescents and young adults compared with older adults: A report among 5000 patients from the Scandinavian Sarcoma Group Central Register. Cancer. 2019;125:3595–3602. doi: 10.1002/cncr.32367. - DOI - PubMed
    1. Bleyer A, Montello M, Budd T, Saxman S. National survival trends of young adults with sarcoma: lack of progress is associated with lack of clinical trial participation. Cancer. 2005;103:1891–1897. doi: 10.1002/cncr.20995. - DOI - PubMed
    1. Shaw PH, Hayes-Lattin B, Johnson R, Bleyer A. Improving enrollment in clinical trials for adolescents with cancer. Pediatrics. 2014;133:S109–S113. doi: 10.1542/peds.2014-0122F. - DOI - PubMed