. 2024 May 18;15(1):4253.
doi: 10.1038/s41467-024-48667-6.

Histopathologic image-based deep learning classifier for predicting platinum-based treatment responses in high-grade serous ovarian cancer

Affiliations

Histopathologic image-based deep learning classifier for predicting platinum-based treatment responses in high-grade serous ovarian cancer

Byungsoo Ahn et al. Nat Commun. .

Abstract

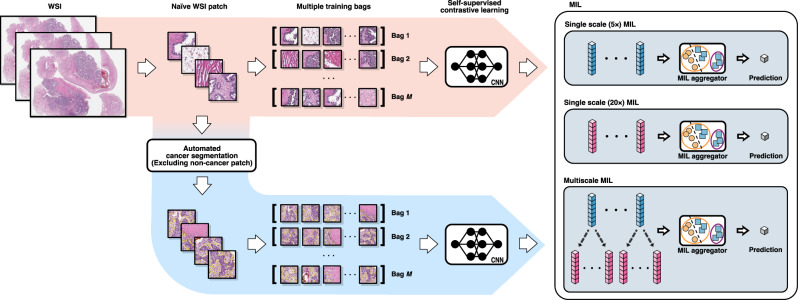
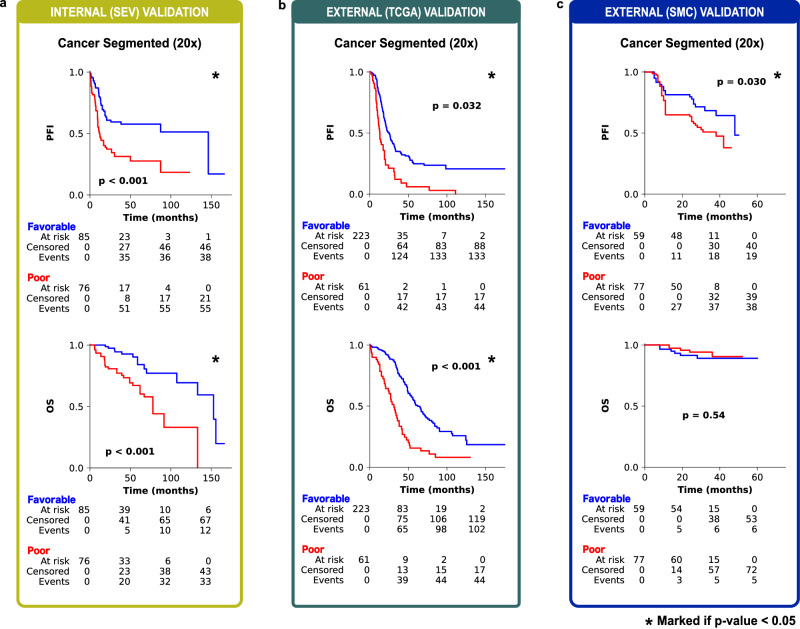
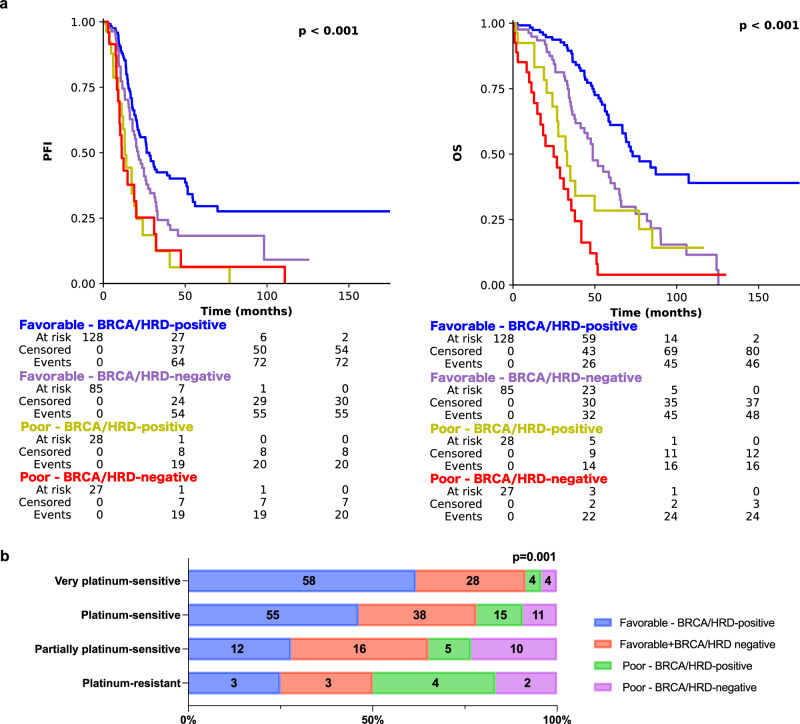
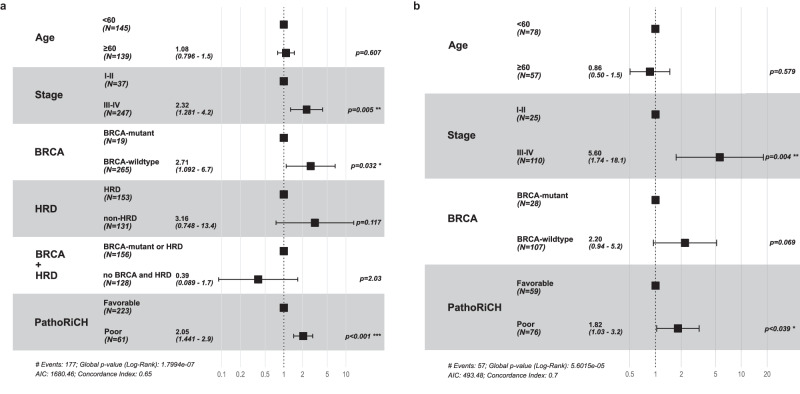
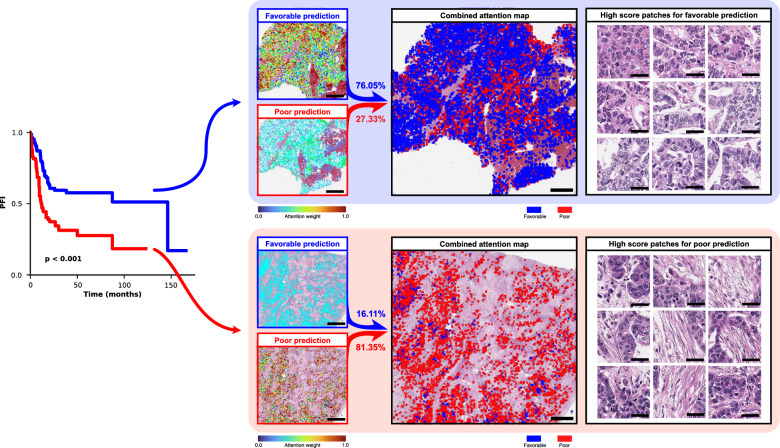
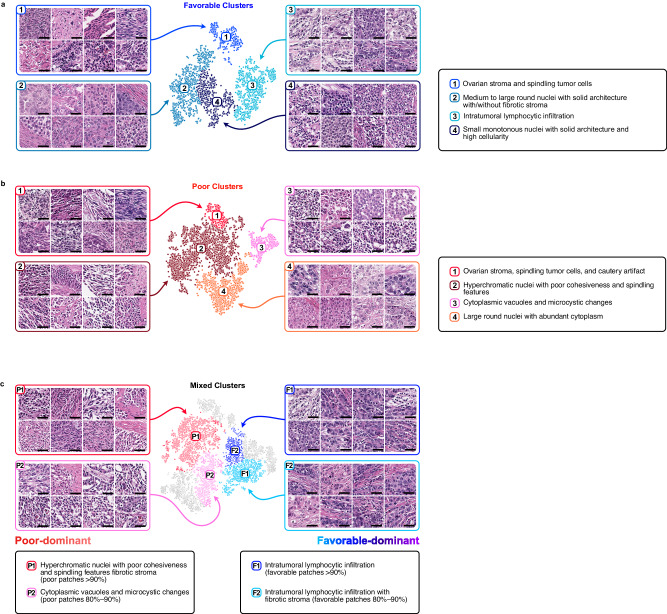
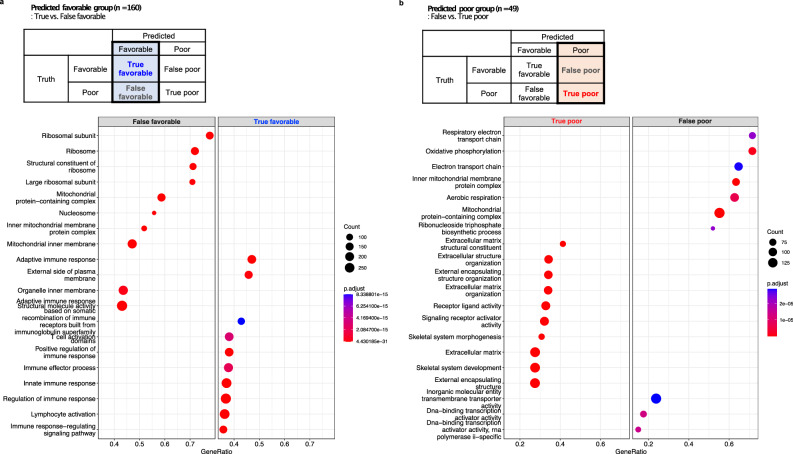
Platinum-based chemotherapy is the cornerstone treatment for female high-grade serous ovarian carcinoma (HGSOC), but choosing an appropriate treatment for patients hinges on their responsiveness to it. Currently, no available biomarkers can promptly predict responses to platinum-based treatment. Therefore, we developed the Pathologic Risk Classifier for HGSOC (PathoRiCH), a histopathologic image-based classifier. PathoRiCH was trained on an in-house cohort (n = 394) and validated on two independent external cohorts (n = 284 and n = 136). The PathoRiCH-predicted favorable and poor response groups show significantly different platinum-free intervals in all three cohorts. Combining PathoRiCH with molecular biomarkers provides an even more powerful tool for the risk stratification of patients. The decisions of PathoRiCH are explained through visualization and a transcriptomic analysis, which bolster the reliability of our model's decisions. PathoRiCH exhibits better predictive performance than current molecular biomarkers. PathoRiCH will provide a solid foundation for developing an innovative tool to transform the current diagnostic pipeline for HGSOC.


Conflict of interest statement

The authors declare no competing interests.

Figures

Fig. 1
Fig. 1. Overview of our multiple instance learning models.
Patches of varying magnifications (5× and 20×) were extracted from the whole-slide images (WSIs). The patches were then processed using automated cancer segmentation to exclude patches without cancer cells and fed into a contrastive self-supervised learning algorithm (blue arrow path). Alternatively, all patches, including those without cancer cells, could be fed directly into the self-supervised learning algorithm to include all tissues in the WSIs (red arrow path). Separate multiple instance learning (MIL) methods were used for two single scales and one multiscale magnification setting (5×, 20×, and both) for each image area. Therefore, six different MIL models were generated. For the multiscale MILs, feature pyramids were formed by concatenating the embeddings of different scales of WSIs to train the MIL aggregator.
Fig. 2
Fig. 2. Kaplan–Meier survival analysis of the cancer-segmented area 20× magnification multiple instance learning model (PathoRiCH).
Two-sided Kaplan–Meier survival analysis was used. a In the internal validation, the PathoRiCH-predicted favorable and poor groups exhibited significant differences in the platinum-free interval (PFI) and overall survival (OS) (p = 4.17E-05 and p = 8.73E-05, respectively). b Analysis of the TCGA external validation cohort revealed significant patient stratification for PFI (p = 0.032) and OS (p = 1.06E-09). c The SMC external validation cohort also showed significant patient stratification for PFI (p = 0.030), but it did not reach statistical significance for OS (p = 0.54).
Fig. 3
Fig. 3. Kaplan–Meier survival analyses and distribution of the true platinum-free interval groups of PathoRiCH + BRCA + HRD in the TCGA external validation cohort.
a Kaplan–Meier survival plots of patients categorized by combined PathoRiCH, BRCA, and HRD results. The combined PathoRiCH, BRCA, and HRD significantly differentiated response groups in the platinum-free interval (PFI) and overall survival (OS) (p = 1.07E-05 and p = 3.30E-16, respectively). The favorable–BRCA/HRD-positive group displayed the most favorable PFI, and the poor–BRCA/HRD-positive and poor–BRCA/HRD-negative groups showed the worst PFI. Two-sided Kaplan–Meier survival analysis was used. b Distribution of the four PFI groups (platinum resistant (PFI ≤ 6 months), partially platinum resistant (6–12 months), platinum sensitive (12–24 months), and very platinum sensitive (>24 months)) by combined PathoRiCH, BRCA, and HRD. The colored bars indicate the percentage of predictions for each outcome group (blue for favorable and red for poor), with numerical values within each bars showing the case count for each category. The combined PathoRiCH+BRCA + HRD showed significantly different distributions for the four PFI groups (p = 0.001).
Fig. 4
Fig. 4. Multivariate Cox regression analyses in the TCGA and SMC external validation cohorts.
The multivariate Cox regression analysis was conducted using six variables: age, FIGO stage, BRCA mutation status, HRD status, combined BRCA and HRD status, and PathoRiCH prediction. The data are presented with error bar representing 95% confidence interval. a In the TCGA cohort, PathoRiCH stood out as the most powerful independent prognostic factor (p = 6.57E-05), followed by FIGO stage (p = 0.005) and BRCA status (p = 0.32). b In the SMC cohort, FIGO stage (p = 0.004) and PathoRiCH (p = 0.39) stood out as significant independent prognostic factors.
Fig. 5
Fig. 5. Attention map analysis of the PathoRiCH-predicted favorable and poor groups.
The left side presents a two-sided Kaplan–Meier survival analysis according to PathoRiCH predictions. For these predictions, separate attention maps of favorable and poor predictions were created and then combined to generate a combined prediction attention map for each patient (scale bar = 2 mm). The figure shows two representative cases of patients from the favorable and poor groups, with the corresponding attention maps and high-score patches displayed side-by-side (scale bar = 50 µm).
Fig. 6
Fig. 6. Cluster analysis of high-score patches from the PathoRiCH-predicted favorable and poor groups.
(Scale bar = 50 µm for all patch images) (a, b) Clusters were initially created using Gaussian mixture models (GMMs), with high-score patches serving as inputs for each group. The resulting clusters were then evaluated by pathologists, who further combined clusters with similar histological features. The final grouping comprised four favorable and four poor histologically distinct clusters. c The combination of high-score patches from the favorable and poor predicted groups was clustered based on their histological similarities using GMM. Seven clusters were created, and two favorable group–dominant clusters and two poor group–dominant clusters were identified.
Fig. 7
Fig. 7. Differential gene ontology (GO) profiles comparing True versus False classifications within the PathoRiCH-predicted favorable and poor outcome groups.
a Within the favorable outcome predictions, the true favorable-predicted (n = 134) predominantly featured genes involved in immune response, and the false favorable-predicted (n = 25) category was enriched for ribosomal- and mitochondrial-associated genes. b Within the poor outcome predictions, the true poor-predicted (n = 19) group was characterized by genes associated with the extracellular matrix, and the false poor-predicted (n = 30) category was enriched for mitochondrial- and ribosomal-associated genes. ClusterProfiler was used for both GO analysis with a Benjamini–Hochberg procedure.

References

    1. NIH SEER Cancer Stat Facts. SEER. https://seer.cancer.gov/statfacts/index.html.
    1. Gockley A, et al. Outcomes of women with high-grade and low-grade advanced-stage serous epithelial ovarian cancer. Obstet. Gynecol. 2017;129:439–447. doi: 10.1097/AOG.0000000000001867. - DOI - PMC - PubMed
    1. Bowtell DD, et al. Rethinking ovarian cancer II: reducing mortality from high-grade serous ovarian cancer. Nat. Rev. Cancer. 2015;15:668–679. doi: 10.1038/nrc4019. - DOI - PMC - PubMed
    1. Stewart, L. & Advanced Ovarian Cancer Trialists Group. Chemotherapy for advanced ovarian cancer. Advanced Ovarian Cancer Trialists Group. Cochrane Database Syst. Rev. CD001418. 10.1002/14651858.CD001418 (2000). - PubMed
    1. Davis A, Tinker AV, Friedlander M. Platinum resistant” ovarian cancer: what is it, who to treat and how to measure benefit? Gynecol. Oncol. 2014;133:624–631. doi: 10.1016/j.ygyno.2014.02.038. - DOI - PubMed

MeSH terms