Comparative Study
. 2024 May 18;43(1):14.
doi: 10.1186/s40101-024-00361-8.

Comparisons between wrinkles and photo-ageing detected and self-reported by the participant or identified by trained assessors reveal insights from Chinese individuals in the Singapore/Malaysia Cross-sectional Genetics Epidemiology Study (SMCGES) cohort

Affiliations
Comparative Study

Comparisons between wrinkles and photo-ageing detected and self-reported by the participant or identified by trained assessors reveal insights from Chinese individuals in the Singapore/Malaysia Cross-sectional Genetics Epidemiology Study (SMCGES) cohort

Jun Yan Ng et al. J Physiol Anthropol. .

Abstract

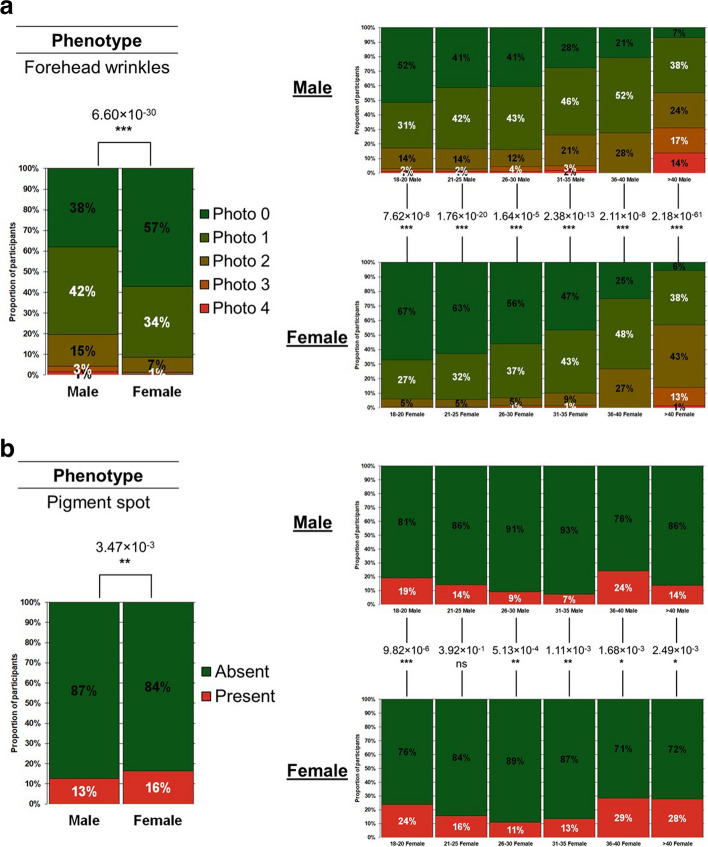
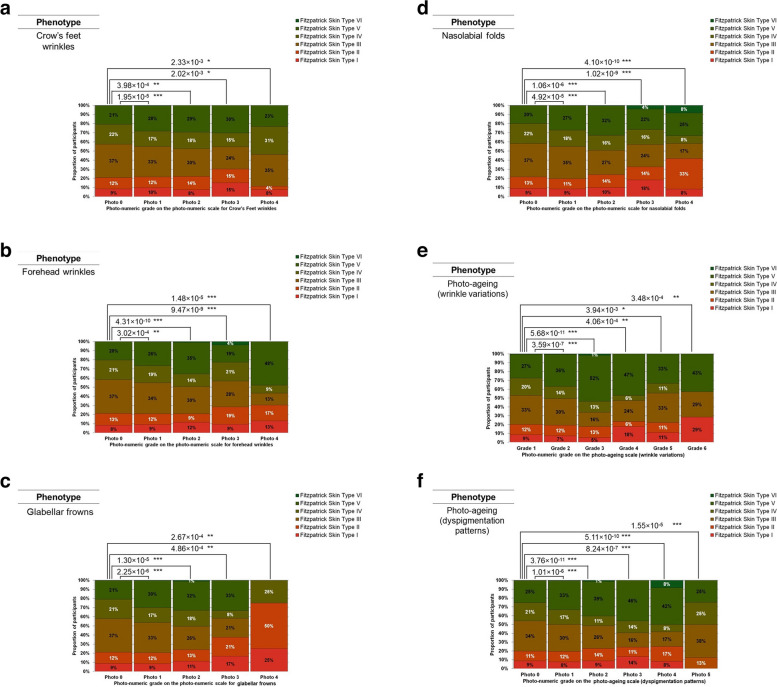
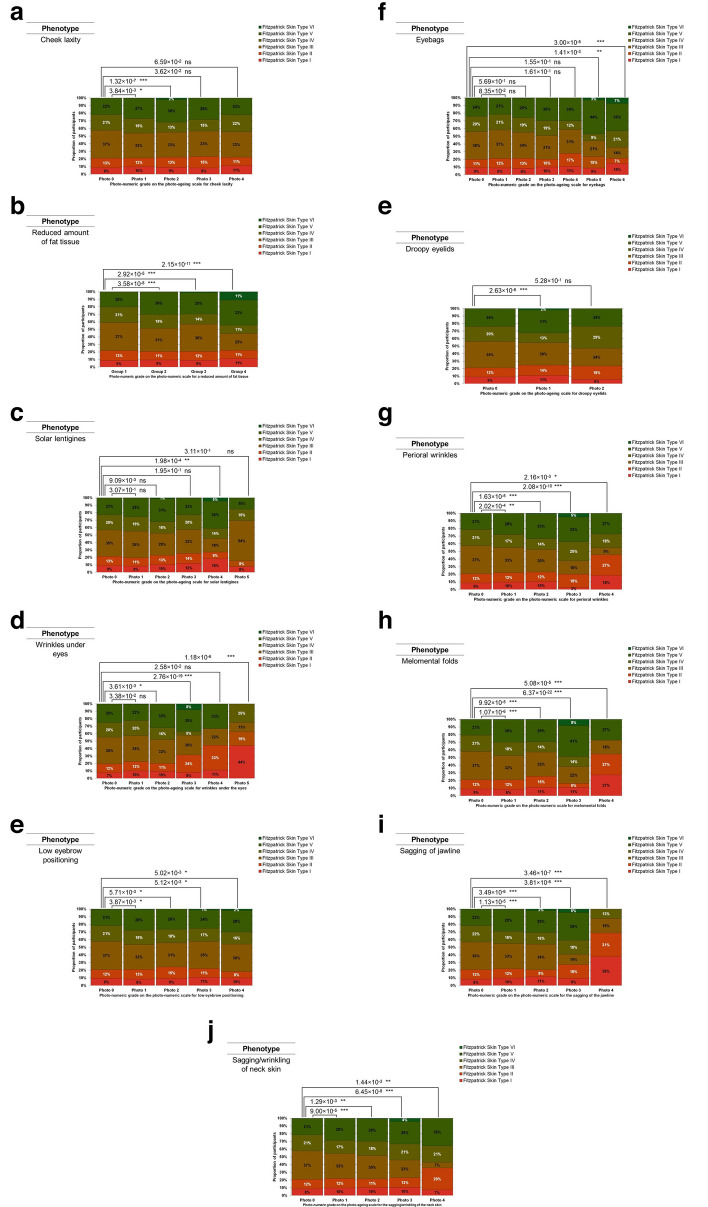
Background: Changes develop on the facial skin as a person ages. Other than chronological time, it has been discovered that gender, ethnicity, air pollution, smoking, nutrition, and sun exposure are notable risk factors that influence the development of skin ageing phenotypes such as wrinkles and photo-ageing. These risk factors can be quantified through epidemiological collection methods. We previously studied wrinkles and photo-ageing in detail using photo-numeric scales. The analysis was performed on the ethnic Chinese skin by three trained assessors. Recent studies have shown that it is possible to use self-reported data to identify skin-related changes including skin colour and skin cancer. In order to investigate the association between risk factors and skin ageing phenotypic outcomes in large-scale epidemiological studies, it would be useful to evaluate whether it is also possible for participants to self-report signs of ageing on their skin.

Aim: We have previously identified several validated photo-numeric scales for wrinkling and photo-ageing to use on ethnic Chinese skin. Using these scales, our trained assessors grade wrinkling and photo-ageing with moderately high inter-assessor concordance and agreement. The main objective of this study involves letting participants grade self-reported wrinkling and photo-ageing using these same scales. We aim to compare the concordance and agreement between signs of skin ageing by the participant and signs of ageing identified by our assessors.

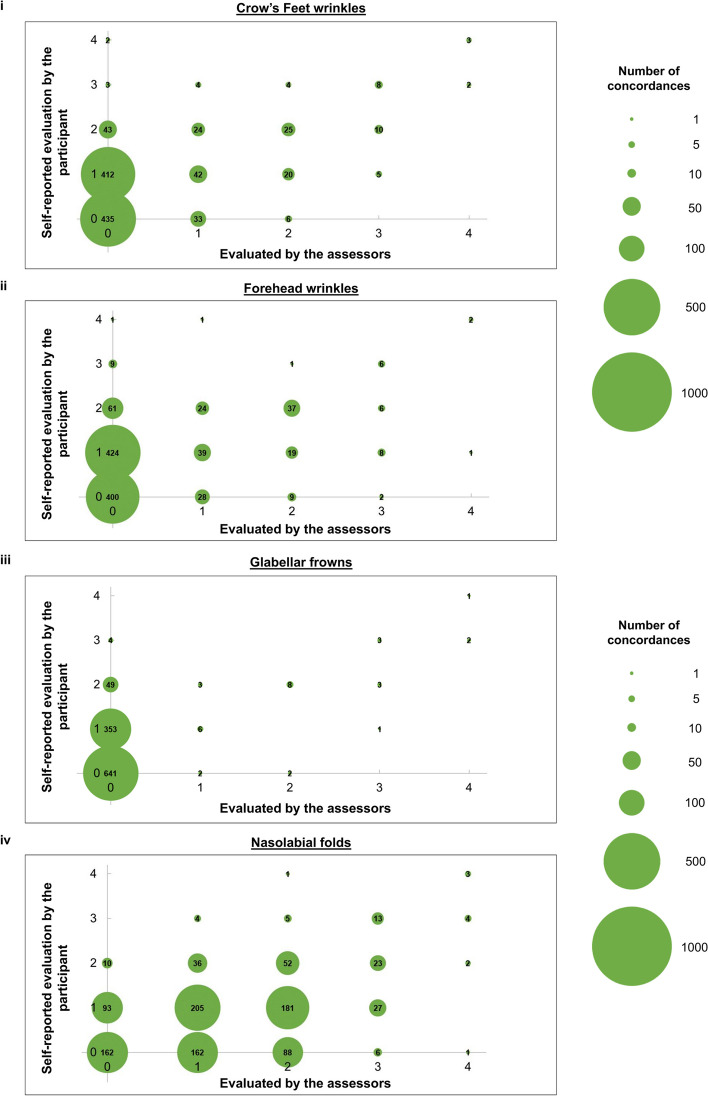
Method: Three trained assessors studied facial photo-ageing on 1081 ethnic Chinese young adults from the Singapore/Malaysia Cross-sectional Genetics Epidemiology Study (SMCGES) cohort. Self-reported facial photo-ageing data by the same 1081 participants were also collated and the two sets of data are compared.

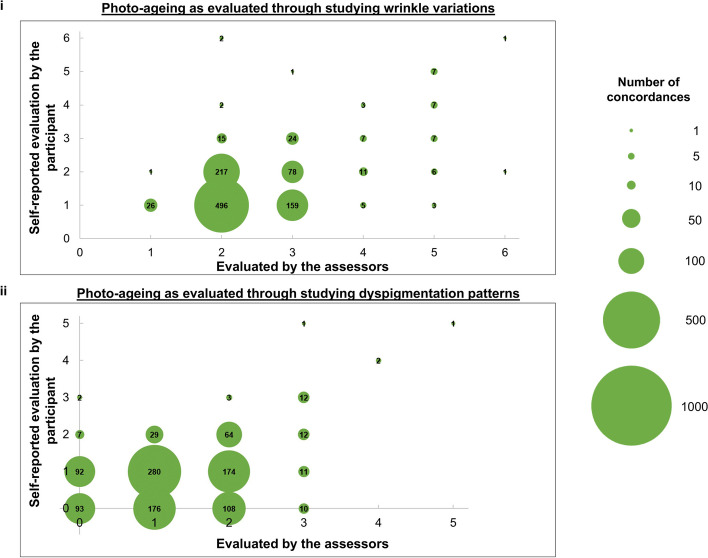
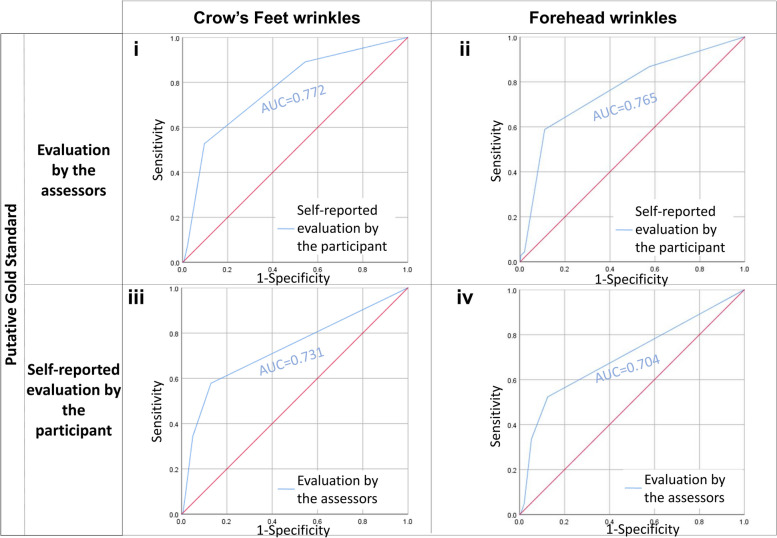
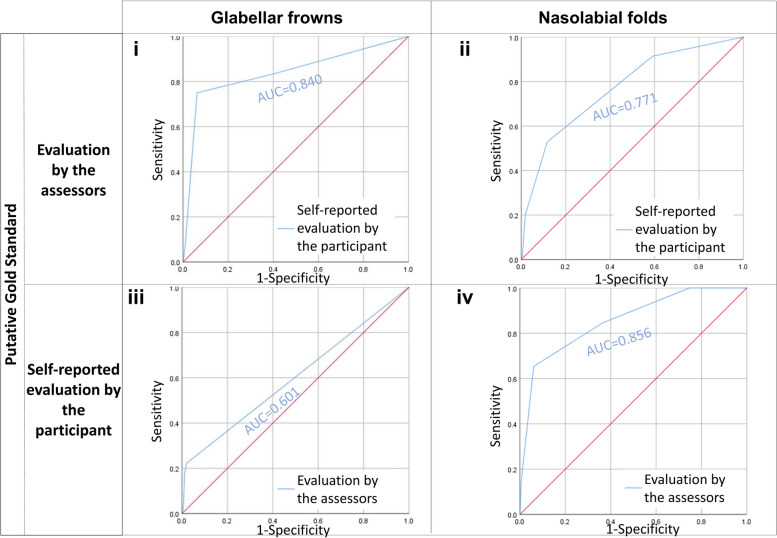
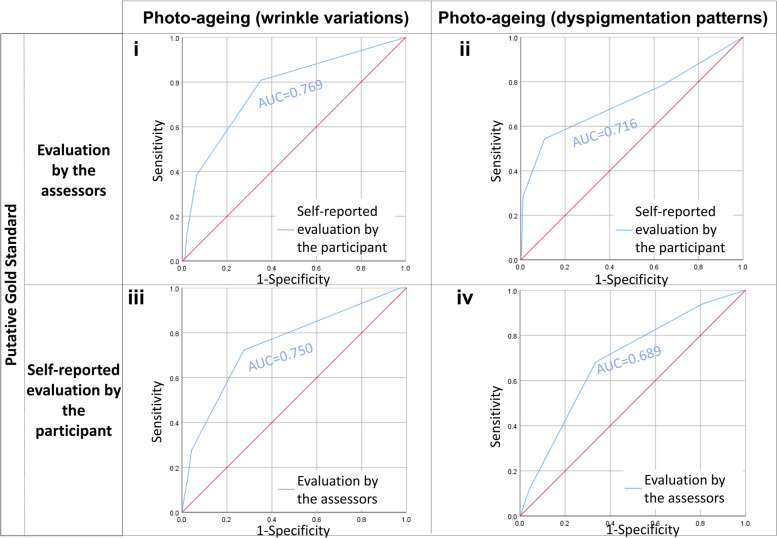
Results: Here, we found that self-reported signs of photo-ageing are concordant with photo-ageing detected by our assessors. This finding is consistent whether photo-ageing is evaluated through studying wrinkle variations (Spearman's rank correlation (ρ) value: 0.246-0.329) or through studying dyspigmentation patterns (Spearman's rank correlation (ρ) value 0.203-0.278). When studying individual wrinkles, both participants and assessors often detect the presence of the same wrinkle (Spearman's rank correlation (ρ) value 0.249-0.366). A weak-to-fair level of agreement between both participants and assessors (Cohen's kappa (κ) values: 0.041-0.233) persists and is statistically significant after accounting for agreements due to chance. Both the participant and the assessor are largely consistent in evaluating the extent of photo-ageing (area under curve (AUC) values 0.689-0.769) and in discerning between the presence or absence of a given facial wrinkle (area under curve (AUC) values 0.601-0.856).

Conclusion: When we analyse the overall appearance of the face, our results show that signs of photo-ageing identified by the participant are concordant with signs of photo-ageing identified by our assessors. When we focused our analysis on specific areas of the face, we found that participants were more likely to identify and self-report the same wrinkles that our assessors have also detected. Here, we found that self-reported signs of skin ageing provide a satisfactory approximation to the signs of skin ageing identified by our assessors. The ability to use self-reported signs of skin ageing should also be evaluated on scales beyond the ones discussed in this study. Currently, there are not as many photo-numeric scales for quantifying dyspigmentation patterns as there are for quantifying wrinkle variations. As Chinese skin is known to become dyspigmented more easily with age, more photo-numeric scales need to be developed and properly validated.


Conflict of interest statement

F.T.C reports grants from the National University of Singapore, Singapore Ministry of Education Academic Research Fund, Singapore Immunology Network, National Medical Research Council (NMRC) (Singapore), Biomedical Research Council (BMRC) (Singapore), National Research Foundation (NRF) (Singapore), Singapore Food Agency (SFA), and the Agency for Science Technology and Research (A*STAR) (Singapore), during the conduct of the study; and consulting fees from Sime Darby Technology Centre; First Resources Ltd; Genting Plantation, Olam International, and Syngenta Crop Protection, outside the submitted work. The other authors declare no other competing interests.

Figures

Fig. 1
Fig. 1
i Bubble plots compare the evaluation of Crow’s Feet wrinkles by our three trained assessors and the self-reported evaluation by the participant. For the evaluation performed by our assessors, the phenotype is determined to be present only if all three assessors identify it to be present. Larger circles indicate greater concordance between the two scales. Numbers in the circles are the number of concordances. The sample size of each plot is 1081 participants. ii Bubble plots compare the evaluation of forehead wrinkles by our three trained assessors and the self-reported evaluation by the participant. For the evaluation performed by our assessors, the phenotype is determined to be present only if all three assessors identify it to be present. Larger circles indicate greater concordance between the two scales. Numbers in the circles are the number of concordances. The sample size of each plot is 1081 participants. iii Bubble plots compare the evaluation of glabellar frowns by our three trained assessors and the self-reported evaluation by the participant. For the evaluation performed by our assessors, the phenotype is determined to be present only if all three assessors identify it to be present. Larger circles indicate greater concordance between the two scales. Numbers in the circles are the number of concordances. The sample size of each plot is 1081 participants. iv Bubble plots compare the evaluation of nasolabial folds by our three trained assessors and the self-reported evaluation by the participant. For the evaluation performed by our assessors, the phenotype is determined to be present only if all three assessors identify it to be present. Larger circles indicate greater concordance between the two scales. Numbers in the circles are the number of concordances. The sample size of each plot is 1081 participants
Fig. 2
Fig. 2
i Bubble plots compare photo-ageing as evaluated through studying wrinkle variations. Evaluations conducted by our three trained assessors are compared with the self-reported evaluation by the participant. For the evaluation performed by our assessors, the phenotype is determined to be present only if all three assessors identify it to be present. Larger circles indicate greater concordance between the two scales. Numbers in the circles are the number of concordances. The sample size of each plot is 1081 participants. ii Bubble plots compare photo-ageing as evaluated through studying dyspigmentation patterns. Evaluations conducted by our three trained assessors are compared with the self-reported evaluation by the participant. For the evaluation performed by our assessors, the phenotype is determined to be present only if all three assessors identify it to be present. Larger circles indicate greater concordance between the two scales. Numbers in the circles are the number of concordances. The sample size of each plot is 1081 participants
Fig. 3
Fig. 3
i Receiver operator characteristic (ROC) curves treat the evaluation by our three trained assessors as the gold standard and compare it with the self-reported evaluation by the participant. AUC refers to the area under curve values of the corresponding ROC curves. ROC curves describe grading data for Crow’s Feet wrinkles. ii Receiver operator characteristic (ROC) curves treat the evaluation by our three trained assessors as the gold standard and compare it with the self-reported evaluation by the participant. AUC refers to the area under curve values of the corresponding ROC curves. ROC curves describe grading data for forehead wrinkles. iii Receiver operator characteristic (ROC) curves treat the self-reported evaluation by the participant as the gold standard and compare it with the evaluation by our three trained assessors. AUC refers to the area under curve values of the corresponding ROC curves. ROC curves describe grading data for Crow’s Feet wrinkles. iv Receiver Operator Characteristic (ROC) curves treat the self-reported evaluation by the participant as the gold standard and compare it with the evaluation by our three trained assessors. AUC refers to the area under curve values of the corresponding ROC curves. ROC curves describe grading data for forehead wrinkles
Fig. 4
Fig. 4
i Receiver operator characteristic (ROC) curves treat the evaluation by our three trained assessors as the gold standard and compare it with the self-reported evaluation by the participant. AUC refers to the area under curve values of the corresponding ROC curves. ROC curves describe grading data for glabellar frowns. ii Receiver operator characteristic (ROC) curves treat the evaluation by our three trained assessors as the gold standard and compare it with the self-reported evaluation by the participant. AUC refers to the area under curve values of the corresponding ROC curves. ROC curves describe grading data for nasolabial folds. iii Receiver operator characteristic (ROC) curves treat the self-reported evaluation by the participant as the gold standard and compare it with the evaluation by our three trained assessors. AUC refers to the area under curve values of the corresponding ROC curves. ROC curves describe grading data for glabellar frowns. iv Receiver operator characteristic (ROC) curves treat the self-reported evaluation by the participant as the gold standard and compare it with the evaluation by our three trained assessors. AUC refers to the area under curve values of the corresponding ROC curves. ROC curves describe grading data for nasolabial folds
Fig. 5
Fig. 5
i Receiver operator characteristic (ROC) curves treat the evaluation by our three trained assessors as the gold standard and compares it with the self-reported evaluation by the participant. AUC refers to the area under curve values of the corresponding ROC curves. ROC curves describe grading data for photo-ageing as evaluated through studying wrinkle variations. ii Receiver operator characteristic (ROC) curves treat the evaluation by our three trained assessors as the gold standard and compare it with the self-reported evaluation by the participant. AUC refers to the area under curve values of the corresponding ROC curves. ROC curves describe grading data for photo-ageing as evaluated through studying dyspigmentation patterns. iii Receiver operator characteristic (ROC) curves treat the self-reported evaluation by the participant as the gold standard and compare it with the evaluation by our three trained assessors. AUC refers to the area under curve values of the corresponding ROC curves. ROC curves describe grading data for photo-ageing as evaluated through studying wrinkle variations. iv Receiver operator characteristic (ROC) curves treat the self-reported evaluation by the participant as the gold standard and compare it with the evaluation by our three trained assessors. AUC refers to the area under curve values of the corresponding ROC curves. ROC curves describe grading data for photo-ageing as evaluated through studying dyspigmentation patterns
Fig. 6
Fig. 6
a Severity of forehead wrinkles stratified by age and sex. Forehead wrinkles are quantified as a grade on a validated photo-numeric scale. The chi-square test p values for all the pair-wise comparisons conducted were corrected for multiple testing through the Bonferroni correction method. The photo-numeric scale used for assessing forehead wrinkles can be found in Supplementary Table S1. b Presence or absence of pigment spots stratified by age and sex. Pigment spots are quantified as a binary grade. Photos of pigment spots are obtained from Ferri’s Fast Facts in Dermatology. Participants are deemed to have pigment spots if their skin appear similar to the photos from Ferri's Fast Facts in Dermatology. The chi-square test p values for all the pair-wise comparisons conducted were corrected for multiple testing through the Bonferroni correction method. The citation for Ferri’s Fast Facts in Dermatology, in which photos used for assessing pigment spots are available, can be found in Supplementary Table S1
Fig. 7
Fig. 7
a Distribution of Fitzpatrick Skin Types I to VI across participants with different severities of Crow’s Feet wrinkles. Crow’s Feet wrinkles are quantified as a grade on a validated photo-numeric scale. The chi-square test p values for all the pair-wise comparisons conducted were corrected for multiple testing through the Bonferroni correction method. The photo-numeric scale used for this phenotypic assessment can be found in Supplementary Table S1. b Distribution of Fitzpatrick Skin Types I to VI across participants with different severities of forehead wrinkles. Forehead wrinkles are quantified as a grade on a validated photo-numeric scale. The chi-square test p values for all the pair-wise comparisons conducted were corrected for multiple testing through the Bonferroni correction method. The photo-numeric scale used for this phenotypic assessment can be found in Supplementary Table S1. c Distribution of Fitzpatrick Skin Types I to VI across participants with different severities of glabellar frowns. Glabellar frowns are quantified as a grade on a validated photo-numeric scale. The chi-square test p values for all the pair-wise comparisons conducted were corrected for multiple testing through the Bonferroni correction method. The photo-numeric scale used for this phenotypic assessment can be found in Supplementary Table S1. d Distribution of Fitzpatrick Skin Types I to VI across participants with different severities of nasolabial folds. Nasolabial folds are quantified as a grade on a validated photo-numeric scale. The chi-square test p values for all the pair-wise comparisons conducted were corrected for multiple testing through the Bonferroni correction method. The photo-numeric scale used for this phenotypic assessment can be found in Supplementary Table S1. e Distribution of Fitzpatrick Skin Types I to VI across participants with different severities of the wrinkling constituent of photo-ageing. The wrinkling constituent of photo-ageing is quantified as a grade on a validated photo-numeric scale. The Chi-square test p-values for all the pair-wise comparisons conducted were corrected for multiple testing through the Bonferroni correction method. The photo-numeric scale used for this phenotypic assessment can be found in Supplementary Table S1. f Distribution of Fitzpatrick Skin Types I to VI across participants with different severities of the dyspigmentation constituent of photo-ageing. The dyspigmentation constituent of photo-ageing is quantified as a grade on a validated photo-numeric scale. The chi-square test p values for all the pair-wise comparisons conducted were corrected for multiple testing through the Bonferroni correction method. The photo-numeric scale used for this phenotypic assessment can be found in Supplementary Table S1
Fig. 8
Fig. 8
a Distribution of Fitzpatrick Skin Types I to VI across participants with different cheek laxities. Cheek laxity is quantified as a grade on a validated photo-numeric scale. The chi-square test p values for all the pair-wise comparisons conducted were corrected for multiple testing through the Bonferroni correction method. The photo-numeric scale used for this phenotypic assessment can be found in Supplementary Table S1. b Distribution of Fitzpatrick Skin Types I to VI across participants with different amounts of fat tissue. The amount of fat tissue is quantified as a grade on a validated photo-numeric scale. The chi-square test p values for all the pair-wise comparisons conducted were corrected for multiple testing through the Bonferroni correction method. The photo-numeric scale used for this phenotypic assessment can be found in Supplementary Table S1. c Distribution of Fitzpatrick Skin Types I to VI across participants with different severities of solar lentigines. Solar lentigines are quantified as a grade on a validated photo-numeric scale. The chi-square test p values for all the pair-wise comparisons conducted were corrected for multiple testing through the Bonferroni correction method. The photo-numeric scale used for this phenotypic assessment can be found in Supplementary Table S1. d Distribution of Fitzpatrick Skin Types I to VI across participants with different severities of wrinkles under the eyes. Wrinkles under the eyes are quantified as a grade on a validated photo-numeric scale. The chi-square test p values for all the pair-wise comparisons conducted were corrected for multiple testing through the Bonferroni correction method. The photo-numeric scale used for this phenotypic assessment can be found in Supplementary Table S1. e Distribution of Fitzpatrick Skin Types I to VI across participants with different eyebrow positioning heights. Eyebrow positioning heights are quantified as a grade on a validated photo-numeric scale. The chi-square test p values for all the pair-wise comparisons conducted were corrected for multiple testing through the Bonferroni correction method. The photo-numeric scale used for this phenotypic assessment can be found in Supplementary Table S1. f Distribution of Fitzpatrick Skin Types I to VI across participants with different severities of eyebags. Eyebags are quantified as a grade on a validated photo-numeric scale. The chi-square test p values for all the pair-wise comparisons conducted were corrected for multiple testing through the Bonferroni correction method. The photo-numeric scale used for this phenotypic assessment can be found in Supplementary Table S1. g Distribution of Fitzpatrick Skin Types I to VI across participants with different severities of droopy eyelids. Droopy eyelids are quantified as a grade on a validated photo-numeric scale. The chi-square test p values for all the pair-wise comparisons conducted were corrected for multiple testing through the Bonferroni correction method. The photo-numeric scale used for this phenotypic assessment can be found in Supplementary Table S1. h Distribution of Fitzpatrick Skin Types I to VI across participants with different severities of perioral wrinkles. Perioral wrinkles are quantified as a grade on a validated photo-numeric scale. The chi-square test p values for all the pair-wise comparisons conducted were corrected for multiple testing through the Bonferroni correction method. The photo-numeric scale used for this phenotypic assessment can be found in Supplementary Table S1. i Distribution of Fitzpatrick Skin Types I to VI across participants with different severities of Melomental folds. Melomental folds are quantified as a grade on a validated photo-numeric scale. The chi-square test p values for all the pair-wise comparisons conducted were corrected for multiple testing through the Bonferroni correction method. The photo-numeric scale used for this phenotypic assessment can be found in Supplementary Table S1. j Distribution of Fitzpatrick Skin Types I to VI across participants with different severities of jawline sagging. Jawline sagging is quantified as a grade on a validated photo-numeric scale. The chi-square test p values for all the pair-wise comparisons conducted were corrected for multiple testing through the Bonferroni correction method. The photo-numeric scale used for this phenotypic assessment can be found in Supplementary Table S1. k Distribution of Fitzpatrick Skin Types I to VI across participants with different severities of sagging and/or wrinkling of the neck skin. Sagging and/or wrinkling of the neck skin is quantified as a grade on a validated photo-numeric scale. The chi-square test p values for all the pair-wise comparisons conducted were corrected for multiple testing through the Bonferroni correction method. The photo-numeric scale used for this phenotypic assessment can be found in Supplementary Table S1

Similar articles

Cited by

References

    1. Akoglu H. Turkish Journal of Emergency Medicine User ’ s guide to correlation coe ffi cients. 2018;18(August):91–93. doi: 10.1016/j.tjem.2018.08.001. - DOI - PMC - PubMed
    1. Ayer J, Ahmed A, Duncan-Parry B, E., Griffiths, P., Watson, T. W., & Griffiths, & . A photonumeric scale for the assessment of atrophic facial photodamage. Br J Dermatol. 2018;178(5):1190–1195. doi: 10.1111/bjd.16331. - DOI - PubMed
    1. Chahal HS, Lin Y, Ransohoff KJ, Hinds DA, Wu W, Dai H-J, Qureshi AA, Li W-Q, Kraft P, Tang JY, Han J, Sarin KY. Genome-wide association study identifies novel susceptibility loci for cutaneous squamous cell carcinoma. Nat Commun. 2016;7(1):12048. doi: 10.1038/ncomms12048. - DOI - PMC - PubMed
    1. Chahal HS, Wu W, Ransohoff KJ, Yang L, Hedlin H, Desai M, Lin Y, Dai HJ, Qureshi AA, Li WQ, Kraft P, Hinds DA, Tang JY, Han J, Sarin KY. Genome-wide association study identifies 14 novel risk alleles associated with basal cell carcinoma. Nat Commun. 2016;7:1–10. doi: 10.1038/ncomms12510. - DOI - PMC - PubMed
    1. Chan YH. Correlation analysis. Singapore Med J. 2003;44(12):614–619. - PubMed

Publication types

Supplementary concepts