Comparative Study
. 2024 May 18;25(1):211.
doi: 10.1186/s12931-024-02835-w.

Comparative microbiome analysis in cystic fibrosis and non-cystic fibrosis bronchiectasis

Affiliations
Comparative Study

Comparative microbiome analysis in cystic fibrosis and non-cystic fibrosis bronchiectasis

Heryk Motta et al. Respir Res. .

Abstract

Background: Bronchiectasis is a condition characterized by abnormal and irreversible bronchial dilation resulting from lung tissue damage and can be categorized into two main groups: cystic fibrosis (CF) and non-CF bronchiectasis (NCFB). Both diseases are marked by recurrent infections, inflammatory exacerbations, and lung damage. Given that infections are the primary drivers of disease progression, characterization of the respiratory microbiome can shed light on compositional alterations and susceptibility to antimicrobial drugs in these cases compared to healthy individuals.

Methods: To assess the microbiota in the two studied diseases, 35 subjects were recruited, comprising 10 NCFB and 13 CF patients and 12 healthy individuals. Nasopharyngeal swabs and induced sputum were collected, and total DNA was extracted. The DNA was then sequenced by the shotgun method and evaluated using the SqueezeMeta pipeline and R.

Results: We observed reduced species diversity in both disease cohorts, along with distinct microbial compositions and profiles of antimicrobial resistance genes, compared to healthy individuals. The nasopharynx exhibited a consistent microbiota composition across all cohorts. Enrichment of members of the Burkholderiaceae family and an increased Firmicutes/Bacteroidetes ratio in the CF cohort emerged as key distinguishing factors compared to NCFB group. Staphylococcus aureus and Prevotella shahii also presented differential abundance in the CF and NCFB cohorts, respectively, in the lower respiratory tract. Considering antimicrobial resistance, a high number of genes related to antibiotic efflux were detected in both disease groups, which correlated with the patient's clinical data.

Conclusions: Bronchiectasis is associated with reduced microbial diversity and a shift in microbial and resistome composition compared to healthy subjects. Despite some similarities, CF and NCFB present significant differences in microbiome composition and antimicrobial resistance profiles, suggesting the need for customized management strategies for each disease.

Keywords: Bronchiectasis; Cystic fibrosis; Microbiome; Non-cystic fibrosis; Resistome.


Conflict of interest statement

The authors declare no competing interests.

Figures
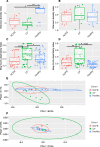
Fig. 1
Fig. 1
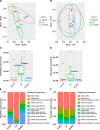
Diversity analysis in NCFB and CF patients and healthy subjects. A Alpha diversity in sputum microbiota. Sputum barplot illustrating Shannon diversity as a measure of alpha diversity. Healthy subjects display higher alpha diversity compared to individuals with CF and NCFB. B Alpha diversity in nasopharyngeal swab microbiota. Nasopharyngeal swab barplot illustrating Shannon diversity as a measure of alpha-diversity. No significant differences were observed among the three cohorts. C Interpersonal variation in sputum microbiota. Sputum barplot representing intra-cohort Bray–Curtis dissimilarity. The points denote pairwise Bray–Curtis distance combinations, revealing increased interpersonal variation within the CF cohort. D Interpersonal variation in nasopharyngeal swab microbiota. Nasopharyngeal swab barplot representing intra-cohort Bray–Curtis dissimilarity. The points denote pairwise Bray–Curtis distance combinations, revealing increased interpersonal variation within the CF cohort. E Sputum microbiota cluster analysis. PCoA of Bray–Curtis distances in sputum microbiota, showing the distinct separation of healthy subjects from disease cohorts. While the CF cohort exhibits less clustering than the NCFB group, there is a noticeable overlap between the two disease cohorts. F Nasopharyngeal swab microbiota cluster analysis. PCoA of Bray–Curtis distances in nasopharyngeal swab microbiota, showing clustered distribution among all three cohorts. Ellipses denote 95% confidence. Statistical significance was assessed using the Kruskal–Wallis test followed by Dunn’s post hoc test for all performed analyses as none assumed a normal distribution (* P ≤ 0.05, ** P ≤ 0.01, and **** P ≤ 0.0001)
Fig. 2
Fig. 2
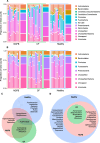
Phylum-level composition and core microbiota. A Sputum microbiota: Phylum-level composition of sputum microbiota in NCFB and healthy cohorts. Thinner bars represent individual subjects, while thicker bars represent the cohort average. B Nasopharyngeal swab microbiota: Phylum-level composition of nasopharyngeal swab microbiota as shown in (A). C and D Core microbiota at the genus level in the sputum (C) and nasopharyngeal swab (D) samples shown as Euler diagrams depicting unique and shared components
Fig. 3
Fig. 3
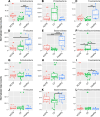
Phylum composition comparison. A-F Sputum analysis: Comparison of phylum-level composition between NCFB, CF, and healthy cohorts. G-L Nasopharyngeal swab analysis: Comparison of phylum-level composition in nasopharyngeal swabs for the above cohorts. Statistical significance: The Kruskal–Wallis test was applied followed by Dunn’s post hoc test, except for Bacteroidetes analysis, which used ordinary one-way ANOVA followed by Tukey’s multiple comparison test (* P ≤ 0.05, ** P ≤ 0.01, *** P ≤ 0.001, and **** P ≤ 0.0001)
Fig. 4
Fig. 4
Pairwise differential abundance analysis in sputum samples. A Healthy vs. CF: Differential abundance analysis comparing healthy subjects to individuals with CF. B Healthy vs. NCFB: Differential abundance analysis comparing healthy subjects to individuals with NCFB. C CF vs. NCFB: Differential abundance analysis comparing the CF and NCFB cohorts. DESeq2 was employed for the analysis, with significance defined by an adjusted p value below 0.01. The figures represent the top 15 differentially abundant species, with a log2FC of 2 for all the comparisons
Fig. 5
Fig. 5
Pairwise functional differential abundance analysis comparing healthy and CF cohorts. A and B. Differential abundance analysis comparing functional enriched processes in the microbiome in Pfam (A) and KO (B). Green bars represent the CF cohort and blue bars represent the healthy cohort. DESeq2 was employed for the analysis, with significance defined by an adjusted p value below 0.05. The figures represent the top 15 significantly differentially abundant processes
Fig. 6
Fig. 6
Resistome analysis. A Sputum resistome cluster analysis: PCoA of Bray–Curtis distances in the sputum resistome, showing distinct separation of NCFB, CF, and healthy cohorts. B Nasopharyngeal swab resistome cluster analysis: PCoA of Bray–Curtis distances in the nasopharyngeal swab resistome, revealing no significant differences between cohorts. C Sputum antimicrobial resistance gene incidence: The CF cohort exhibits a higher incidence of resistance genes compared to the NCFB and healthy cohorts. D Nasopharyngeal swab antimicrobial resistance gene incidence: The CF cohort has a higher incidence of resistance genes than the healthy cohort. E Sputum antimicrobial resistance mechanism composition: NCFB and CF cohorts display increased antibiotic efflux, while the healthy cohort exhibits a homogeneous composition. F Nasopharyngeal swab antimicrobial resistance mechanism composition: NCFB, CF, and healthy cohorts show a similar distribution of resistance mechanisms. Ellipses denote 95% confidence. Statistical significance was assessed by the Kruskal–Wallis test followed by Dunn’s post hoc test (* P ≤ 0.05 and *** P ≤ 0.001)
Fig. 7
Fig. 7
Impact of NCFB and CF on the respiratory tract microbiome. In the upper respiratory tract, NCFB is associated with an increase in C. propinquum. The CF cohort presents heightened microbiome cohort heterogeneity, decreased Fusobacteria and Bacteroidetes levels, and increased presence of resistance genes. In the lower respiratory tract, both NCFB and CF result in reduced diversity, lower Bacteroidetes phylum levels, an increase in the Pseudomonas genus, and elevated levels of antibiotic efflux mechanisms among resistance genes. The NCFB cohort exhibits an increased prevalence of P. shahii and H. influenzae compared to the CF cohort. The CF cohort is characterized by increased microbiome cohort heterogeneity, a rise in the Burkholderiales order, augmented Staphylococcus genus levels, an elevated Firmicutes/Bacteroidetes ratio, and diminished Fusobacteria and Actinobacteria. CF also manifests increased markers of metabolic activity, heightened levels of virulence-related proteins, and an increased presence of resistance genes

Similar articles

Cited by

References

    1. Aliberti S, Goeminne PC, O’Donnell AE, Aksamit TR, Al-Jahdali H, Barker AF, et al. Criteria and definitions for the radiological and clinical diagnosis of bronchiectasis in adults for use in clinical trials: international consensus recommendations. Lancet Respir Med. 2022;10:298–306. doi: 10.1016/S2213-2600(21)00277-0. - DOI - PubMed
    1. Schäfer J, Griese M, Chandrasekaran R, Chotirmall SH, Hartl D. Pathogenesis, imaging and clinical characteristics of CF and non-CF bronchiectasis. BMC Pulm Med. 2018;18:79. doi: 10.1186/s12890-018-0630-8. - DOI - PMC - PubMed
    1. Pereira MC, Athanazio RA, Dalcin P de TR, Figueiredo MRF de, Gomes M, Freitas CG de, et al. Brazilian consensus on non-cystic fibrosis bronchiectasis. J Bras Pneumol. 2019;45:e20190122. - PMC - PubMed
    1. Flume PA, Chalmers JD, Olivier KN. Advances in bronchiectasis: endotyping, genetics, microbiome, and disease heterogeneity. The Lancet. 2018;392:880–90. doi: 10.1016/S0140-6736(18)31767-7. - DOI - PMC - PubMed
    1. Quint JK, Millett ERC, Joshi M, Navaratnam V, Thomas SL, Hurst JR, et al. Changes in the incidence, prevalence and mortality of bronchiectasis in the UK from 2004 to 2013: a population-based cohort study. Eur Respir J. 2016;47:186–93. doi: 10.1183/13993003.01033-2015. - DOI - PMC - PubMed

Publication types

Grants and funding