

HHLA2 deficiency inhibits pancreatic cancer progression and THP-1 macrophage M2 polarization via EGFR/MAPK/ERK and mTOR/AKT pathway
- PMID: 38762741
- PMCID: PMC11102221
- DOI: 10.1186/s12957-024-03409-2
HHLA2 deficiency inhibits pancreatic cancer progression and THP-1 macrophage M2 polarization via EGFR/MAPK/ERK and mTOR/AKT pathway
Abstract
Background: Human endogenous retrovirus subfamily H long terminal repeat associating protein 2, (HHLA2), a member of B7 family, exhibits heightened expression in various malignant tumors. However, the exact functions of HHLA2 in pancreatic cancer (PC) remain incompletely elucidated.
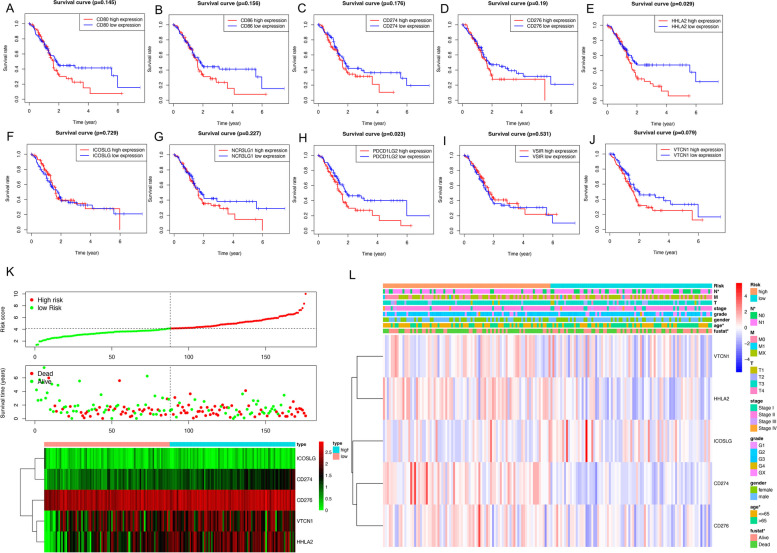
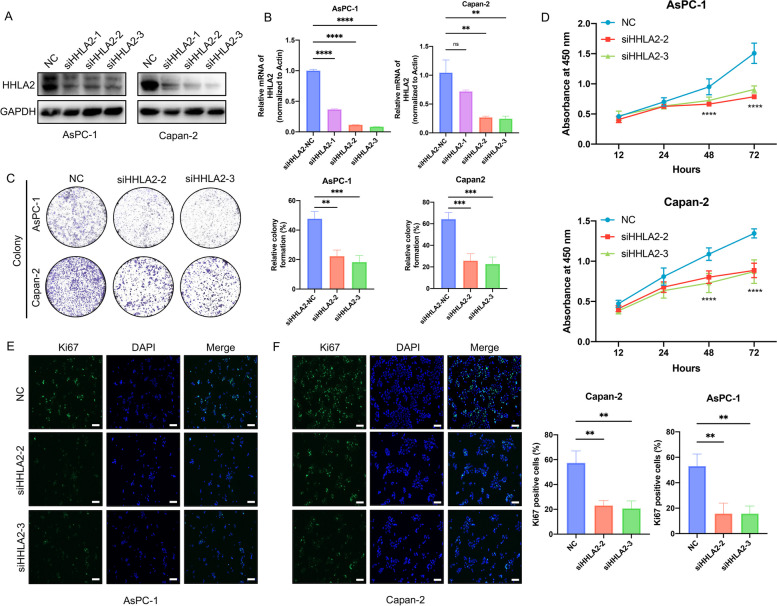
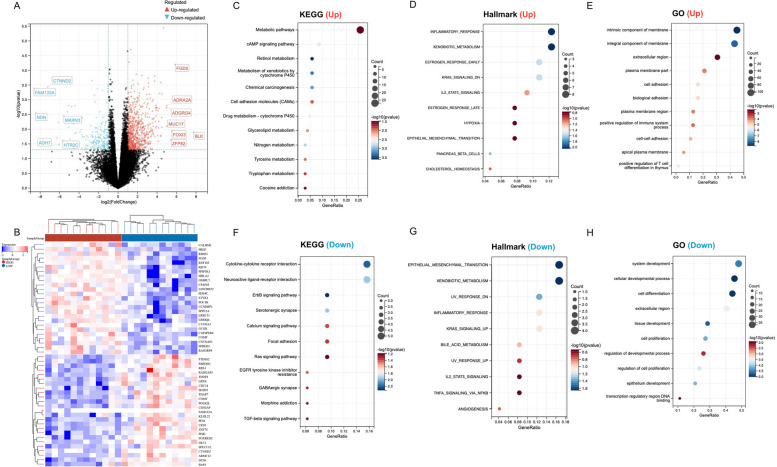
Methods: We initially conducted an analysis of the B7 family members' expression pattern in pancreatic tumor samples and adjacent normal tissues using The Cancer Genome Atlas (TCGA) database. Subsequently, immunohistochemistry, RT-qPCR and western blot methods were used to assess HHLA2 expression levels in PC tissues and cell lines. Furthermore, after silencing HHLA2 in PC cell lines, cell migration and proliferation of PC cells were detected by wound healing and CCK-8 assays, and cell invasion of PC cells was detected by transwell assays. We also investigated the regulation of epithelial-mesenchymal transition (EMT) markers and levels of EGFR, MEK, ERK1/2, mTOR and AKT via western blot analysis. Finally, the correlation between HHLA2 expression and immune infiltration was further explored.
Results: Silencing of HHLA2 resulted in the inhibition of PC cell proliferation, migration and invasion, potentially through the suppression of the EGFR/MAPK/ERK and mTOR/AKT signaling pathway. Additionally, silencing HHLA2 led to the inhibition of M2-type polarization of tumor associated macrophages (TAMs).
Conclusion: The knockdown of HHLA2 was observed to inhibit the migration and invasion of PC cells through the regulation of the EMT process and EGFR/MAPK/ERK and mTOR/AKT pathway. Furthermore, silencing HHLA2 was found to modulate M2 polarization of TAMs. These finding suggest that HHLA2 could be a promising therapeutic target for Pancreatic cancer.
Keywords: HHLA2; Invasion; Migration; Pancreatic cancer; Tumor-associated macrophages.
© 2024. The Author(s).
Conflict of interest statement
The authors declare no competing interests.
Figures


Similar articles
-
HHLA2 deficiency inhibits non-small cell lung cancer progression and THP-1 macrophage M2 polarization.Cancer Med. 2021 Aug;10(15):5256-5269. doi: 10.1002/cam4.4081. Epub 2021 Jun 21. Cancer Med. 2021. PMID: 34152094 Free PMC article.
-
HHLA2 promotes hepatoma cell proliferation, migration, and invasion via SPP1/PI3K/AKT signaling pathway.Mol Carcinog. 2024 Jul;63(7):1275-1287. doi: 10.1002/mc.23723. Epub 2024 Apr 5. Mol Carcinog. 2024. PMID: 38578157
-
Calpain 8 as a potential biomarker regulates the progression of pancreatic cancer via EMT and AKT/ERK pathway.J Proteomics. 2024 Jun 15;301:105182. doi: 10.1016/j.jprot.2024.105182. Epub 2024 Apr 30. J Proteomics. 2024. PMID: 38697284
-
Human endogenous retrovirus-H long terminal repeat-associating 2: an emerging immune checkpoint for cancer immunotherapy.J Leukoc Biol. 2025 Feb 13;117(2):qiae158. doi: 10.1093/jleuko/qiae158. J Leukoc Biol. 2025. PMID: 38973642 Review.
-
The Importance of HHLA2 in Solid Tumors-A Review of the Literature.Cells. 2024 May 7;13(10):794. doi: 10.3390/cells13100794. Cells. 2024. PMID: 38786018 Free PMC article. Review.
Cited by
-
Crosstalk between the tumor immune microenvironment and metabolic reprogramming in pancreatic cancer: new frontiers in immunotherapy.Front Immunol. 2025 Apr 28;16:1564603. doi: 10.3389/fimmu.2025.1564603. eCollection 2025. Front Immunol. 2025. PMID: 40356913 Free PMC article. Review.
References
MeSH terms
Substances
Grants and funding
LinkOut - more resources
Full Text Sources
Medical
Molecular Biology Databases
Research Materials
Miscellaneous
