. 2024 Sep;20(9):2000-2016.
doi: 10.1080/15548627.2024.2353548. Epub 2024 May 18.

ROS-mediated lysosomal membrane permeabilization and autophagy inhibition regulate bleomycin-induced cellular senescence

Affiliations

ROS-mediated lysosomal membrane permeabilization and autophagy inhibition regulate bleomycin-induced cellular senescence

Zhangyang Qi et al. Autophagy. 2024 Sep.

Abstract

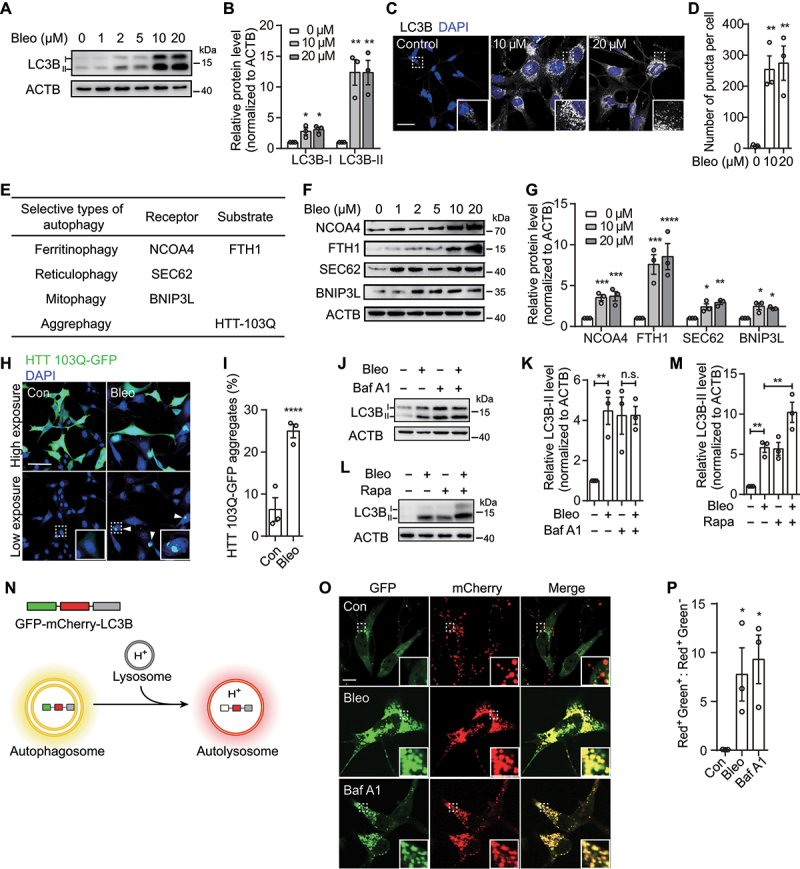
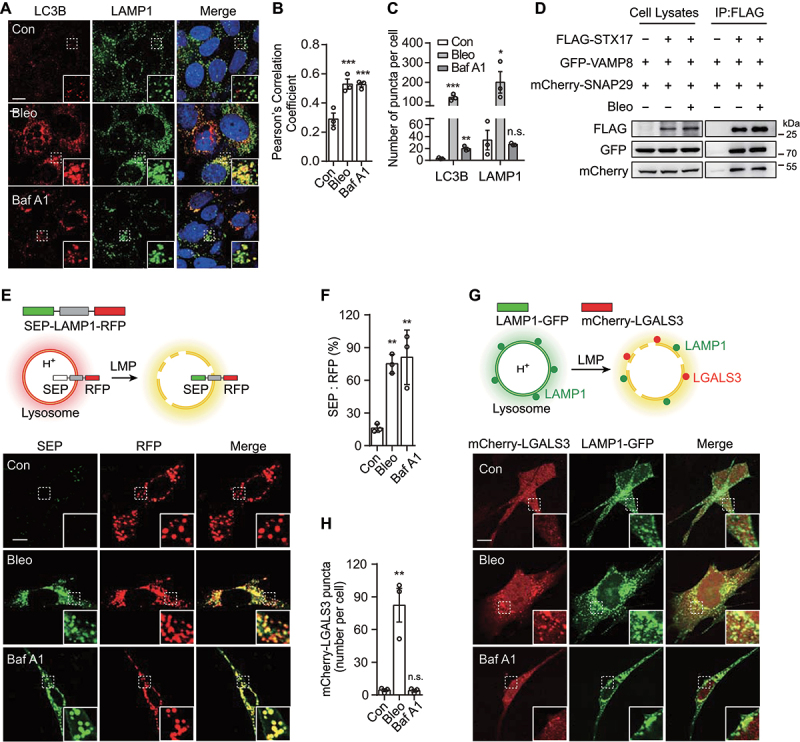
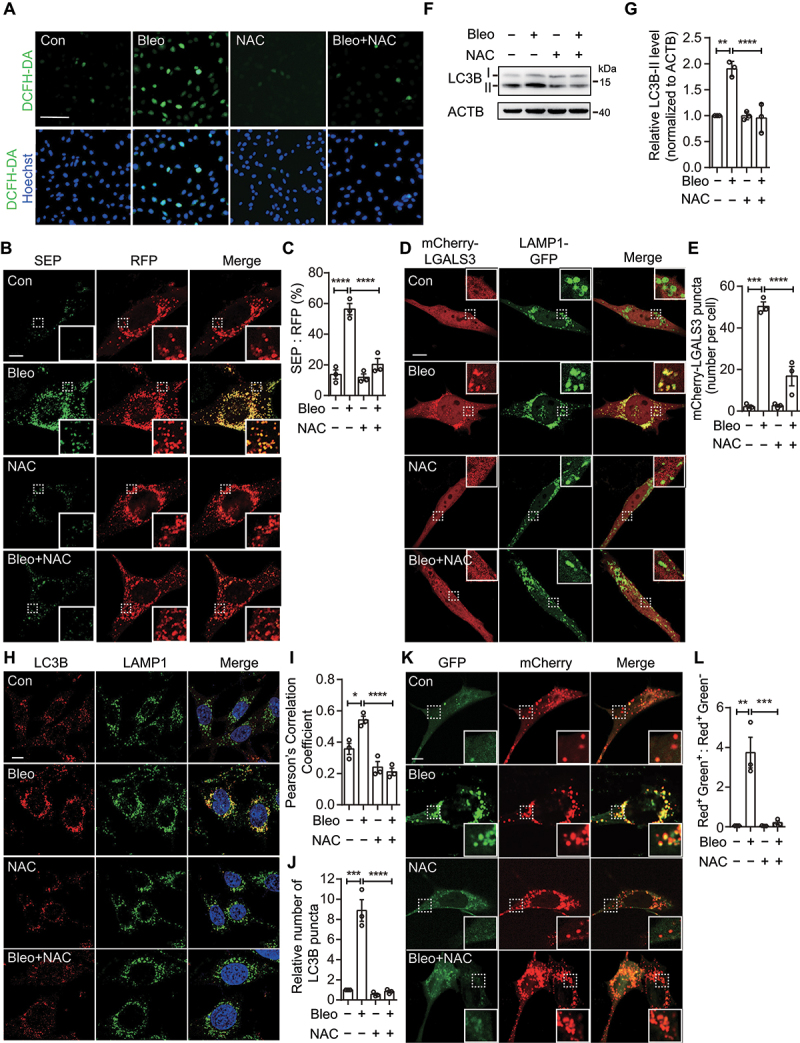
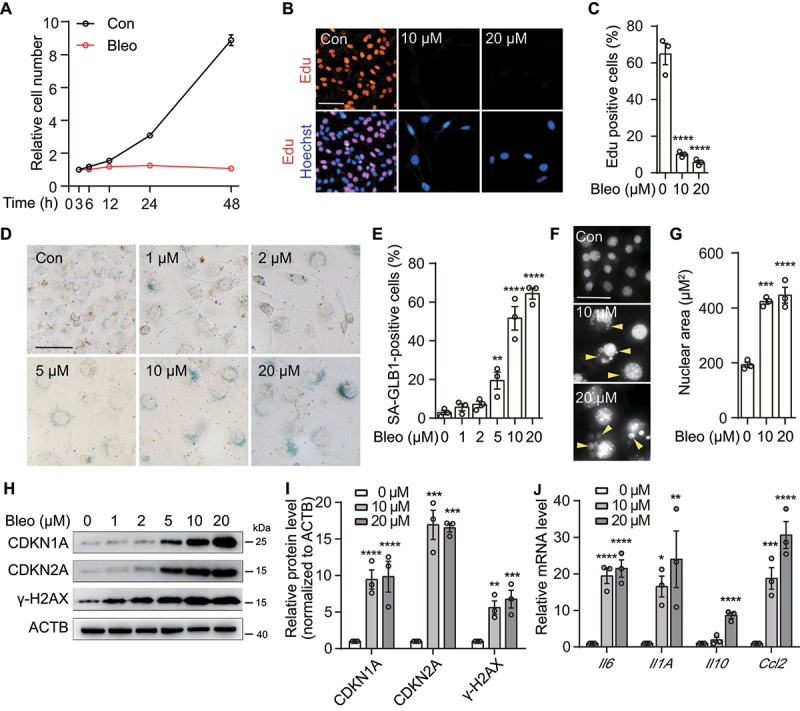
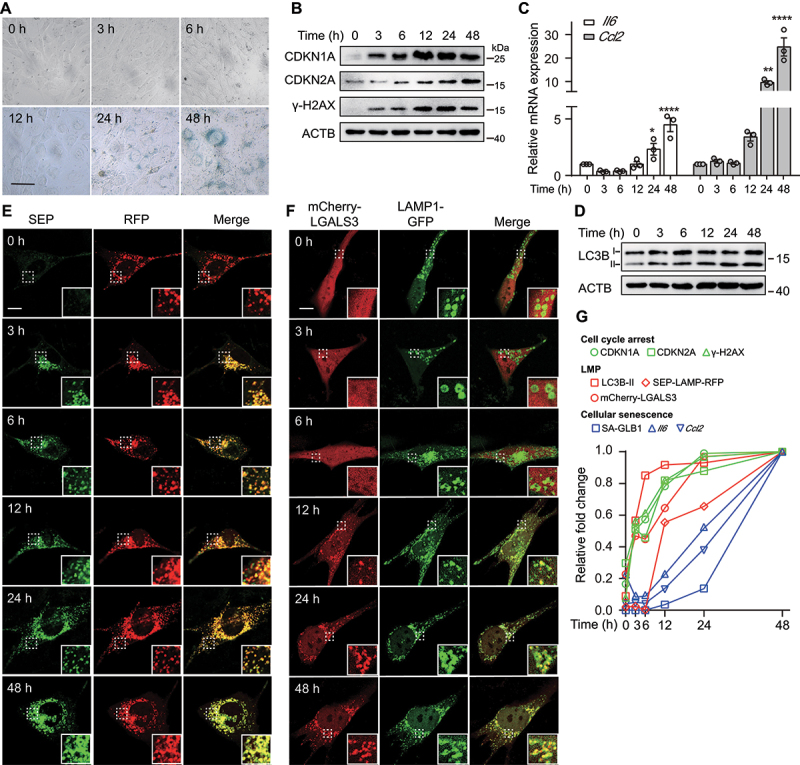
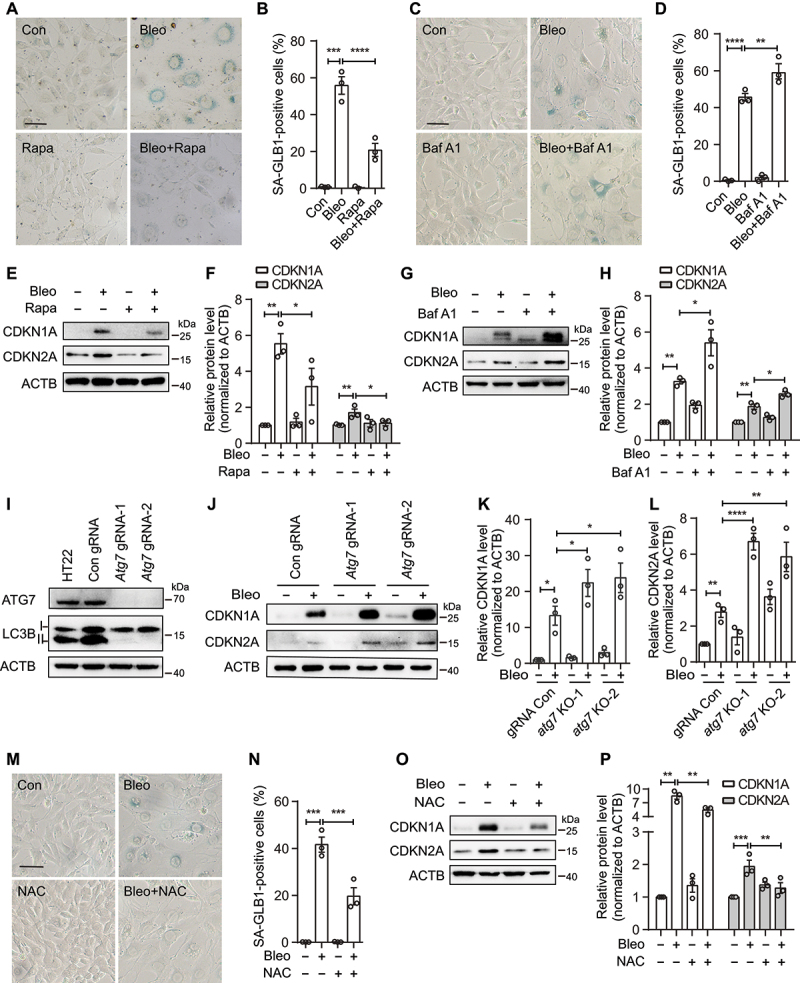
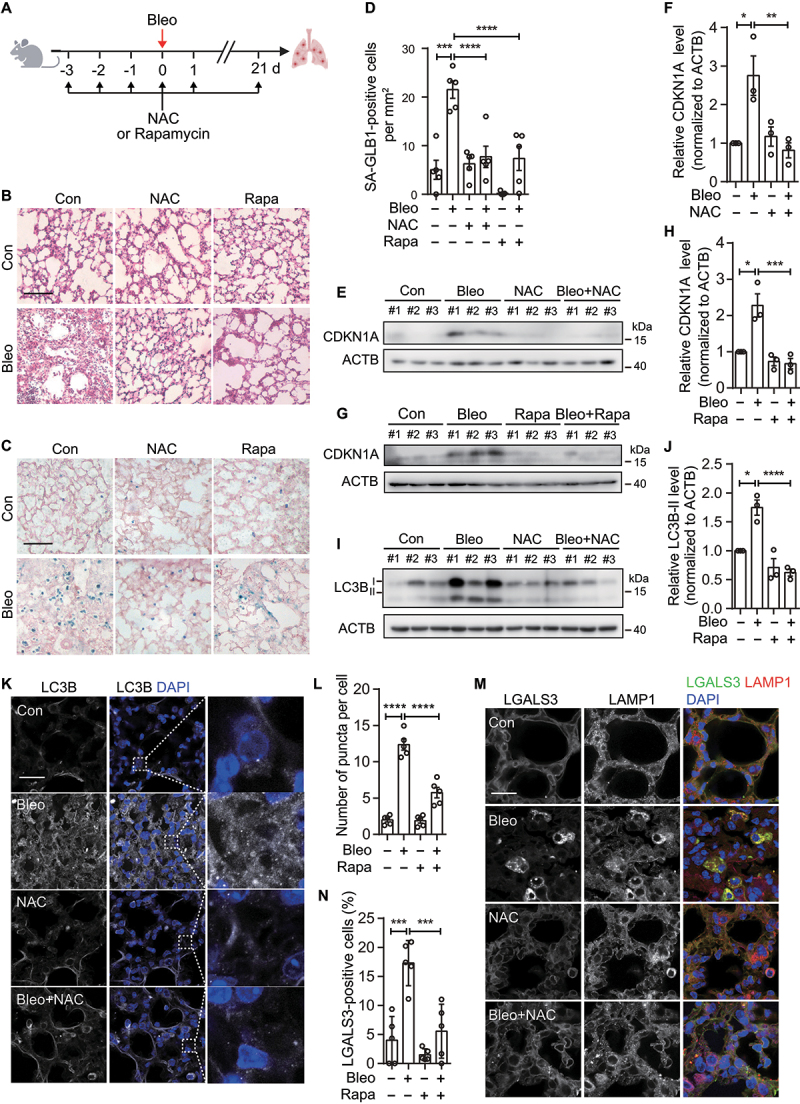
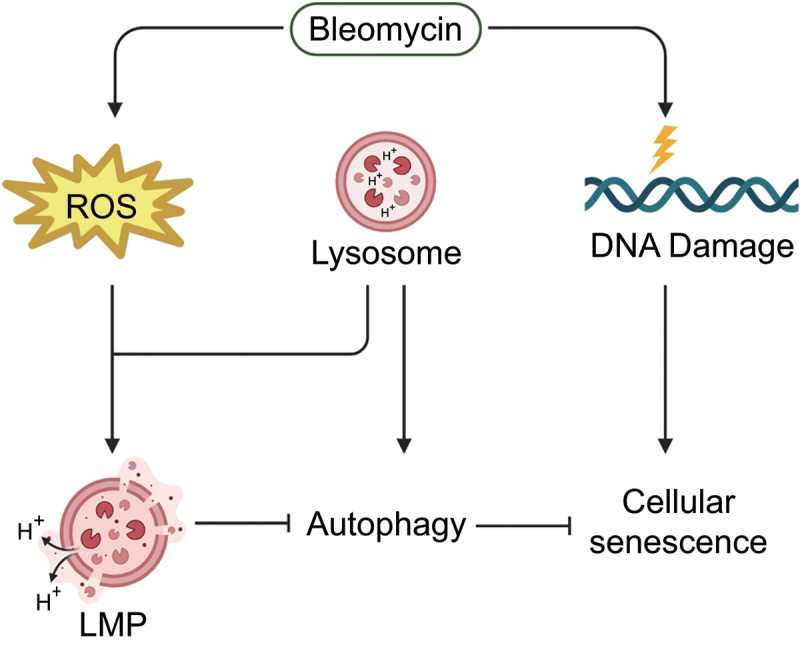
Bleomycin exhibits effective chemotherapeutic activity against multiple types of tumors, and also induces various side effects, such as pulmonary fibrosis and neuronal defects, which limit the clinical application of this drug. Macroautophagy/autophagy has been recently reported to be involved in the functions of bleomycin, and yet the mechanisms of their crosstalk remain insufficiently understood. Here, we demonstrated that reactive oxygen species (ROS) produced during bleomycin activation hampered autophagy flux by inducing lysosomal membrane permeabilization (LMP) and obstructing lysosomal degradation. Exhaustion of ROS with N-acetylcysteine relieved LMP and autophagy defects. Notably, we observed that LMP and autophagy blockage preceded the emergence of cellular senescence during bleomycin treatment. In addition, promoting or inhibiting autophagy-lysosome degradation alleviated or exacerbated the phenotypes of senescence, respectively. This suggests the alternation of autophagy activity is more a regulatory mechanism than a consequence of bleomycin-induced cellular senescence. Taken together, we reveal a specific role of bleomycin-induced ROS in mediating defects of autophagic degradation and further regulating cellular senescence in vitro and in vivo. Our findings, conversely, indicate the autophagy-lysosome degradation pathway as a target for modulating the functions of bleomycin. These provide a new perspective for optimizing bleomycin as a clinically applicable chemotherapeutics devoid of severe side-effects.Abbreviations: AT2 cells: type II alveolar epithelial cells; ATG7: autophagy related 7; bEnd.3: mouse brain microvascular endothelial cells; BNIP3L: BCL2/adenovirus E1B interacting protein 3-like; CCL2: C-C motif chemokine ligand 2; CDKN1A: cyclin dependent kinase inhibitor 1A; CDKN2A: cyclin dependent kinase inhibitor 2A; FTH1: ferritin heavy polypeptide 1; γ-H2AX: phosphorylated H2A.X variant histone; GAPDH: glyceraldehyde-3-phosphate dehydrogenase; HUVEC: human umbilical vein endothelial cells; HT22: hippocampal neuronal cell lines; Il: interleukin; LAMP: lysosomal-associated membrane protein; LMP: lysosome membrane permeabilization; MTORC1: mechanistic target of rapamycin kinase complex 1; NAC: N-acetylcysteine; NCOA4: nuclear receptor coactivator 4; PI3K: phosphoinositide 3-kinase; ROS: reactive oxygen species; RPS6KB/S6K: ribosomal protein S6 kinase; SA-GLB1/β-gal: senescence-associated galactosidase, beta 1; SAHF: senescence-associated heterochromatic foci; SASP: senescence-associated secretory phenotype; SEC62: SEC62 homolog, preprotein translocation; SEP: superecliptic pHluorin; SQSTM1/p62: sequestosome 1; TFEB: transcription factor EB.

Keywords: Autophagy; ROS; bleomycin; cellular senescence; lysosomal membrane permeabilization.


Conflict of interest statement

No potential conflict of interest was reported by the author(s).

Figures

Figure 1.
Figure 1.
Bleomycin induces autophagy inhibition. (A) HT22 cells were incubated with bleomycin (bleo) at indicated concentrations for 48 h and subjected to immunoblotting. (B) quantification of LC3B-I and LC3B-II levels (normalized to ACTB) from experiments as in A. The ratio of LC3B:ACTB for control was arbitrarily set at 1. Bars represent the mean ± SEM from 3 independent experiments. (C) confocal microscopy of bleomycin-treated HT22 cells immunostained for endogenous LC3B. Nuclei were stained with DAPI. Scale bar: 30 μm. (D) quantification of the number of LC3B puncta per cell from experiments in C. Bars represent the mean ± SEM of the number in 100 cells from 3 independent experiments. (E) a list of receptors and substrates of types of selective autophagy examined in this study. (F) HT22 cells were treated with bleomycin for 48 h at indicated concentrations, and then analyzed by immunoblotting. (G) quantification of NCOA4, FTH1, SEC62 and BNIP3L levels (normalized to ACTB) from experiments as in F. The ratio of the indicated protein to ACTB for control was arbitrarily set at 1. Bars represent the mean ± SEM from 3 independent experiments. (H) confocal images of HT22 cells transfected with a plasmid encoding HTT 103Q-EGFP and incubated with 10 μM bleomycin for 48 h. HTT103Q-EGFP aggregates were marked with arrowheads. Nuclei were stained with DAPI. Scale bar: 50 μm. (I) bars represent the mean ± SEM of the percentage of cells with EGFP-positive aggregates. Over 100 GFP-positive cells from 3 independent experiments as shown in H were analyzed. (J) immunoblotting of HT22 cells treated with 10 μM bleomycin and/or 5 nM bafilomycin A1 (baf A1) for 48 h. (K) quantification of LC3B-II levels (normalized to ACTB) from experiments as in J. The ratio of LC3B-II:ACTB for control was arbitrarily set at 1. Bars represent the mean ± SEM from 3 independent experiments. (L) immunoblotting of HT22 cells treated with 10 μM bleomycin and/or 200 nM rapamycin (Rapa) for 48 h. (M) quantification of LC3B-II levels (normalized to ACTB) from experiments as in L. The ratio of LC3B-II:ACTB for control was arbitrarily set at 1. Bars represent the mean ± SEM from 3 independent experiments. (N) left: schematic representation of the mechanism of GFP-mCherry-LC3B as a probe for autophagy flux. Autophagosomes exhibit both GFP and mCherry fluorescence, while autolysosomes only show mCherry fluorescence, since GFP fluorescence is quenched in acidic environment. (O) HT22 cells were transiently transfected with a plasmid encoding tandem GFP-mCherry-LC3B, and incubated with 10 μM bleomycin or 5 nM bafilomycin A1 for 48 h. GFP and mCherry were visualized by confocal microscopy of live cells. Scale bar: 10 μm. (P) the ratio of the number of green-red-positive puncta to red-positive puncta in each cell was determined. Bars represent the mean ± SEM of the ratio in 50 cells from 3 independent experiments. In B, D, G and P, *p < 0.05, **p < 0.01, ***p < 0.001, ****p < 0.0001, one-way ANOVA with Dunnett’s multiple comparisons test. In I, ***p < 0.0001, the unpaired Student’s t test. In K and M, *p < 0.05, **p < 0.01, two-way ANOVA with Tukey’s multiple comparisons test.
Figure 2.
Figure 2.
Bleomycin induces lysosomal membrane permeabilization. (A) confocal microscopy of HT22 cells treated with 10 μM bleomycin or 5 nM bafilomycin A1 for 48 h, and then immunostained with antibodies to LC3B and LAMP1. Nuclei were stained with DAPI. Scale bar: 30 μm. (B) colocalization between LC3B versus LAMP1 was shown as Pearson’s correlation coefficient. Bars represent the mean ± SEM of over 80 cells from 3 independent experiments such as those shown in A. (C) quantification of the number of LC3B and LAMP1 puncta per cell from experiment in A. Bars represent the mean ± SEM. (D) HT22 cells transfected with plasmids encoding FLAG-STX17, GFP-VAMP8 and mCherry-SNAP29 were incubated with 20 μM bleomycin for 4 h in prior to immunoprecipitation with antibody against FLAG epitope. The cell lysates and precipitates were analyzed by immunoblotting with indicated antibodies. (E) top: schematic representation of monitoring lysosomal acidification with SEP-LAMP1-RFP. Bottom: HT22 cells were transfected with the plasmid coding SEP-LAMP-RFP and incubated with 10 μM bleomycin or 5 nM bafilomycin A1 for 48 h. SEP and RFP fluorescence were visualized by confocal microscopy of live cells. Scale bar: 10 μm. (F) the ratio of the number of SEP:RFP puncta in each cell was determined. Bars represent the mean ± SEM of the ratio in 80 cells from 3 independent experiments as in E. (G) top: schematic representation of monitoring lysosomal membrane damage with mCherry-LGALS3. Bottom: confocal microscopy of HT22 cells transfected with plasmids coding mCherry-LGALS3 and LAMP1-GFP, and then treated with bleomycin or bafilomycin A1 as in E. Scale bar: 10 μm. (H) the number of RFP-positive puncta in each cell were determined. Bars represent the mean ± SEM of the ratio in 80 cells from 3 independent experiments as in G. in B, C, F and H, *p < 0.05, **p < 0.01, ***p < 0.001, ****p < 0.0001, one-way ANOVA with Dunnett’s multiple comparisons test. n.S., no significant difference.
Figure 3.
Figure 3.
ROS mediates bleomycin-induced lysosomal damage and autophagy defects. (A) fluorescence microscopy images of HT22 cells treated with 10 μM bleomycin and/or 1 mM NAC for 12 h, and then loaded with 10 μM DCFH-DA for 30 min. Nuclei were stained with Hoechst. Scale bar: 50 μm. (B) confocal images of live HT22 cells expressing SEP-LAMP1-RFP. Cells were treated with bleomycin and/or NAC as in a before imaging. Scale bar: 10 μm. (C) quantification of the ratio of the number of SEP:RFP puncta. Bars represent the mean ± SEM of the ratio in 30 cells from 3 independent experiments as in B. (D) HT22 cells expressing mCherry-LGALS3 and LAMP1-GFP were treated with 10 μM bleomycin and/or 1 mM NAC for 48 h, and examined by confocal microscopy. Scale bar: 10 μm. (E) quantification of the number of LGALS3 puncta per cell determined from cells as shown in D. Bars represent the mean ± SEM of the ratio in 30 cells from 3 independent experiments. (F) HT22 cells were incubated with 10 μM bleomycin and/or 1 mM NAC for 12 h and subjected to immunoblotting for LC3B. (G) quantification of LC3B-II levels (normalized to ACTB) from experiments as in F. The LC3B-II:ACTB ratio for control was arbitrarily set at 1. Bars represent the mean ± SEM from 3 independent experiments. (H) confocal images of HT22 cells incubated with 10 μM bleomycin and/or 1 mM NAC for 12 h, and then immunostained for LC3B and LAMP1. Nuclei were stained with DAPI. Scale bar: 10 μm. (I) Co-localization between LC3B versus LAMP1 was shown as Pearson’s correlation coefficient. Bars represent the mean ± SEM of 100 cells from 3 independent experiments such as those shown in H. (J) quantification of the number of LC3B puncta per cell from experiment in H. The number of LC3B puncta for control was arbitrarily set at 1. Bars represent the mean ± SEM of the relative number. (K) HT22 cells expressing GFP-mCherry-LC3B were treated with 10 μM bleomycin and/or 1 mM NAC for 12 h, and visualized by live-cell confocal microscopy. Scale bar: 10 μm. (L) the ratio of the number of green-red-positive puncta:red-positive puncta in each cell as in K was determined. Bars represent the mean ± SEM of the ratio in 80 cells from 3 independent experiments. In C, E, G, I, J and L, *p < 0.05, **p < 0.01, ***p < 0.001, ****p < 0.0001, two-way ANOVA with Tukey’s multiple comparisons test.
Figure 4.
Figure 4.
Bleomycin induces cellular senescence in HT22 cells. (A) one hundred thousand HT22 cells were plated in 6-well plate. After 24 h, cells were supplied with 10 μM bleomycin. The number of cells in each well was measured at indicated time point after bleomycin treatment. The number for control at time zero was arbitrarily set at 1. (B) HT22 cells incubated with 10 μM or 20 μM bleomycin for 48 h, and the subjected to EdU incorporation assay. Nuclei were stained with Hoechst. Scale bar: 50 μm. (C) bars represent the mean ± SEM of the percentage of EdU-positive cells in 100 cells in each treatment from 3 independent experiments. (D) HT22 cells were incubated with indicated concentration of bleomycin for 48 h and subjected to SA-GLB1/β-gal staining assay. Scale bars: 20 μm. (E) bars represent the mean ± SEM of the percentage of positively stained cells in 100 cells in each condition from 3 independent experiments. (F) HT22 cells were incubated with 10 μM or 20 μM bleomycin for 48 h and the nuclei were visualized by DAPI staining. SAHFs were indicated by arrowheads. Scale bars: 20 μm. (G) quantification of the area of nucleus in each cell. Bars represent the mean ± SEM of the area in 100 cells from 3 independent experiments. (H) HT22 cells were incubated with indicated concentrations of bleomycin for 48 h and analyzed by immunoblotting with antibodies against CDKN1A, CDKN2A and γ-H2AX. (I) quantification of protein levels (normalized to ACTB) from experiments as in F. The level of each protein for control was arbitrarily set at 1. Bars represent the mean ± SEM from 3 independent experiments. (J) the relative mRNA level of Il6, Il1A, Il10, and Ccl2 in bleomycin-treated HT22 cells were measured by quantitative real-time PCR (qRT-PCR). The level of each gene for control was arbitrarily set at 1. Bars represent the mean ± SEM from 3 independent experiments. In C, E, G, I and J, *p < 0.05, **p < 0.01, ***p < 0.001, ****p < 0.0001, one-way ANOVA with Tukey’s multiple comparisons test.
Figure 5.
Figure 5.
Bleomycin-induced LMP and autophagy defects precede cellular senescence. HT22 cells were incubated with 10 μM bleomycin for indicated periods, and then analyzed for biomarkers for LMP, cell cycle arrest and senescence. (A) SA-GLB1 activities in bleomycin-treated cells were measured. (B) relative mRNA levels of Il6 and Ccl2 were analyzed by qRT-PCR. The level of each gene for control was arbitrarily set at 1. Bars represent the mean ± SEM from 3 independent experiments. *p < 0.05, **p < 0.01, ****p < 0.0001, one-way ANOVA with Tukey’s multiple comparisons test. (C) cells were analyzed by immunoblotting with anti-CDKN1A, anti-CDKN2A and anti-γ-H2AX antibodies. (D) Live-cell imaging of HT22 cells transfected with the plasmid coding SEP-LAMP1-RFP. Scale bar: 10 μm. (E) confocal microscopy images of HT22 cells transfected with plasmids coding mCherry-LGALS3 and LAMP1-GFP. Scale bar: 10 μm. (F) the levels of LC3B were analyzed by immunoblotting assay. (G) relative fold change of indicated biomarkers for cell cycle arrest, autophagy, LMP and cellular senescence in bleomycin-treated HT22 cells. Data were mean values from A, B, F and figure S6. Values for 48-hour bleomycin-treatment of each marker were arbitrarily set at 1.0.
Figure 6.
Figure 6.
Manipulation of autophagy-lysosome pathway regulates bleomycin-induced senescence. (A and C) HT22 cells with incubated with 10 μM bleomycin, 5 nM bafilomycin A1 or 200 nM rapamycin for 48 h, and then subjected to SA-l activity assay. (B and D) the percentage of SA‐GLB1-positive cells were measured. Bars represent the mean ± SEM of the percentage of positively stained cells in 300 cells in each condition from 3 independent experiments. (E and G) HT22 cells were treated with bleomycin, rapamycin or bafilomycin A1 as in a and C, and analyzed for the level of CDKN1A and CDKN2A by immunoblotting. (F and H) the relative expression levels of CDKN1A and CDKN2A were quantified. The CDKN1A or CDKN2A to ACTB ratio for control was arbitrarily set at 1. Bars represent the mean ± SEM from 3 independent experiments. (I) CRISPR-Cas9 KO of Atg7 in HT22 cells. The KO efficiency was confirmed by immunoblotting for ATG7 and LC3B-II. (J, K and L) control and atg7-KO HT22 cells were incubated with 10 μM bleomycin for 48 h, and analyzed by immunoblotting with anti-CDKN1A and anti-CDKN2A antibodies (J). The relative expression levels of CDKN1A (K) and CDKN2A (L) were quantified. The CDKN1A or CDKN2A to ACTB ratio for control was arbitrarily set at 1. Bars represent the mean ± SEM from 3 independent experiments. (M) HT22 cells were incubated with 10 μM bleomycin and/or 1 mM NAC for 48 h, in prior to SA‐GLB1 activity assay. Scale bar: 30 μm. (N) the percentage of SA‐GLB1-positive cells were quantified. Bars represent the mean ± SEM of the percentage of positively stained cells in 300 cells in each condition from 3 independent experiments. (O) HT22 cells were treated as in M, and immunoblotted for CDKN1A and CDKN2A. (P) quantification of relative protein levels (normalized to ACTB) from experiments as in O. The level of CDKN1A or CDKN2A for control was arbitrarily set at 1. Bars represent the mean ± SEM from 3 independent experiments. In B, D, F, H, K, L, N and P, *p < 0.05, **p < 0.01, ***p < 0.001, ****p < 0.0001, two-way ANOVA with Tukey’s multiple comparisons test.
Figure 7.
Figure 7.
NAC and rapamycin alleviated bleomycin-induced cellular senescence, autophagy defects and LMP in mice pulmonary fibrosis model. (A) schematic representation of the administration strategy of bleomycin, NAC and rapamycin. (B) Representative images of hematoxylin and eosin (H&E) staining of lung tissue sections. Scale bars: 50 μm. (C) Representative images of SA‐GLB1 and eosin staining of lung tissue sections. Scale bars: 50 μm. (D) quantification of the numbers of SA‐GLB1-positive cells per mm2 from images as shown in C. Bars represent the mean ± SEM from 5 mice. (E and G) lung tissues from mice treated as indicated were homogenized and immunoblotted with indicated antibodies. (F and H) quantification of relative CDKN1A levels (normalized to ACTB) from experiments as in E and G. The level of CDKN1A for control was arbitrarily set at 1. Bars represent the mean ± SEM from 3 mice. (I) homogenates of lung tissues were immunoblotted with indicated antibodies. (J) quantification of LC3B-II levels (normalized to ACTB) from experiments as in I. The level of LC3B-II for control was arbitrarily set at 1. Bars represent the mean ± SEM from 3 mice. (K) confocal microscopy images of lung sections immunostained with anti-LC3B antibodies. Scale bar: 10 μm. (L) quantification of the number of LC3B puncta per cell from experiment in K. Bars represent the mean ± SEM from 5 mice. (M) confocal microscopy images of lung sections immunostained with anti-LGALS3 and anti-LAMP1 antibodies. Scale bar: 10 μm. (N) the percentage of cells showing LGALS3 puncta were quantified. Bars represent the mean ± SEM from 5 mice. In D, F, H, J, L and N, *p < 0.05, **p < 0.01, ***p < 0.001, ****p < 0.0001, two-way ANOVA with Tukey’s multiple comparisons test.
Figure 8.
Figure 8.
Schematic diagram showing bleomycin-induced LMP and autophagy defects aggravate cellular senescence. Bleomycin induced genomic DNA breaks and ROS production, while the former one is a well-defined stimulus for cellular senescence. Our findings indicated ROS causes the LMP and consequent defective autophagic degradation, which exacerbate the cellular senescence induced by bleomycin.

Similar articles

Cited by

References

    1. Watson RA, De La Peña H, Tsakok MT, et al. Development of a best-practice clinical guideline for the use of bleomycin in the treatment of germ cell tumours in the UK. Br J Cancer. 2018;119(9):1044–1051. doi: 10.1038/s41416-018-0300-x - DOI - PMC - PubMed
    1. Della Latta V, Cecchettini A, Del Ry S, et al. Bleomycin in the setting of lung fibrosis induction: from biological mechanisms to counteractions. Pharmacological Research. 2015. Jul;97:122–130. doi: 10.1016/j.phrs.2015.04.012 - DOI - PubMed
    1. Sleijfer S. Bleomycin-induced pneumonitis. Chest. 2001. Aug;120(2):617–624. doi: 10.1378/chest.120.2.617 - DOI - PubMed
    1. Cheng T, Liu Q, Zhang R, et al. Lysyl oxidase promotes bleomycin-induced lung fibrosis through modulating inflammation. J Mol Cell Biol. 2014. Dec;6(6):506–515. doi: 10.1093/jmcb/mju039 - DOI - PubMed
    1. Sawada H, Ibi M, Kihara T, et al. Mechanisms of antiapoptotic effects of estrogens in nigral dopaminergic neurons. Faseb J. 2000;14(9):1202–1214. doi: 10.1096/fasebj.14.9.1202 - DOI - PubMed

Publication types