. 2024 Oct 1;196(2):830-841.
doi: 10.1093/plphys/kiae291.

A genetically encoded fluorescent heme sensor detects free heme in plants

Affiliations

A genetically encoded fluorescent heme sensor detects free heme in plants

Bingxiao Wen et al. Plant Physiol. .

Abstract

Heme is produced in plants via a plastid-localized metabolic pathway and is subsequently distributed to all cellular compartments. In addition to covalently and noncovalently bound heme, a comparatively small amount of free heme that is not associated with protein is available for incorporation into heme-dependent proteins in all subcellular compartments and for regulatory purposes. This "labile" fraction may also be toxic. To date, the distribution of the free heme pool in plant cells remains poorly understood. Several fluorescence-based methods for the quantification of intracellular free heme have been described. For this study, we used the previously described genetically encoded heme sensor 1 (HS1) to measure the relative amounts of heme in different plant subcellular compartments. In a proof of concept, we manipulated heme content using a range of biochemical and genetic approaches and verified the utility of HS1 in different cellular compartments of Arabidopsis (Arabidopsis thaliana) and tobacco (Nicotiana tabacum and Nicotiana benthamiana) plants transformed either transiently or stably with HS1 and HS1(M7A), a variant with lower affinity for heme. This approach makes it possible to trace the distribution and dynamics of free heme and provides relevant information about its mobilization. The application of these heme sensors will create opportunities to explore and validate the importance of free heme in plant cells and to identify mutants that alter the subcellular allocation of free heme.


Conflict of interest statement

Conflict of interest statement. None declared.

Figures
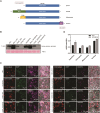
Figure 1.
Figure 1.
Quantification of the relative amounts of the 2 heme sensors, both of which incorporate the fluorescent proteins EGFP and mKATE2 as reporter and internal standard, respectively. The 2 heme sensor variants HS1 and HS1(M7A), which differ in their respective affinities for heme, were transiently expressed in different subcellular compartments of N. benthamiana. A) The coding sequences of the 2 heme sensors themselves facilitate their expression in the cytoplasm. Sequences coding for the transit peptides of RbcS and COX4 were added to the sensors to enable them to be targeted to plastids and mitochondria, respectively, and transportation into the nucleus was assured via the nuclear localization signals of SV40. The exact length of the coding sequences for the heme sensor and the respective transit peptides and the signal sequence is given in base pairs. B) Immunoblot analysis of the 2 heme sensor variants, which were targeted to different cellular compartments. Samples of protein extracts from transiently transformed N. benthamiana leaves were analyzed by using the anti-GFP antibody, and the Coomassie-stained large subunit of RbcL served as a loading standard. C) The fluorescent signals emitted by HS1 (the more sensitive heme sensor) and HS1(M7A) (which has a lower affinity for free heme) in different subcellular compartments in transiently transformed N. benthamiana leaves. Apart from chlorophyll fluorescence, the images show representative EGFP and mKATE2 signals and their merger recorded by the HS1 variants in the 4 cellular compartments. For transient transformation, 6-wk-old plants were used, and the leaves used for transfection were all of the same age. D) The ratio of EGFP to mKATE2 fluorescence (EGFP/mKATE2) recorded by HS1(M7A) and HS1 is shown for the different cellular compartments. The EGFP/mKATE2 ratios obtained from the EGFP and mKATE2 channels were calculated from 5 to 8 transformed representative cells of different transformants. Note that the ratio is inversely proportional to the level of free heme (see main text). Statistical significance compared with fluorescence in the cytoplasm is indicated by Tukey's HSD method (*P < 0.05, **P < 0.01), and error bars represent the sd of 3 biological replicates.
Figure 2.
Figure 2.
EGFP/mKATE2 fluorescence ratios recorded by the 2 heme sensors HS1 and HS1(M7A) in different cellular compartments of transiently transformed N. benthamiana leaves following supplementation with exogenous ALA. N. benthamiana leaves were transiently transfected with genes encoding HS1/HS1(M7A) variants targeted to different subcellular compartments (chloroplasts, mitochondria, nuclei, and cytoplasm) and infiltrated with different concentrations of ALA solution (0, 0.5, 1, and 2 mm). A) The ratio of EGFP to mKATE2 fluorescence emitted by the 2 heme sensor variants was determined after treatment with different concentrations of ALA. The ratio of the EGFP to mKATE2 fluorescence is calculated based on the sum of pixels in the EGFP and mKATE2 channels. Images show the fluorescent signal of chloroplasts, the fluorescent signals from the HS1 variants (EGFP domain and mKATE2 domain) in different cellular compartments (cytoplasm, chloroplast, mitochondria, nucleus), and the merged fluorescence signals of EGFP and mKATE2. For transient transformation, 6-wk-old leaves are used. Leaves of the same age were transfected and processed after 48 h of ALA treatment. The EGFP/mKATE2 ratios obtained from the EGFP and mKATE2 channels were calculated from 5 to 8 transformed representative cells of different transformants. Statistical significance of different cellular compartments compared with the fluorescence ratio in the control group (mock solution) is indicated by Tukey's HSD method (*P < 0.05; **P < 0.01), and error bars represent the sd of 3 biological replicates. B) Total heme content of leaf material. For HPLC analyses, leaves from 6-wk-old plants were used. Statistical significance compared with the control (mock solution) is indicated by Student's t-test (P < 0.05), and error bars represent the sd of 3 biological replicates.
Figure 3.
Figure 3.
Fluorescent signals and their EGFP/mKATE2 ratios recorded by the 2 heme sensor variants HS1 and HS1(M7A) in different cellular compartments of transiently transformed N. benthamiana after incubation of leaves with gabaculine. Transiently transformed tobacco leaves were exposed to different concentrations (0, 125, 250, and 500 µm) of gabaculine in a phosphate-buffered saline (PBS) buffer for 24 h. A) EGFP and mKATE2 fluorescence ratios recorded by HS1(M7A) and HS1 in the different cellular compartments of N. benthamiana leaves that had been treated with different concentrations of gabaculine. The fluorescence ratio of EGFP/mKATE2 is calculated from the sums of pixels in the EGFP and mKATE2 channels. Statistical significance of different cellular compartments compared with the fluorescence ratio in the control group (PBS solution) is indicated by Tukey's HSD method (P < 0.05), and error bars represent the sd of 3 biological replicates. B) Statistical significance compared with the control (PBS solution) is indicated by Student's t-test (P < 0.05), and error bars represent the sd of 3 biological replicates.
Figure 4.
Figure 4.
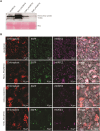
Quantification of free heme by the heme sensor HS1(M7A) in subcellular compartments of stably transformed A. thaliana. Transformants of Arabidopsis plants stably expressing HS1(M7A) in subcellular compartments are used here as an example. The heme sensor sequences were ligated with 2 transit peptides, RbcS and COX4, for transport from the cytoplasm to the chloroplasts and mitochondria and with a nuclear localization signal SV40, which mediates the transport of proteins from the cytoplasm to the nucleus. A) Immunoblotting of the heme sensor protein in different cellular compartments of stably transformed A. thaliana lines. The EGFP antibody was used. B) The fluorescence signal of HS1(M7A) in different cellular compartments. The images show the fluorescence signal of the chlorophyll in the chloroplasts; the heme sensor expressed in the cytoplasm, chloroplasts, mitochondria, and nucleus (fluorescence of the EGFP domain and mKATE2 domain, respectively); and the merging of the abovementioned fluorescences.
Figure 5.
Figure 5.
Quantification of free heme by the heme sensor HS1 in subcellular compartments of stably transformed N. tabacum. The heme sensor coding sequences were ligated with the coding sequences of the transit peptides of RbcS and COX4 and the nuclear localization signal SV40. These transgenes were introduced into the tobacco genome. The fluorescence ratios of EGFP and mKATE2 of HS1 are shown as examples for selected transgenic lines. A) Immunoblotting of the heme sensor protein in different cellular compartments of stably transformed N. tabacum lines. B) The fluorescence signal of HS1 in different cellular compartments. The images show the fluorescence signal of the chlorophyll in the chloroplasts; the heme sensor expressed in the cytoplasm, chloroplasts, mitochondria, and nucleus (fluorescence of the EGFP domain and mKATE2 domain, respectively); and the merging of the abovementioned fluorescences.
Figure 6.
Figure 6.
GFP/mKATE2 fluorescence ratio recorded after transient expression of the heme sensor HS1 in wild-type N. tabacum and AtFC1-overexpressing plants. The EGFP/mKATE2 fluorescence ratios reported by HS1 for the various subcellular compartments of wild-type N. tabacum (SNN) leaves and the AtFC1-overexpressing (FC1 OE) line are shown in the graph. The ratio is derived from the sum of the numbers of pixels of EGFP and mKATE2 fluorescence. Note that the ratio is inversely proportional to the level of free heme present. Statistical significance of different cellular compartments compared with the fluorescence ratio in the WT plants (SNN) is indicated by Tukey's HSD method (P < 0.05), and error bars represent the sd of 3 biological replicates.

Similar articles

Cited by

References

    1. Abshire JR, Rowlands CJ, Ganesan SM, So PT, Niles JC. Quantification of labile heme in live malaria parasites using a genetically encoded biosensor. Proc Natl Acad Sci U S A. 2017:114(11):E2068–E2076. 10.1073/pnas.1615195114 - DOI - PMC - PubMed
    1. Bairwa G, Sánchez-León E, Do E, Jung WH, Kronstad JW. A cytoplasmic heme sensor illuminates the impacts of mitochondrial and vacuolar functions and oxidative stress on heme-iron homeostasis in Cryptococcus neoformans. mBio 2020:11(4):e00986–e00920. 10.1128/mBio.00986-20 - DOI - PMC - PubMed
    1. Briand VA, Thilakarathne V, Kasi RM, Kumar CV. Novel surface plasmon resonance sensor for the detection of heme at biological levels via highly selective recognition by apo-hemoglobin. Talanta 2012:99:113–118. 10.1016/j.talanta.2012.05.026 - DOI - PubMed
    1. Donegan RK, Moore CM, Hanna DA, Reddi AR. Handling heme: the mechanisms underlying the movement of heme within and between cells. Free Radic Biol Med. 2019:133:88–100. 10.1016/j.freeradbiomed.2018.08.005 - DOI - PMC - PubMed
    1. Espinas NA, Kobayashi K, Sato Y, Mochizuki N, Takahashi K, Tanaka R, Masuda T. Allocation of heme is differentially regulated by ferrochelatase isoforms in Arabidopsis cells. Front Plant Sci. 2016:7:1326. 10.3389/fpls.2016.01326 - DOI - PMC - PubMed