. 2024 Jul:85:101960.
doi: 10.1016/j.molmet.2024.101960. Epub 2024 May 17.

Dorsolateral septum GLP-1R neurons regulate feeding via lateral hypothalamic projections

Affiliations

Dorsolateral septum GLP-1R neurons regulate feeding via lateral hypothalamic projections

Yi Lu et al. Mol Metab. 2024 Jul.

Abstract

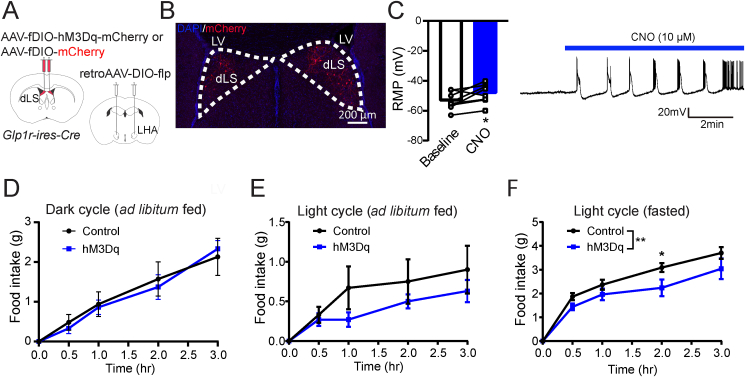
Objective: Although glucagon-like peptide 1 (GLP-1) is known to regulate feeding, the central mechanisms contributing to this function remain enigmatic. Here, we aim to test the role of neurons expressing GLP-1 receptors (GLP-1R) in the dorsolateral septum (dLS; dLSGLP-1R) that project to the lateral hypothalamic area (LHA) on food intake and determine the relationship with feeding regulation.

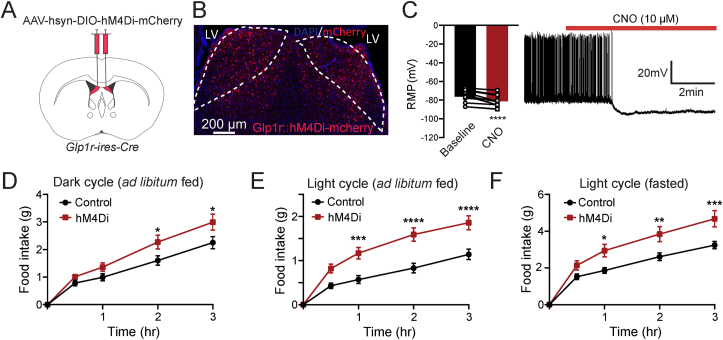
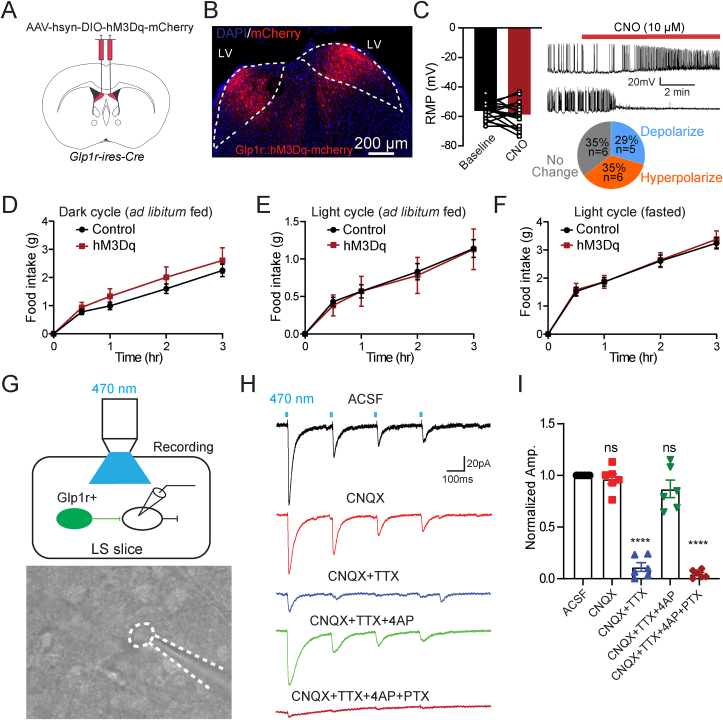
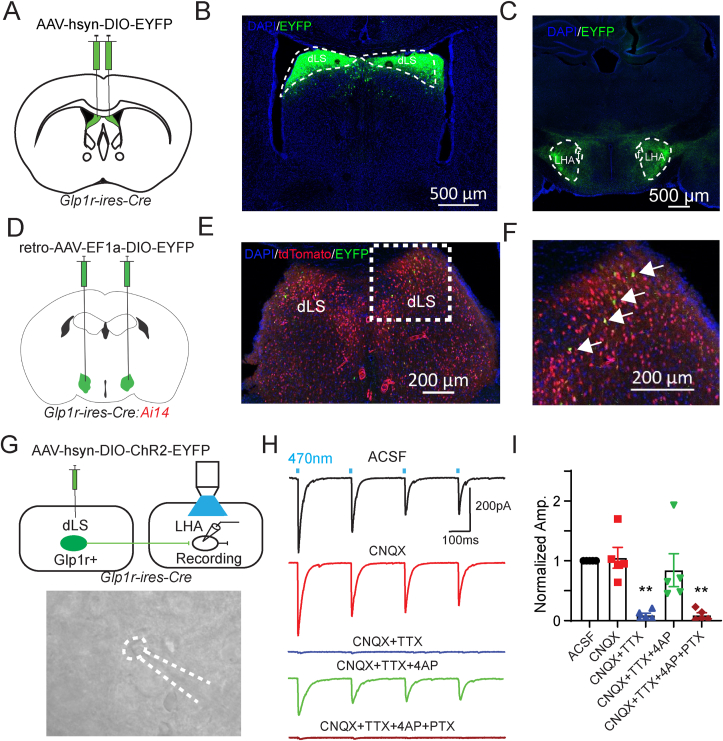
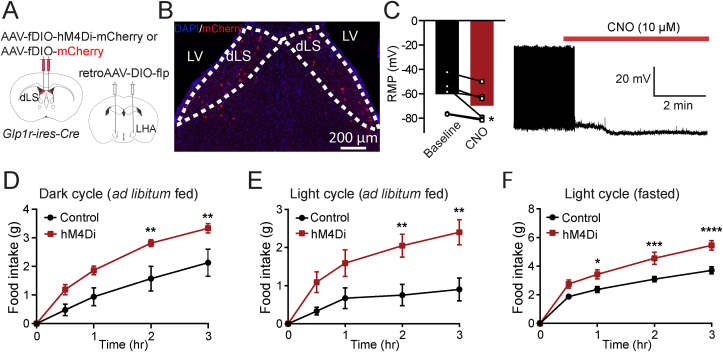
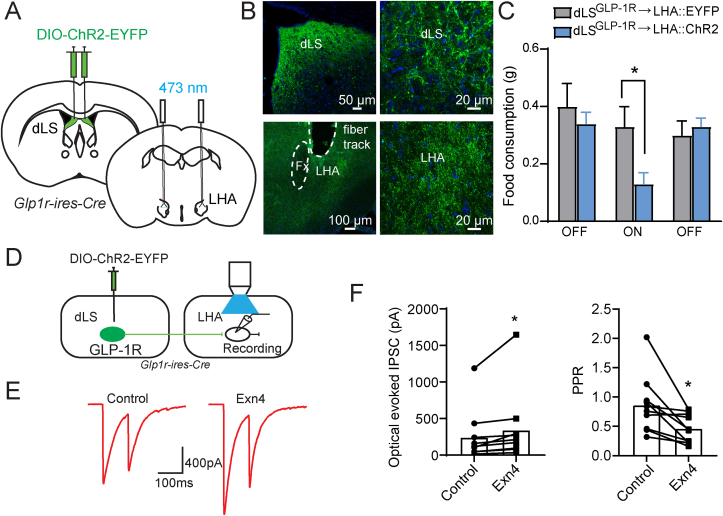
Methods: Using chemogenetic manipulations, we assessed how activation or inhibition of dLSGLP-1R neurons affected food intake in Glp1r-ires-Cre mice. Then, we used channelrhodopsin-assisted circuit mapping, chemogenetics, and electrophysiological recordings to identify and assess the role of the pathway from dLSGLP-1R →LHA projections in regulating food intake.

Results: Chemogenetic inhibition of dLSGLP-1R neurons increases food intake. LHA is a major downstream target of dLSGLP-1R neurons. The dLSGLP-1R→LHA projections are GABAergic, and chemogenetic inhibition of this pathway also promotes food intake. While chemogenetic activation of dLSGLP-1R→LHA projections modestly decreases food intake, optogenetic stimulation of the dLSGLP-1R→LHA projection terminals in the LHA rapidly suppresses feeding behavior. Finally, we demonstrate that the GLP-1R agonist, Exendin 4 enhances dLSGLP-1R →LHA GABA release.

Conclusions: Together, these results demonstrate that dLS-GLP-1R neurons and the inhibitory pathway to LHA can regulate feeding behavior, which might serve as a potential therapeutic target for the treatment of eating disorders or obesity.

Keywords: Feeding; GLP-1; Hypothalamus; Obesity; Septum.


Conflict of interest statement

Declaration of competing interest The authors declare that they have no known competing financial interests or personal relationships that could have appeared to influence the work reported in this paper.

Figures

Figure 1
Figure 1
Inhibition of dLSGLP−1Rneurons acutely increases food intake. (A) Brain schematic of viral injection for chemogenetic dLSGLP−1R neurons inhibition. (B) Transduction of dLSGLP−1R neurons with hM4Di-mCherry. (C) CNO application hyperpolarized the resting membrane potential and reduced the firing rate of dLSGLP−1R neurons (paired t-test, t(12) = 6.281, p < 0.0001, n = 12 cells from 3 mice). (D–F) Chemogenetic inhibition of dLSGLP−1R neurons increased food intake (D) during the dark cycle when fed (two-way ANOVA, main effect of Group: F(1,120) = 14.44,p = 0.0002; main effect of time: F(4,120) = 71.72, p < 0.0001, no interaction between Group and Time: F (4,120) = 1.691, p = 0.1566), (E) during the light cycle when fed (two-way ANOVA, main effect of Group: F(1,120) = 53.89, p < 0.0001; main effect of time: F(4,120) = 58.53, p <0.0001, interaction between Group and Time: F(4,120) = 4.284, p = 0.0028) and (F) refeeding following an overnight fast (two-way ANOVA, main effect of Group: F(1,120) = 28.55, p < 0.0001; main effect of Time: F(4,120) = 68.25, p < 0.0001, interaction between Group and Time: F(4,120) = 2.463, p = 0.0488). n = 13 mice per group. Data are presented as mean ± SEM. Sidak's multiple comparisons test: ∗p < 0.05; ∗∗p < 0.01; ∗∗∗p < 0.001, ∗∗∗∗p < 0.0001.
Figure 2
Figure 2
Activation of dLSGLP−1Rneurons has no significant effect on food intake. (A) Brain schematic of viral injection for dLSGLP−1R neuron activation. (B) Transduction of dLSGLP−1R neurons with hM3Dq-mCherry. (C) CNO application has no significant effect on the resting membrane potential and the firing rate of dLSGLP−1R neurons (paired t-test, t(17), p = 0.2523, n = 17 cells from 3 mice), after CNO application, 35% of neurons exhibited resting membrane potential hyperpolarization, and 29% of neurons exhibited resting membrane potential depolarization. (D–F) Chemogenetic activation of dLSGLP−1R neurons has no significant effect on food intake (D) during the dark cycle when fed (two-way ANOVA, no main effect of Group: F(1,105) = 3.402, p = 0.0679; main effect of Time: F(4,105) = 36.10, p < 0.0001, no interaction between Group and Time: F(4,105) = 0.3067, p = 0.8730.), (E) during the light cycle when fed (two-way ANOVA, no main effect of Group: F(1,105) = 0.06226, p = 0.8034; main effect of Time: F(4,105) = 18.67, p < 0.0001, no interaction between Group and Time: F(4,105) = 0.01724, p = 0.9994), and (F) refeeding following an overnight fast (two-way ANOVA, no main effect of Group: F(1,105) = 0.1432, p = 0.7059; main effect of Time: F(4,105) = 84.5, p < 0.0001, no interaction between Group and Time: F (4,105) = 0.04575, p = 0.9960). n = 13 control and 10 hM3Dq mice. (G–I) Local inhibitory connections in dLS. Schematic showing the experiment used to record postsynaptic currents in local dLS neurons induced by optogenetic stimulation of dLSGLP−1R neurons (G). In brain slice recordings, blue light stimulation evoked robust IPSCs, which were blocked by picrotoxin but not CNQX (H–I) (one-way ANOVA, F (4,25) = 98.81, p < 0.0001, ∗∗∗∗Sidak's multiple comparisons test p < 0.0001 vs. ACSF). n = 6 cells from 3 mice. Data are presented as mean ± SEM.
Figure 3
Figure 3
dLSGLP−1Rneurons project to LHA. (A) Glp1r-ires-Cre mice were injected in dLS with pAAV-hSyn-DIO-EYFP bilaterally. (B and C) Viral-mediated expression of EYFP in dLSGLP−1R neurons soma (B) and axonal projections in the LHA (C) in Glp1r-ires-Cre mice. (D) Glp1r-ires-Cre:Ai14 mice were injected in LHA with retro-pAAV-Ef1a-DIO-EYFP bilaterally. (E and F) Images of coronal brain sections containing the dLS. White arrows indicate GLP-1R+/EYFP+ neurons. (G) Schematic of experiment used to record postsynaptic currents in LHA neurons induced by optogenetic stimulation of dLSGLP−1R neurons. Glp1r-ires-Cre mice were injected in dLS with pAAV-EF1a-double floxed-hChR2(H134R)-EYFP-WPRE-HGHpA bilaterally and LHA neurons were patched. (H) Representative trace of photostimulation (470 nm LED)-evoked IPSC in LHA neurons, which can be blocked by picrotoxin but not CNQX. (I) Normalized IPSC amplitude before and after CNQX, TTX, 4AP and PTX application (one-way ANOVA, F(4,20) = 10.7, p < 0.0001, ∗∗Sidak's multiple comparisons test p < 0.01 vs. ACSF). n = 5 cells from 3 mice. Data are presented as mean ± SEM.
Figure 4
Figure 4
dLSGLP−1R  LHA inhibition increases feeding. (A) Brain schematic of viral injection for dLSGLP−1R → LHA neuron inhibition. (B) Transduction of dLSGLP−1R → LHA neurons with hM4Di-mCherry. (C) CNO application hyperpolarized the resting membrane potential and reduced the firing rate of dLSGLP−1R → LHA projection neurons (paired t-test, t(6) = 2.897, p = 0.0339, n = 6 cells from 3 mice). (D–F) Chemogenetic inhibition of dLSGLP−1R → LHA projection neurons increased food intake (D) during the dark cycle when fed (two-way ANOVA, main effect of Group: F(1,40) = 26.01, p < 0.0001; main effect of Time: F(4,40) = 36.65, p < 0.0001, no interaction between Group and Time: F(4,40) = 1.993, p = 0.1142), (E) during the light cycle when fed (two-way ANOVA, main effect of Group: F(1,60) = 27.88, p < 0.0001; main effect of Time: F(4,60) = 11.68, p < 0.0001, no interaction between Group and Time: F(4,60) = 2.344, p = 0.0649), and (F) refeeding following an overnight fast (two-way ANOVA, main effect of Group: F(1,55) = 44.88, p < 0.0001; main effect of Time: F(4,55) = 104, p < 0.0001, interaction between Group and Time: F(4,55) = 3.795, p = 0.00085). n = 7 control an d6 hM4Di mice. Sidak's multiple comparisons test: ∗p < 0.05, ∗∗p < 0.01, ∗∗∗p < 0.001, ∗∗∗∗p < 0.0001. Data are presented as mean ± SEM.
Figure 5
Figure 5
Activation of dLSGLP−1R projection neurons has no significant effect on food intake. (A) Brain schematic of viral injection for dLSGLP−1R → LHA neuron activation. (B) Transduction of dLSGLP−1R → LHA neurons with hM3Dq-mCherry. (C) CNO application depolarized the resting membrane potential and increased the firing rate of dLSGLP−1R→LHA projection neurons (paired t-test, t(8) = 2.702, p = 0.0306, n = 8 cells from 3 mice). (D–F) Chemogenetic activation of dLSGLP−1R → LHA projection neurons has no significant effect on food intake (D) during the dark cycle when fed (two-way ANOVA, no main effect of Group: F(1,45) = 0.07858, p = 0.7805; main effect of Time: F(4,45) = 23.01, p < 0.0001, no interaction between Group and Time: F(4,45) = 0.1826, p = 0.9463), (E) during the light cycle when fed (two-way ANOVA, a marginally significant main effect of Group: F(1,50) = 3.272, p = 0.0765; main effect of Time: F(4,50) = 6.024, p = 0.0005, no interaction between Group and Time: F(4,50) = 0.4554, p = 0.7680). (F) Chemogenetic activation suppressed food intake during refeeding following an overnight fast (two-way ANOVA, main effect of Group: F(1,50) = 11.01, p = 0.0017; main effect of Time: F(4,50) = 64.4, p < 0.0001, no interaction between Group and Time: F(4,50) = 1.013, p = 0.4096). n = 7 control and 5 hM3Dq mice. Data are presented as mean ± SEM.
Figure 6
Figure 6
dLSGLP−1R→LHA activation suppresses feeding. (A and B) ChR2-EYFP expression in the dLS (A) and axonal projections in the LHA (B) in Glp1r-ires-Cre mice. (C) Photostimulation of dLSGLP−1R → LHA projections significantly suppressed food intake (two-way ANOVA, main effect of Group: F(1,36) = 3.382, p = 0.0742; main effect of Stimulation: F(2,36) = 3.816, p = 0.0314, no interaction between Group and Stimulation: F(2,36) = 2.576, p = 0.0900. ∗Sidak's multiple comparisons test p < 0.05). Data are presented as mean + SEM. n = 6 controls and 8 ChR2 mice. (D) Experimental paradigm for recording postsynaptic currents in LHA slices induced by optogenetic stimulation of dLSGLP−1R neurons. (E) Representative evoked IPSCs after paired-pulse optogenetic stimulation. (F) Quantification of evoked IPSCs (paired t-test, t(10) = 2.312, p = 0.0461) and PPR (paired t-test, t(10) = 3.135, p = 0.0120) before and after Exn4 application. n = 10 cells from 3 mice. ∗p < 0.05.

Update of

References

    1. Morton G.J., Meek T.H., Schwartz M.W. Neurobiology of food intake in health and disease. Nat Rev Neurosci. 2014;15(6):367–378. - PMC - PubMed
    1. Rossi M.A., Stuber G.D. Overlapping brain circuits for homeostatic and hedonic feeding. Cell Metabol. 2018;27(1):42–56. - PMC - PubMed
    1. Sohn J.W., Elmquist J.K., Williams K.W. Neuronal circuits that regulate feeding behavior and metabolism. Trends Neurosci. 2013;36(9):504–512. - PMC - PubMed
    1. Drucker D.J. Mechanisms of action and therapeutic application of glucagon-like peptide-1. Cell Metabol. 2018;27(4):740–756. - PubMed
    1. Muller T.D., Finan B., Bloom S.R., D'Alessio D., Drucker D.J., Flatt P.R., et al. Glucagon-like peptide 1 (GLP-1) Mol Metabol. 2019;30:72–130. - PMC - PubMed

Substances