. 2024 Jul;162(1-2):91-107.
doi: 10.1007/s00418-024-02294-w. Epub 2024 May 19.

CCAT1 lncRNA is chromatin-retained and post-transcriptionally spliced

Affiliations

CCAT1 lncRNA is chromatin-retained and post-transcriptionally spliced

Chaya Bohrer et al. Histochem Cell Biol. 2024 Jul.

Abstract

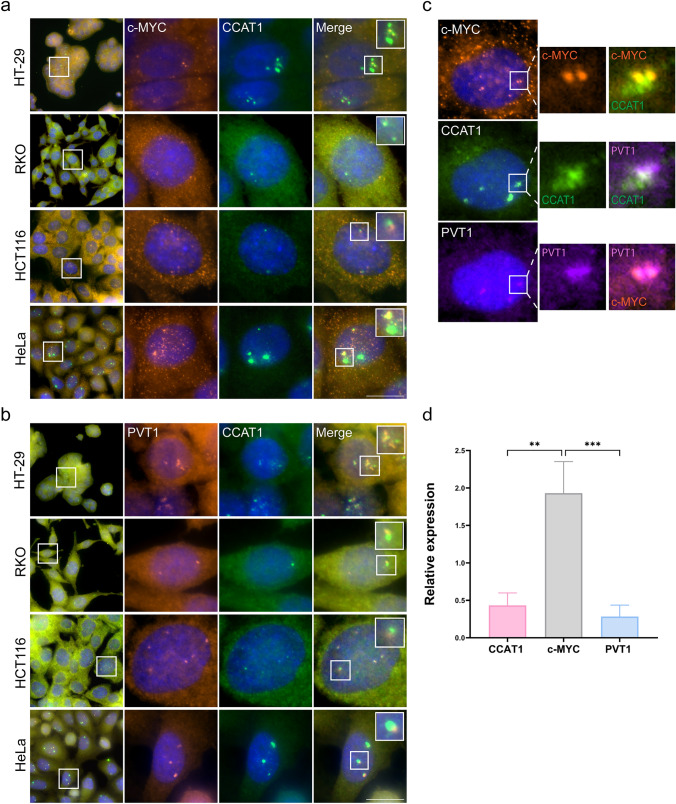
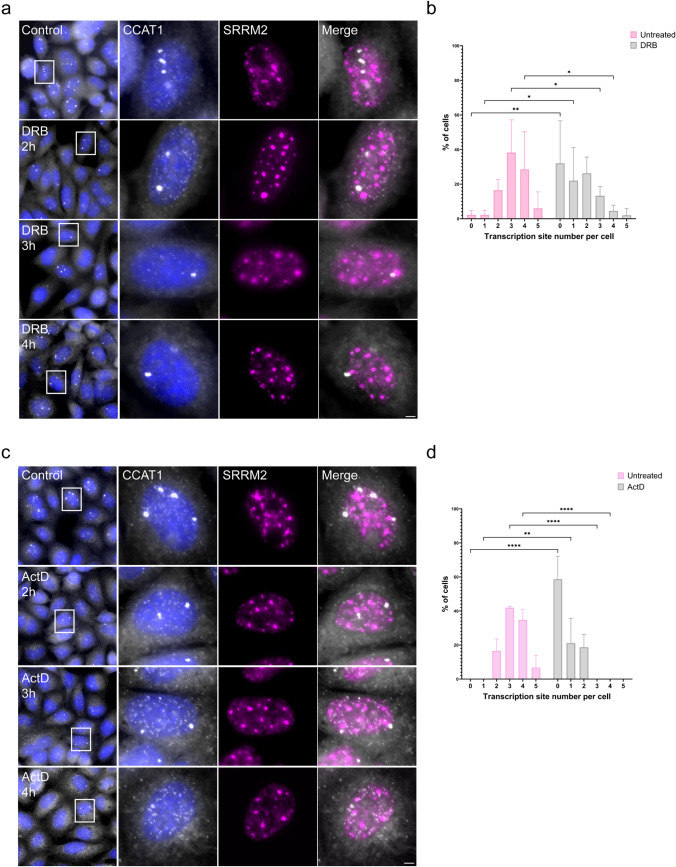
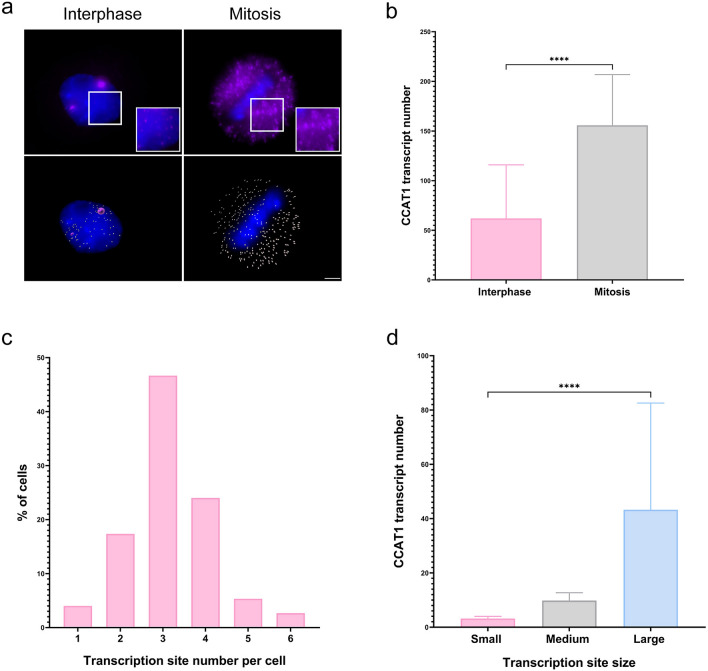
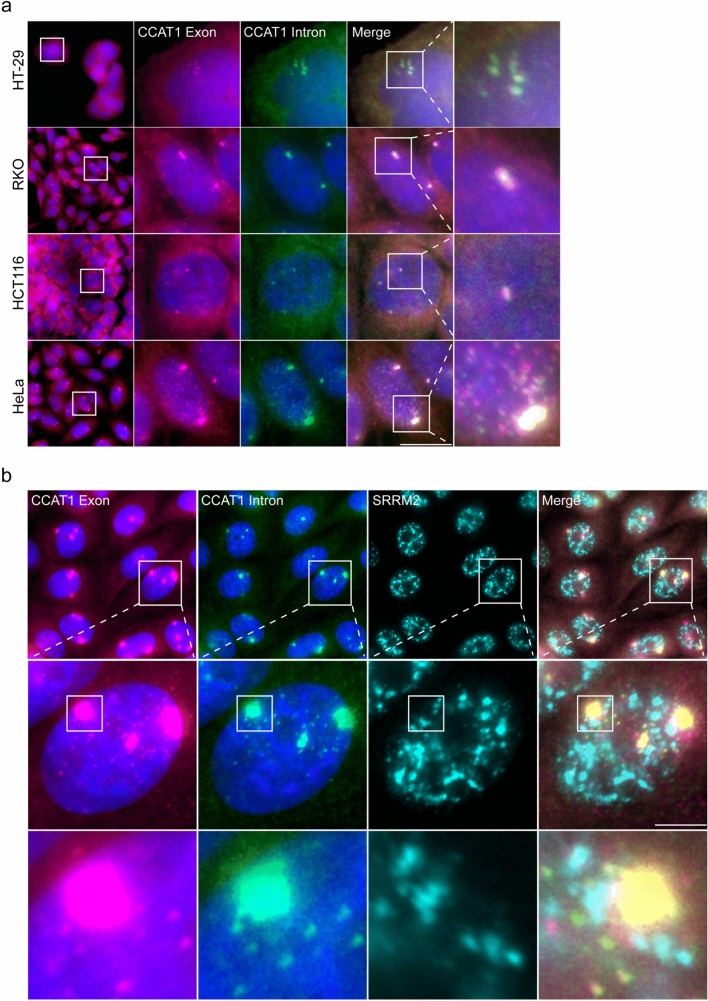
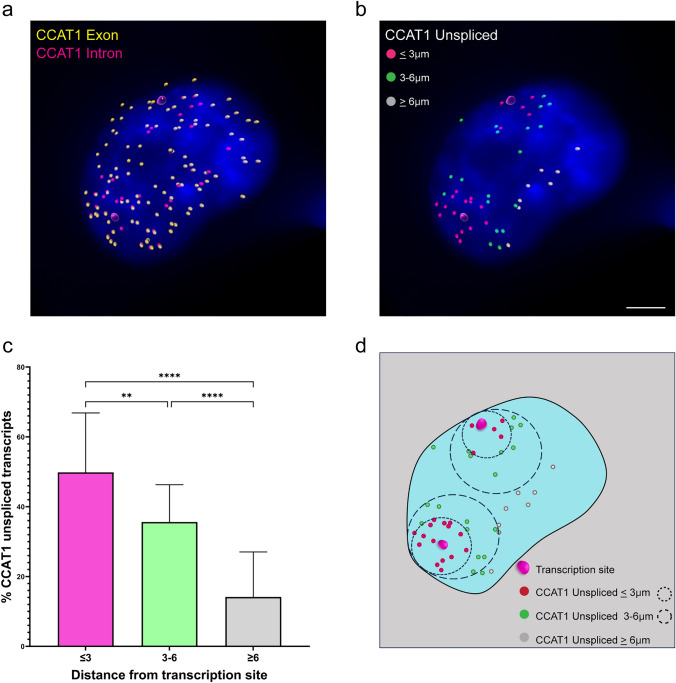
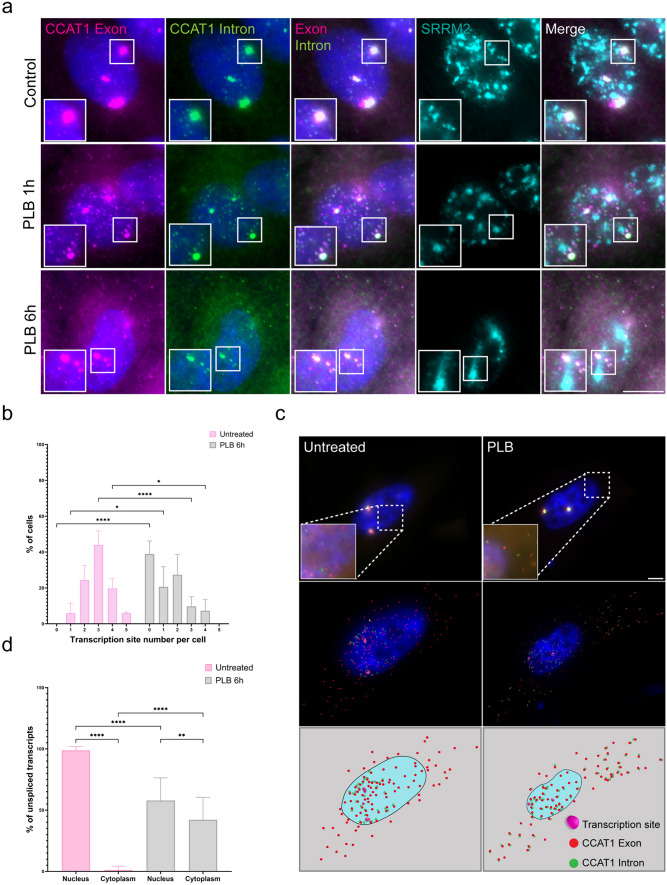
Super-enhancers are unique gene expression regulators widely involved in cancer development. Spread over large DNA segments, they tend to be found next to oncogenes. The super-enhancer c-MYC locus forms long-range chromatin looping with nearby genes, which brings the enhancer and the genes into proximity, to promote gene activation. The colon cancer-associated transcript 1 (CCAT1) gene, which is part of the MYC locus, transcribes a lncRNA that is overexpressed in colon cancer cells through activation by MYC. Comparing different types of cancer cell lines using RNA fluorescence in situ hybridization (RNA FISH), we detected very prominent CCAT1 expression in HeLa cells, observed as several large CCAT1 nuclear foci. We found that dozens of CCAT1 transcripts accumulate on the gene locus, in addition to active transcription occurring from the gene. The accumulating transcripts are released from the chromatin during cell division. Examination of CCAT1 lncRNA expression patterns on the single-RNA level showed that unspliced CCAT1 transcripts are released from the gene into the nucleoplasm. Most of these unspliced transcripts were observed in proximity to the active gene but were not associated with nuclear speckles in which unspliced RNAs usually accumulate. At larger distances from the gene, the CCAT1 transcripts appeared spliced, implying that most CCAT1 transcripts undergo post-transcriptional splicing in the zone of the active gene. Finally, we show that unspliced CCAT1 transcripts can be detected in the cytoplasm during splicing inhibition, which suggests that there are several CCAT1 variants, spliced and unspliced, that the cell can recognize as suitable for export.

Keywords: CCAT1; MYC; PVT1; Post-transcriptional splicing; RNA FISH; Transcription site.


Conflict of interest statement

The authors declare no competing interests.

Figures

Fig. 1
Fig. 1
CCAT1 lncRNA is highly abundant in nuclei of HeLa cells. Detection of a CCAT1 lncRNA (exon; green) with MYC mRNA (orange) or with b PVT1 lncRNA (orange) by RNA FISH in HT-29, RKO, HCT116, and HeLa cells. Large foci are the active genes and small dots are the single RNAs. Hoechst DNA stain is in blue. Boxed areas are enlarged. c RNA FISH in HeLa cells of MYC(orange), CCAT1 (exon; green), and PVT1 (purple) RNAs. Scale bars, 10 µm. d Expression levels of CCAT1, MYC and PVT1 RNAs in HeLa cells measured by semi-quantitative RT-PCR. The 18S gene was used as a housekeeping gene. Data were analyzed using one-way ANOVA, followed by Tukey's post hoc analysis. A significant difference was found in the relative expression levels between MYC to CCAT1 and PVT1. **P < 0.01, ***P < 0.001
Fig. 2
Fig. 2
CCAT1 lncRNAs accumulate on the gene locus. The transcription inhibitors a DRB or c ActD decreased CCAT1 detection at the site of transcription, but small foci were still observed (4 h of treatment). CCAT1 (exon; gray) was detected together with anti-SRRM2 (magenta) that marks nuclear speckles. Hoechst DNA stain is in blue. Boxed areas are enlarged. Scale bars, 10 µm. b The percentage of CCAT1 transcription foci per cell after treatment with DRB or d ActD. A minimum of n = 50 cells were selected for each analysis. Data were analyzed using one-way ANOVA, followed by Tukey's post hoc analysis. *P < 0.05, **P < 0.01, ****P < 0.0001
Fig. 3
Fig. 3
CCAT1 transcripts are released from chromosomes during cell division. a Detection of CCAT1 RNAs by RNA FISH in cells at interphase (left) and metaphase (right). The top panels show original, with zoomed images presented at high signal intensity (boxes). The bottom panel shows analyzed images (Imaris). White spots show the CCAT1 RNA. Large pink dots are sites of transcription. Scale bar, 3 μm. b The total number of CCAT1 RNAs counted in interphase versus metaphase cells. Data were analyzed with independent-samples t-tests. c The distribution of CCAT1 transcription sites per cell under steady-state conditions. d Transcription foci were divided into subgroups according to their size. Each group contained different numbers of transcripts. A minimum of n = 50 cells were selected for each statistical analysis. ****P < 0.0001
Fig. 4
Fig. 4
CCAT1 unspliced transcripts are present in the nucleoplasm of HeLa cells and do not localize with nuclear speckles. a RNA FISH detection of CCAT1 exon (pink) and CCAT1 intron regions (green). HeLa cells displayed high levels of unspliced CCAT1 transcripts at the sites of transcription and low levels of unspliced transcripts in the nucleoplasm. HT-29, HCT116, and RKO cells showed low levels of CCAT1 introns (unspliced transcripts) at the site of transcription. b CCAT1 active genes and nucleoplasmic transcripts were not associated with nuclear speckles marked by anti-SRRM2 (cyan). Hoechst DNA stain is in blue. Boxed areas are enlarged. Scale bars, 10 µm
Fig. 5
Fig. 5
Unspliced CCAT1 transcripts are found in close proximity to the active gene. a CCAT1 spliced and unspliced RNA was detected in untreated cells and analyzed by Imaris; CCAT1 exon spots (cyan) and CCAT1 intron spots (red). Large pink dots are sites of transcription. b Distances of CCAT1 unspliced RNAs from the active genes in untreated cells are color-coded. Pink spots show the unspliced transcripts located less than 3 μm from the active gene; green spots between 3 to 6 μm; and white spots more than 6 μm. Large pink dots are sites of transcription. c Measurements of the distances of CCAT1 unspliced transcripts from the active genes. Data were analyzed with a one-way ANOVA, followed by Tukey's post hoc analysis. **P < 0.01, ****P < 0.0001. A minimum of n = 50 cells were selected for statistical analysis. Scale bar, 3 μm. d Schematic illustration of the measured distances of unspliced CCAT1 transcripts from the active genes
Fig. 6
Fig. 6
Splicing inhibition reduces CCAT1 expression and leads to the appearance of unspliced transcripts in the cytoplasm. a Pladienolide B (PLB) treatment for 1 and 6 h decreased CCAT1 detection at the active genes. Unspliced transcripts were detected at the cytoplasm after 6 h. CCAT1 exon (pink), CCAT1 intron (green), anti-SRRM2 for marking nuclear speckles (cyan). b The percentage of CCAT1 gene foci per cell after treatment with PLB for 6 h. c RNA FISH of CCAT1 exon and intron regions in untreated and splicing-inhibited conditions. CCAT1 exon (red), CCAT1 intron (green). The top panel represents original and zoomed images at higher intensity (boxes). The middle panel shows analyzed images (Imaris). Red spots show CCAT1 exon and green spots show CCAT1 intron. The bottom row presents a schematic illustration. Scale bar, 4 μm. d The percentage of unspliced transcripts in the cytoplasm compared with nuclei in control and under splicing inhibition conditions. Data were analyzed with b independent-sample t-tests and d one-way ANOVA, followed by Tukey's post hoc analysis. *P < 0.05, **P < 0.01, ****P < 0.0001. A minimum of n = 50 cells were selected for statistical analysis

Similar articles

References

    1. Ahmadiyeh N, Pomerantz MM, Grisanzio C, Herman P, Jia L, Almendro V, He HH, Brown M, Liu XS, Davis M, Caswell JL, Beckwith CA, Hills A, Macconaill L, Coetzee GA, Regan MM, Freedman ML. 8q24 prostate, breast, and colon cancer risk loci show tissue-specific long-range interaction with MYC. Proc Natl Acad Sci U S A. 2010;107(21):9742–9746. doi: 10.1073/pnas.0910668107. - DOI - PMC - PubMed
    1. Alaiyan B, Ilyayev N, Stojadinovic A, Izadjoo M, Roistacher M, Pavlov V, Tzivin V, Halle D, Pan H, Trink B, Gure AO, Nissan A. Differential expression of colon cancer associated transcript1 (CCAT1) along the colonic adenoma-carcinoma sequence. BMC Cancer. 2013;13:196. doi: 10.1186/1471-2407-13-196. - DOI - PMC - PubMed
    1. Amjadi-Moheb F, Paniri A, Akhavan-Niaki H. Insights into the links between MYC and 3D chromatin structure and epigenetics regulation: implications for cancer therapy. Cancer Res. 2021;81(8):1925–1936. doi: 10.1158/0008-5472.CAN-20-3613. - DOI - PubMed
    1. Ansari H, Shahrisa A, Birgani YT, Birgani MT, Hajjari M, Asl JM. Long noncoding RNAs in colorectal adenocarcinoma; an in silico analysis. Pathol Oncol Res. 2019;25(4):1387–1394. doi: 10.1007/s12253-018-0428-2. - DOI - PubMed
    1. Barutcu AR, Wu M, Braunschweig U, Dyakov BJA, Luo Z, Turner KM, Durbic T, Lin ZY, Weatheritt RJ, Maass PG, Gingras AC, Blencowe BJ. Systematic mapping of nuclear domain-associated transcripts reveals speckles and lamina as hubs of functionally distinct retained introns. Mol Cell. 2022;82(5):1035–1052 e1039. doi: 10.1016/j.molcel.2021.12.010. - DOI - PubMed

LinkOut - more resources