. 2024 May 20;10(1):53.
doi: 10.1038/s41421-024-00682-z.

DEPDC5 protects CD8+ T cells from ferroptosis by limiting mTORC1-mediated purine catabolism

Affiliations

DEPDC5 protects CD8+ T cells from ferroptosis by limiting mTORC1-mediated purine catabolism

Song Li et al. Cell Discov. .

Abstract

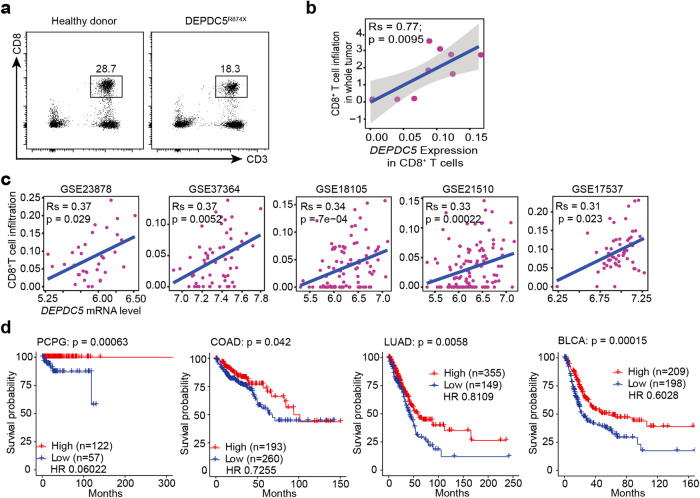
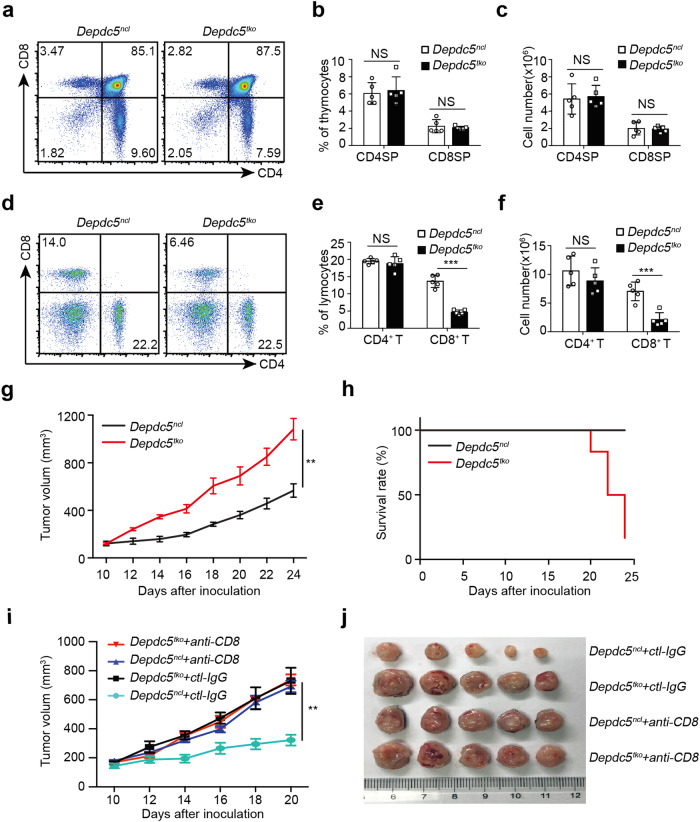
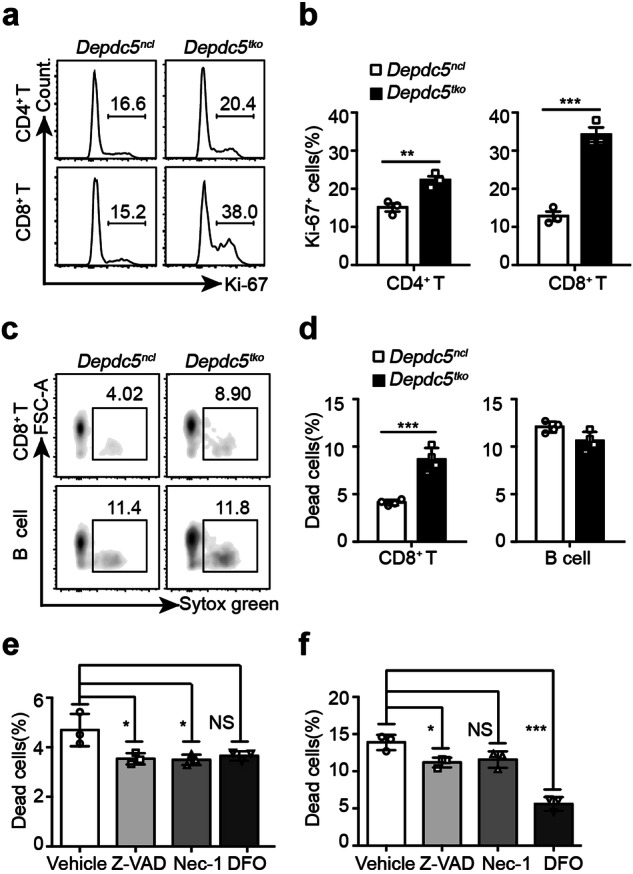
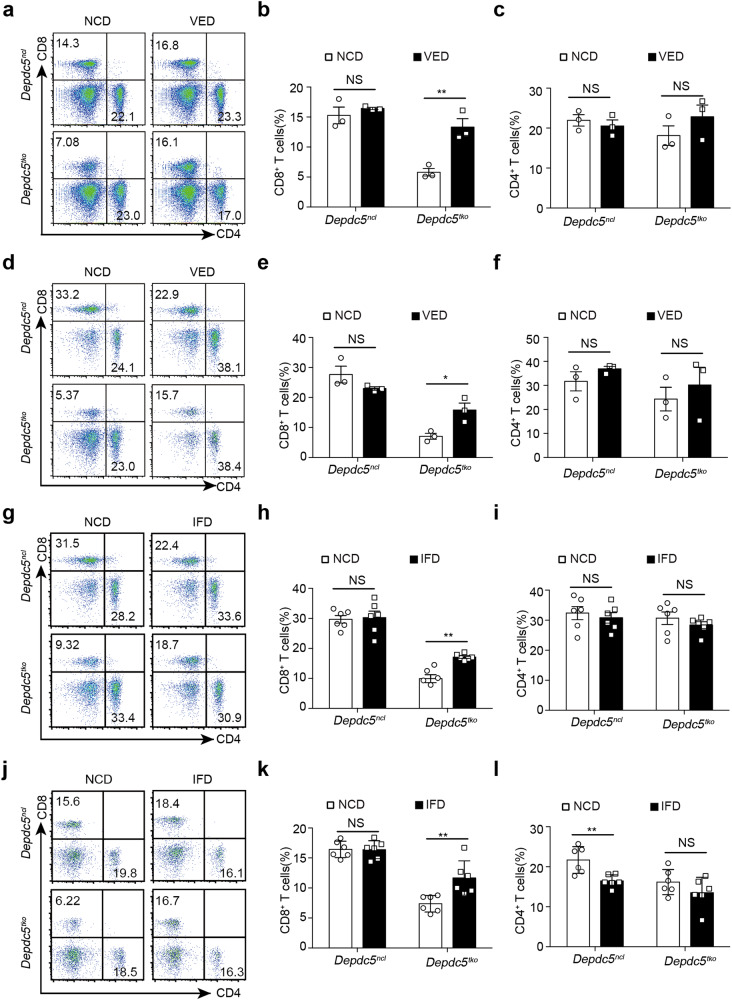
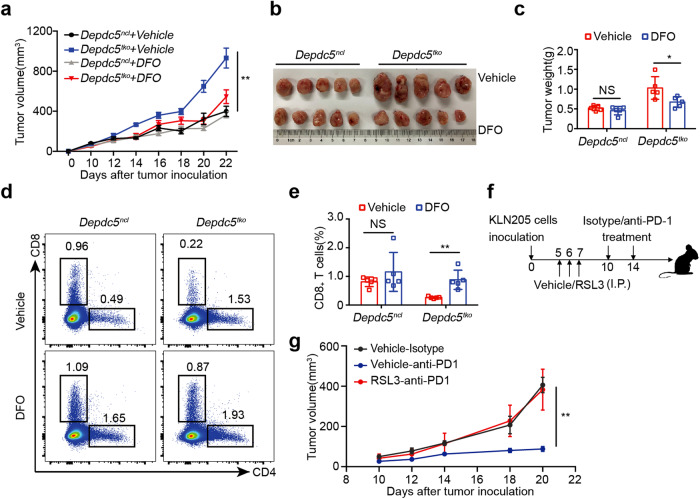
Peripheral CD8+ T cell number is tightly controlled but the precise molecular mechanism regulating this process is still not fully understood. In this study, we found that epilepsy patients with loss of function mutation of DEPDC5 had reduced peripheral CD8+ T cells, and DEPDC5 expression positively correlated with tumor-infiltrating CD8+ T cells as well as overall cancer patient survival, indicating that DEPDC5 may control peripheral CD8+ T cell homeostasis. Significantly, mice with T cell-specific Depdc5 deletion also had reduced peripheral CD8+ T cells and impaired anti-tumor immunity. Mechanistically, Depdc5-deficient CD8+ T cells produced high levels of xanthine oxidase and lipid ROS due to hyper-mTORC1-induced expression of ATF4, leading to spontaneous ferroptosis. Together, our study links DEPDC5-mediated mTORC1 signaling with CD8+ T cell protection from ferroptosis, thereby revealing a novel strategy for enhancing anti-tumor immunity via suppression of ferroptosis.


Conflict of interest statement

The authors declare no competing interests.

Figures

Fig. 1
Fig. 1. DEPDC5 expression positively correlates with tumor infiltration by CD8+ T cells and overall patient survival.
a Flow cytometry analysis of peripheral blood mononuclear cells (PBMCs) from healthy donors and patients with DEPDC5 mutations (DEPDC5R874X), after staining with anti-human CD3 and CD8 antibodies. The number above the box in each panel represents CD3+CD8+ T cells as a percentage of total PBMCs. b Percentage of tumor-infiltrating CD8+ T cells correlates with gene expression level of DEPDC5 within the CD8+ population, as analyzed by scRNA-seq of tumor samples from 9 patients with colorectal cancer. c Spearman correlation of DEPDC5 mRNA level with percentage of tumor-infiltrating CD8+ T cells across five independent CRC datasets, including GSE23878 (n = 35), GSE37364 (n = 56), GSE18105 (n = 94), GSE21510 (n = 123), GSE17537 (n = 55). d Kaplan-Meier curve indicating overall survival (OS) of patients based on DEPDC5 expression status across 4 types of cancer. PCPG Pheochromocytoma, and paraganglioma, COAD Colonic adenocarcinoma, LUAD Lung adenocarcinoma, BLCA Bladder urothelial carcinoma.
Fig. 2
Fig. 2. DEPDC5 maintains peripheral CD8+ T cell frequency and anti-tumor immunity.
a Flow cytometry analysis of thymic CD4+ and CD8+ T cells from Depdc5ncl and Depdc5tko mice after staining with anti-mouse CD4 and CD8 antibodies. Numbers in each quadrant show the percentage of the gated populations. b Summary bar graph showing the average percentage of CD4SP and CD8SP cells among total thymocytes from Depdc5ncl and Depdc5tko mice (n = 5). c Summary bar graph showing the number of CD4SP and CD8SP thymocytes from Depdc5ncl and Depdc5tko mice (n = 5). d Flow cytometry analysis of splenic CD4+ and CD8+ T cells from Depdc5ncl and Depdc5tko mice after staining with anti-mouse CD4 and CD8 antibodies. Numbers in each quadrant show the percentage of the gated populations. e Summary bar graph showing the percentages of splenic CD4+ and CD8+ T cells in Depdc5ncl mice and Depdc5tko mice (n = 5). f Summary bar graph showing the number of splenic CD4+ and CD8+ T cells in Depdc5ncl mice and Depdc5tko mice (n = 5). g Depdc5ncl and Depdc5tko mice were injected subcutaneously with 5 × 10⁵ MC38 colon cancer cells at day 0. Tumor volumes were measured at the indicated time points after inoculation (n = 6). h Survival curve of Depdc5ncl and Depdc5tko tumor-bearing mice. Animals were sacrificed after tumor volume reached 1000 mm3 (then recorded as dead at the corresponding time point). i Depdc5ncl and Depdc5tko mice were injected subcutaneously with 5 × 10⁵ MC38 colon cancer cells at day 0. Both Depdc5ncl and Depdc5tko mice were administered 250 μg/mouse anti-CD8 monoclonal antibody or a control IgG via I.P. injection at day 3, day 6, and day 9 after inoculation. Tumor volumes were measured at the indicated time points after inoculation (n = 5). j Picture of MC38 tumors from Depdc5ncl and Depdc5tko mice that were I.P. injection treated or not with anti-mouse CD8 depletion antibody or control IgG. Mice were sacrificed at day 21 after inoculation and tumors were freshly isolated from subcutaneous tissue. Error bars indicate means ± SEM (NS, not significant, **P < 0.01, ***P < 0.001 by unpaired Student’s t-test).
Fig. 3
Fig. 3. Depdc5-deficient CD8+ T cells display enhanced ferroptosis.
a Representative histograms showing Ki-67 levels in splenic CD4+ and CD8+ T cells from Depdc5ncl and Depdc5tko mice. Splenocytes from Depdc5ncl and Depdc5tko mice were stained with a fixable viability dye and antibodies against CD4, CD8, and Ki-67. Numbers in the gated areas show the percentage of Ki-67+ cells within the indicated populations. b Summary bar graph of percentage Ki-67+ cells within the CD4+ and CD8+ compartments of Depdc5ncl and Depdc5tko mice (n = 3). c Flow cytometry analysis of dead lymphocytes (Sytox green positive) among splenic CD8+ T cells and B cells from Depdc5ncl and Depdc5tko mice (after in vitro culture for 4 h with Sytox green viability dye, anti-B220 antibody, and anti-CD8 antibody). d Summary bar graphs showing the percentage of dead CD8+ T cells and B cells from Depdc5ncl and Depdc5tko mice after in vitro culture for 4 h (n = 4). e Summary bar graph showing the percentage of dead WT CD8+ T cells after treatment with vehicle only, pan-caspase inhibitor Z-VAD-FMK (Z-VAD), necroptosis inhibitor Necrostatin-1 (Nec-1), or ferroptosis inhibitor Deferoxamine (DFO). LN cells from Depdc5ncl mice after in vitro culture for 4 h with vehicle only, Z-VAD, Nec-1, or DFO, then stained with anti-CD8 antibody and fixable viability dye. Total CD8+ T lymphocytes were gated for dead cell analysis by flow cytometry. f Summary bar graph showing the percentage of dead CD8+ T cells after treatment with vehicle only, Z-VAD, Nec-1, or DFO. LN cells from Depdc5tko mice were cultured in vitro for 4 h in the presence of vehicle only, Z-VAD, Nec-1, or DFO, then stained with anti-CD8 antibody and fixable viability dye for flow cytometry analysis. Total CD8+ T cells were gated for dead cell analysis. Error bars indicate means ± SEM (NS, not significant, *P < 0.05, **P < 0.01, ***P < 0.001 by unpaired Student’s t-test).
Fig. 4
Fig. 4. Ferroptosis suppression rescues CD8+ T cells in Depdc5tko mice.
a Flow cytometry analysis of splenic CD4+ and CD8+ T cells from Depdc5ncl and Depdc5tko mice fed with NCD or VED for 4 weeks. Numbers in quadrants show the percentage of the gated subsets. b, c Summary bar graphs showing the percentage of splenic CD8+ T cells (b) and CD4+ T cells (c) from Depdc5ncl and Depdc5tko mice as described in a (n = 3). df Representative flow cytometry plots (d), and bar graphs showing the percentage of CD8+ T cells (e) and CD4+ T cells (f) in LN from Depdc5ncl and Depdc5tko mice fed with NCD or VED for 4 weeks as in a (n = 3). g Flow cytometry analysis of LN CD4+ and CD8+ T cells from Depdc5ncl and Depdc5tko mice fed with NCD or IFD for 4 weeks. Numbers in quadrants show the percentage of the gated subsets. h, i Summary bar graphs show the percentage of CD8+ T cells (h) and CD4+ T cells (i) from Depdc5ncl and Depdc5tko mice as described in g (n = 6). jl Representative flow cytometry plots (j), and bar graphs showing the percentage of CD8+ T cells (k) and CD4+ T cells (l) in blood from Depdc5ncl and Depdc5tko mice fed with NCD or IFD for 4 weeks (n = 6). Error bars indicate means ± SEM. (NS, not significant, *P < 0.05, **P < 0.01 by unpaired Student’s t-test).
Fig. 5
Fig. 5. Rapamycin treatment increases blood CD8+ T cell frequency in Depdc5tko mice.
a Representative histograms showing phosphorylated S6-S235/236 levels in splenic CD8+ T cells from Depdc5ncl and Depdc5tko mice after treatment with vehicle only or rapamycin (100 μg/kg daily for 4 weeks). After treatment, splenocytes were isolated and stained with a fixable viability dye, anti-mouse CD8 antibody, and anti-S6-S235/236 phosphorylation antibody for analysis by flow cytometry. b Summary bar graph showing MFI of phosphorylated S6-S235/236 in splenic CD8+ T cells from Depdc5ncl and Depdc5tko mice (n = 3) as described as a. ce Representative flow cytometry plots (c) and summary bar graphs showing percentage of CD8+ T cells (d) and CD4+ T cells (e) in LN from Depdc5ncl and Depdc5tko mice treated with rapamycin or vehicle only as in a. LN single cell suspensions were prepared from Depdc5ncl and Depdc5tko mice treated daily with vehicle only or 100 μg/kg rapamycin for 4 weeks prior to staining with a fixable viability dye and antibodies against CD4 and CD8 prior to flow cytometry analysis. f, g Representative histogram (f) and a summary bar graph (g) showing relative lipid ROS levels in splenic CD8+ T cells from Depdc5ncl and Depdc5tko mice treated with vehicle only or rapamycin for 4 weeks. Splenocytes from the same mice in a were cultured in the presence of 2 μM BODIPY™ 581/591 C11 for 4 h, washed twice in PBS, then stained with a fixable viability dye and antibodies against CD4 and CD8 for flow cytometry analysis. Error bars indicate means ± SEM. (NS, not significant, **P < 0.01 by unpaired Student’s t-test).
Fig. 6
Fig. 6. Depdc5-deficient CD8+ T cells display enhanced expression of purine catabolic enzyme XO due to hyper-mTORC1-ATF4 activation.
a Volcano plot of differentially expressed genes (DEGs) generated by RNA-seq analysis of Depdc5 WT (Depdc5WT) and Depdc5 knock-out (Depdc5KO) CD8+ T cells. Red dots represent genes significantly upregulated in Depdc5KO CD8+ T cells (P < 0.05 and log2 fold change (FC )≥ 0.5), while blue dots represent genes significantly downregulated (P < 0.05 and log2 FC ≤ 0.5), and grey dots indicate DEGs below the level of significance. b KEGG pathway analysis of upregulated DEGs in a. The top 10 significant KEGG pathways based on upregulated genes are presented by normalized enrichment score (NES) and P value. c Gene set enrichment of “KEGG purine metabolism” pathway in Depdc5KO relative to Depdc5WT CD8+ T cells. d Heatmap showing normalized expression of purine metabolism-linked genes that were significantly up-regulated in Depdc5KO CD8+ T cells (n = 4). e Heatmap showing normalized expression of genes encoding ROS-generating enzymes in Depdc5WT and Depdc5KO CD8+ T cells (n = 4). f RT-qPCR analysis of Xdh, Mki67, and related anti-ferroptotic mevalonate pathway genes Hmgcr, Hmgcs1, and Sqle expression in CD8+ T cells from Depdc5ncl and Depdc5tko mice. Relative mRNA levels were normalized to Gapdh mRNA level (n = 4). g Immunoblotting of XO protein level in Depdc5WT and Depdc5KO splenic CD8+ T cells. XO molecular weight is 145 kDa (long form) or 125 kDa (short form) while XDH molecular weight is 145 kDa. ERK1/2 served as a loading control. Numbers under the XO immunoblotting bands indicate the density of XO relative to ERK1/2. h Bar graph showing analysis of uric acid levels in Depdc5WT and Depdc5KO CD8+ T cells (n = 3). i Immunoblotting of ATF4 protein level in Depdc5WT and Depdc5KO splenic CD8+ T cells. S6K and S6K-pT389 profiles were assessed to determine mTORC1 activity, while p38 served as a loading control. j Heatmap showing normalized expression of ATF4 target genes in Depdc5WT and Depdc5KO CD8+ T cells (n = 3). k Cellular ROS levels in Depdc5WT and Depdc5KO splenic CD8+ T cells treated for 4 h in vitro with either vehicle alone or XO inhibitor allopurinol. l Relative lipid peroxidation levels in Depdc5WT and Depdc5KO splenic CD8+ T cells treated as in k. Error bars indicate means ± SEM (NS, not significant, *P < 0.05, ***P < 0.001, ****P < 0.0001 by unpaired Student’s t-test).
Fig. 7
Fig. 7. Ferroptosis inhibitor DFO restores anti-tumor immunity in Depdc5tko mice.
a Depdc5ncl and Depdc5tko mice were injected subcutaneously with 5 × 10⁵ MC38 tumor cells at day 0. Both Depdc5ncl and Depdc5tko mice were divided into two groups: the first group received I.P. injection with 200 μg/kg/day DFO, while the second group received I.P. injection vehicle only, beginning day 1 after tumor inoculation. Tumor volumes were then measured at the indicated time points (n = 5). b Photograph of MC38 tumors from Depdc5ncl and Depdc5tko mice treated with vehicle only or DFO prior to sacrifice on day 23 after tumor inoculation (n = 5). c Summary bar graph showing tumor weight in Depdc5ncl and Depdc5tko mice treated with vehicle only or DFO prior to sacrifice on day 23 after tumor inoculation. d Flow cytometry analysis of tumor-infiltrating CD4+ and CD8+ T cell percentages within the CD45+ pool of MC38 tumors from Depdc5ncl and Depdc5tko mice treated with vehicle or DFO. At day 23 after tumor inoculation, single-cell suspensions of each tumor were isolated from individual mice, then stained with a fixable viability dye and antibodies against CD45 and CD8 prior to analysis by flow cytometry. e Summary bar graph showing tumor-infiltrating CD8+ T cell percentage within the CD45+ pool of tumor tissue as in d. f Mice were inoculated with KLN205 cells, treated with vehicle or RSL3 from day 5 to day 7, and received anti-PD1 or isotype control antibodies on day 10 and day 14. g Comparison of KLN205 tumor growth curve in Vehicle-Isotype, Vehicle-anti-PD1, and RSL3-anti-PD1 conditions treated as f. Error bars indicate means ± SEM (NS, not significant, *P < 0.05, **P < 0.01 by unpaired Student’s t-test).

Similar articles

Cited by

References

    1. Philip M, Schietinger A. CD8(+) T cell differentiation and dysfunction in cancer. Nat. Rev. Immunol. 2022;22:209–223. doi: 10.1038/s41577-021-00574-3. - DOI - PMC - PubMed
    1. Chen Y, et al. Regulation of CD8(+) T memory and exhaustion by the mTOR signals. Cell. Mol. Immunol. 2023;20:1023–1039. doi: 10.1038/s41423-023-01064-3. - DOI - PMC - PubMed
    1. Vesely MD, Zhang T, Chen L. Resistance Mechanisms to Anti-PD Cancer Immunotherapy. Annu. Rev. Immunol. 2022;40:45–74. doi: 10.1146/annurev-immunol-070621-030155. - DOI - PubMed
    1. Kawabe T, Yi J, Sprent J. Homeostasis of Naive and Memory T Lymphocytes. Cold Spring Harb. Perspect. Biol. 2021;13:a037879. doi: 10.1101/cshperspect.a037879. - DOI - PMC - PubMed
    1. Ramanathan S, et al. Cytokine synergy in antigen-independent activation and priming of naive CD8(+) T lymphocytes. Crit. Rev. Immunol. 2009;29:219–239. doi: 10.1615/CritRevImmunol.v29.i3.30. - DOI - PubMed