

Systematic in-silico evaluation of fibrosis effects on re-entrant wave dynamics in atrial tissue
- PMID: 38763959
- PMCID: PMC11639732
- DOI: 10.1038/s41598-024-62002-5
Systematic in-silico evaluation of fibrosis effects on re-entrant wave dynamics in atrial tissue
Abstract
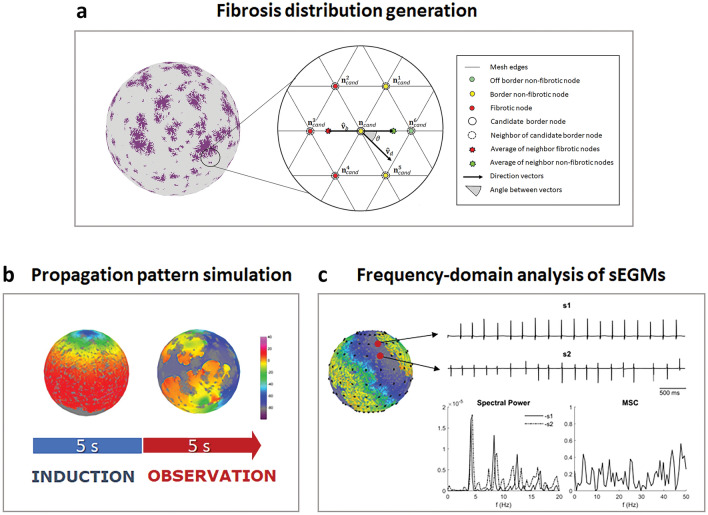
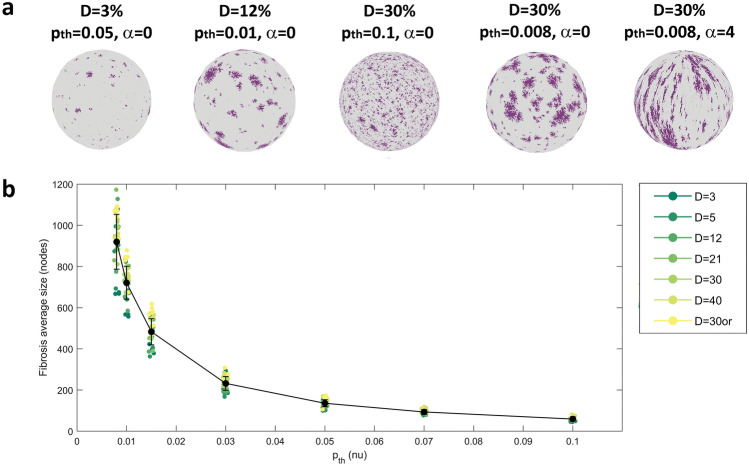
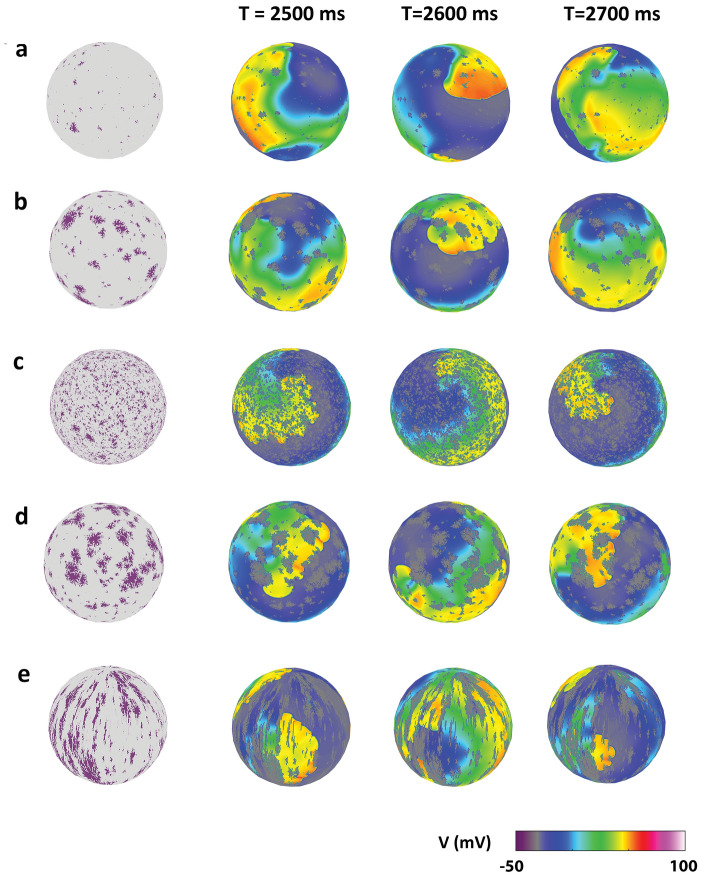
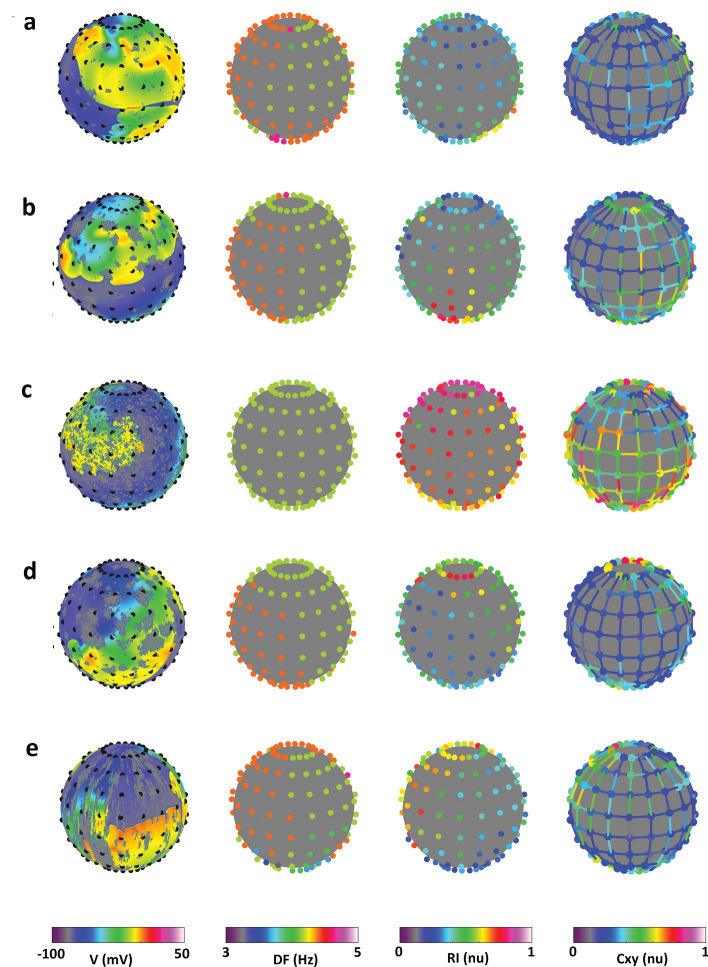
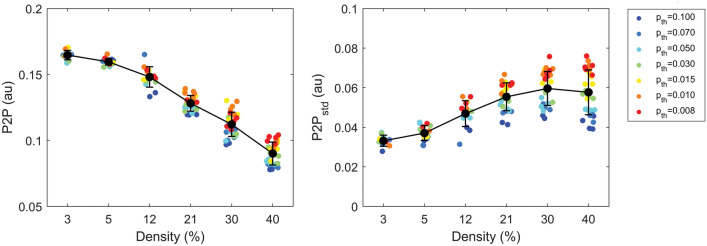
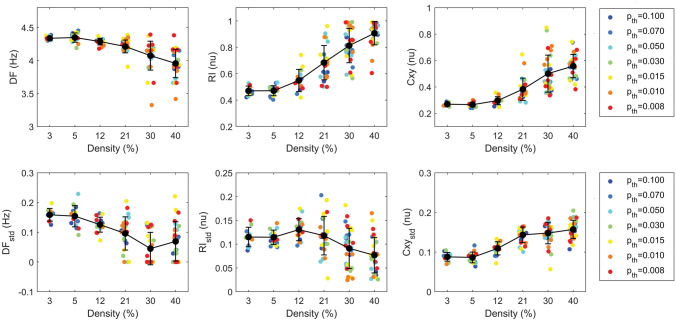
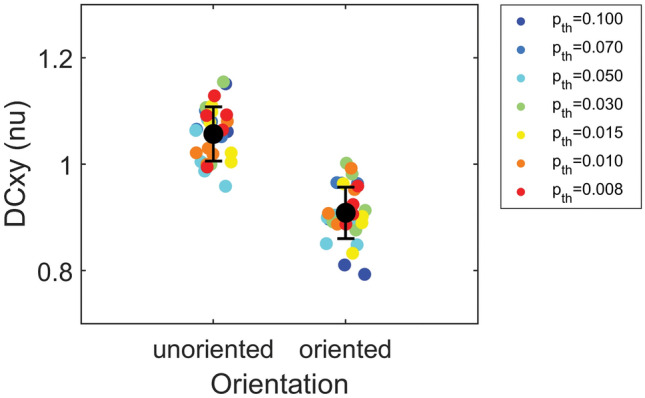
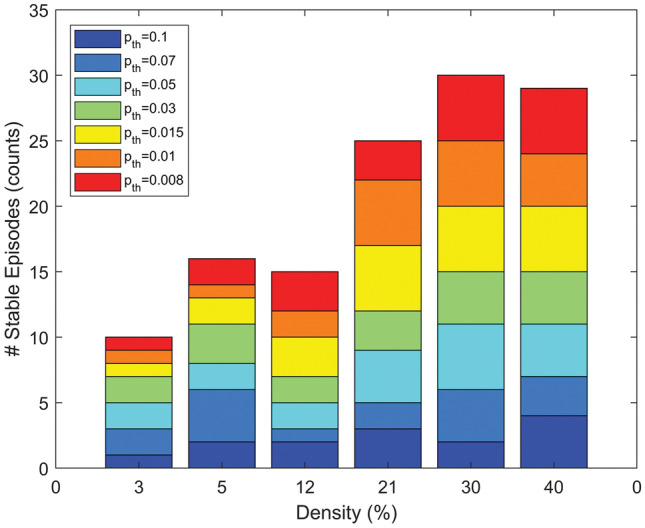
Despite the key role of fibrosis in atrial fibrillation (AF), the effects of different spatial distributions and textures of fibrosis on wave propagation mechanisms in AF are not fully understood. To clarify these aspects, we performed a systematic computational study to assess fibrosis effects on the characteristics and stability of re-entrant waves in electrically-remodelled atrial tissues. A stochastic algorithm, which generated fibrotic distributions with controlled overall amount, average size, and orientation of fibrosis elements, was implemented on a monolayer spheric atrial model. 245 simulations were run at changing fibrosis parameters. The emerging propagation patterns were quantified in terms of rate, regularity, and coupling by frequency-domain analysis of correspondent synthetic bipolar electrograms. At the increase of fibrosis amount, the rate of reentrant waves significantly decreased and higher levels of regularity and coupling were observed (p < 0.0001). Higher spatial variability and pattern stochasticity over repetitions was observed for larger amount of fibrosis, especially in the presence of patchy and compact fibrosis. Overall, propagation slowing and organization led to higher stability of re-entrant waves. These results strengthen the evidence that the amount and spatial distribution of fibrosis concur in dictating re-entry dynamics in remodeled tissue and represent key factors in AF maintenance.
© 2024. The Author(s).
Conflict of interest statement
The authors declare no competing interests.
Figures
Similar articles
-
Patient-derived models link re-entrant driver localization in atrial fibrillation to fibrosis spatial pattern.Cardiovasc Res. 2016 Jun 1;110(3):443-54. doi: 10.1093/cvr/cvw073. Epub 2016 Apr 7. Cardiovasc Res. 2016. PMID: 27056895 Free PMC article.
-
The effect of complex intramural microstructure caused by structural remodeling on the stability of atrial fibrillation: Insights from a three-dimensional multi-layer modeling study.PLoS One. 2018 Nov 28;13(11):e0208029. doi: 10.1371/journal.pone.0208029. eCollection 2018. PLoS One. 2018. PMID: 30485346 Free PMC article.
-
The Effects of Fibrotic Cell Type and Its Density on Atrial Fibrillation Dynamics: An In Silico Study.Cells. 2021 Oct 15;10(10):2769. doi: 10.3390/cells10102769. Cells. 2021. PMID: 34685750 Free PMC article.
-
Towards personalized computational modelling of the fibrotic substrate for atrial arrhythmia.Europace. 2016 Dec;18(suppl 4):iv136-iv145. doi: 10.1093/europace/euw358. Europace. 2016. PMID: 28011841 Free PMC article. Review.
-
Fibrosis and Atrial Fibrillation: Computerized and Optical Mapping; A View into the Human Atria at Submillimeter Resolution.JACC Clin Electrophysiol. 2017 Jun;3(6):531-546. doi: 10.1016/j.jacep.2017.05.002. Epub 2017 Jun 20. JACC Clin Electrophysiol. 2017. PMID: 29159313 Free PMC article. Review.
Cited by
-
Hybrid Ablation in Atrial Fibrillation: Bridging Mechanistic Understanding and Clinical Practice.J Cardiovasc Dev Dis. 2025 Aug 19;12(8):313. doi: 10.3390/jcdd12080313. J Cardiovasc Dev Dis. 2025. PMID: 40863379 Free PMC article. Review.
References
-
- Hindricks, G. et al. 2020 ESC Guidelines for the diagnosis and management of atrial fibrillation developed in collaboration with the European Association for Cardio-Thoracic Surgery (EACTS): The Task Force for the diagnosis and management of atrial fibrillation of the European Society of Cardiology (ESC) Developed with the special contribution of the European Heart Rhythm Association (EHRA) of the ESC. Eur. Heart J.42, 373–498 (2021). - PubMed
-
- Schotten, U., Verheule, S., Kirchhof, P. & Goette, A. Pathophysiological mechanisms of atrial fibrillation: A translational appraisal. Physiol. Rev.91, 265–325 (2011). - PubMed
-
- Lau, D. H. et al. Pathophysiology of paroxysmal and persistent atrial fibrillation: Rotors, foci and fibrosis. Heart Lung Circ.26, 887–893 (2017). - PubMed
-
- Masè, M., Marini, M., Disertori, M. & Ravelli, F. Dynamics of AV coupling during human atrial fibrillation: Role of atrial rate. Am. J. Physiol. Heart Circ. Physiol.309, H198-205 (2015). - PubMed
MeSH terms
LinkOut - more resources
Full Text Sources
Medical
