. 2024 May 20;81(1):221.
doi: 10.1007/s00018-024-05251-x.

P62 promotes FSH-induced antral follicle formation by directing degradation of ubiquitinated WT1

Affiliations

P62 promotes FSH-induced antral follicle formation by directing degradation of ubiquitinated WT1

Ting Zhao et al. Cell Mol Life Sci. .

Abstract

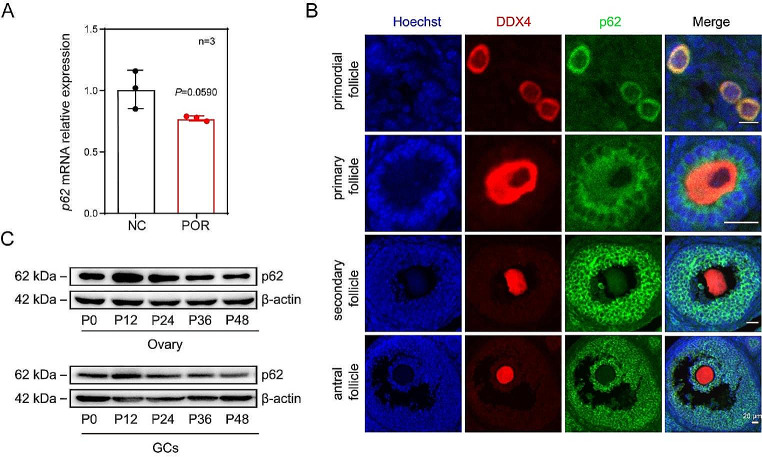
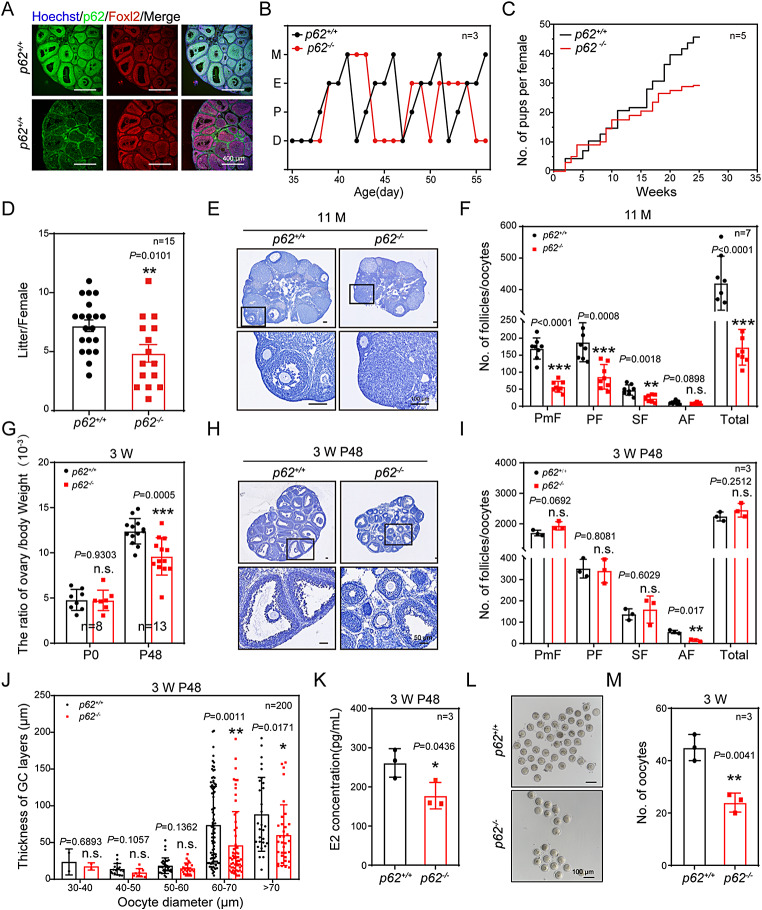
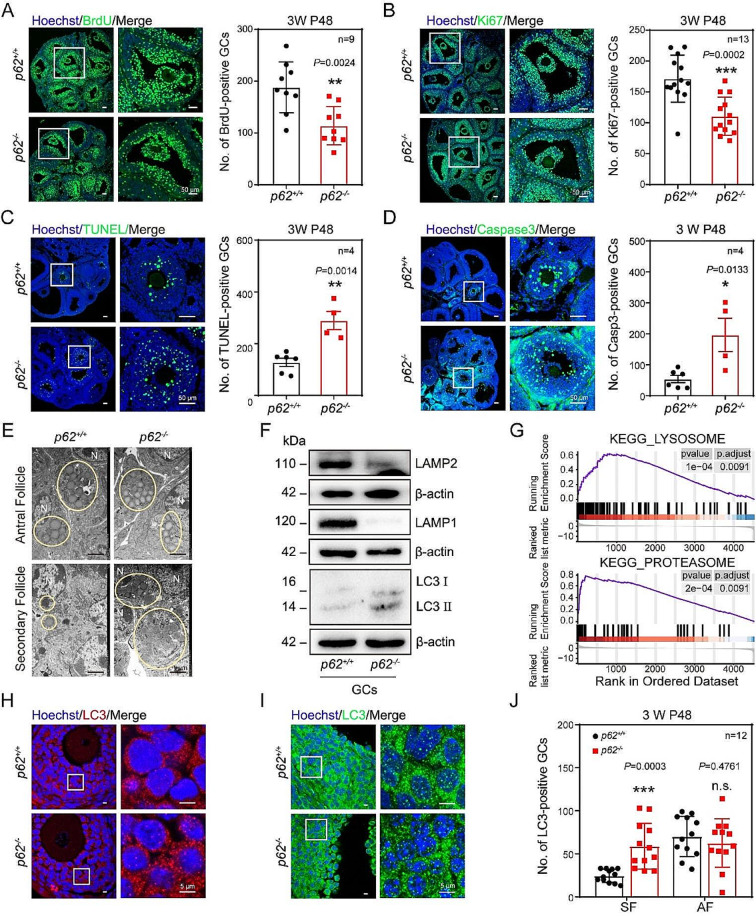
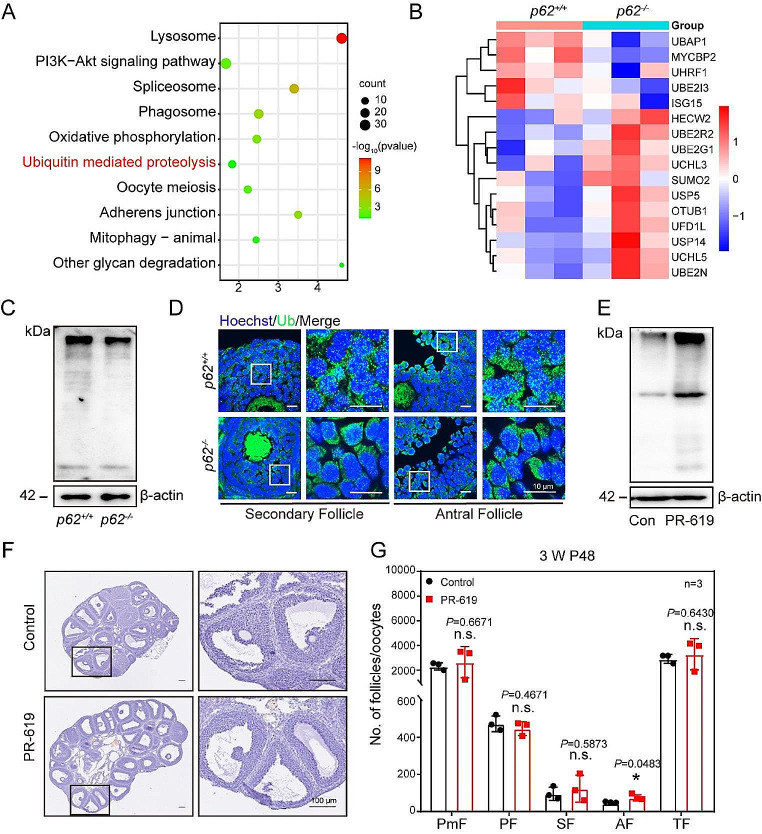
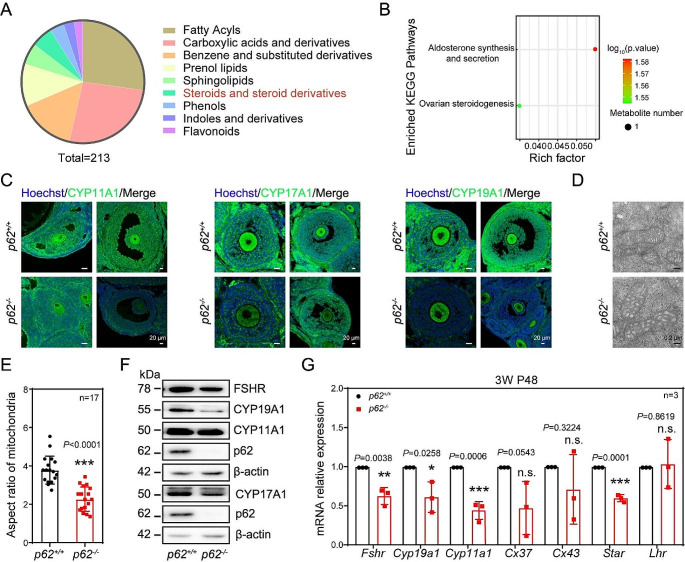
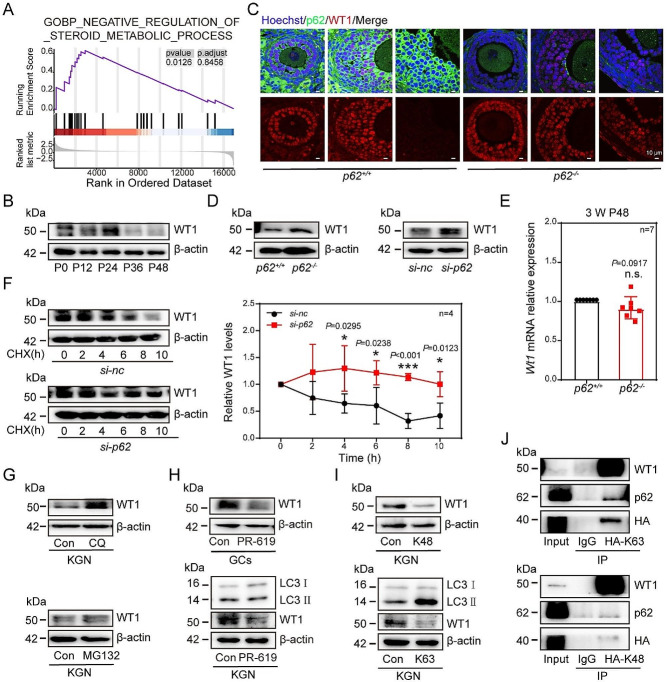
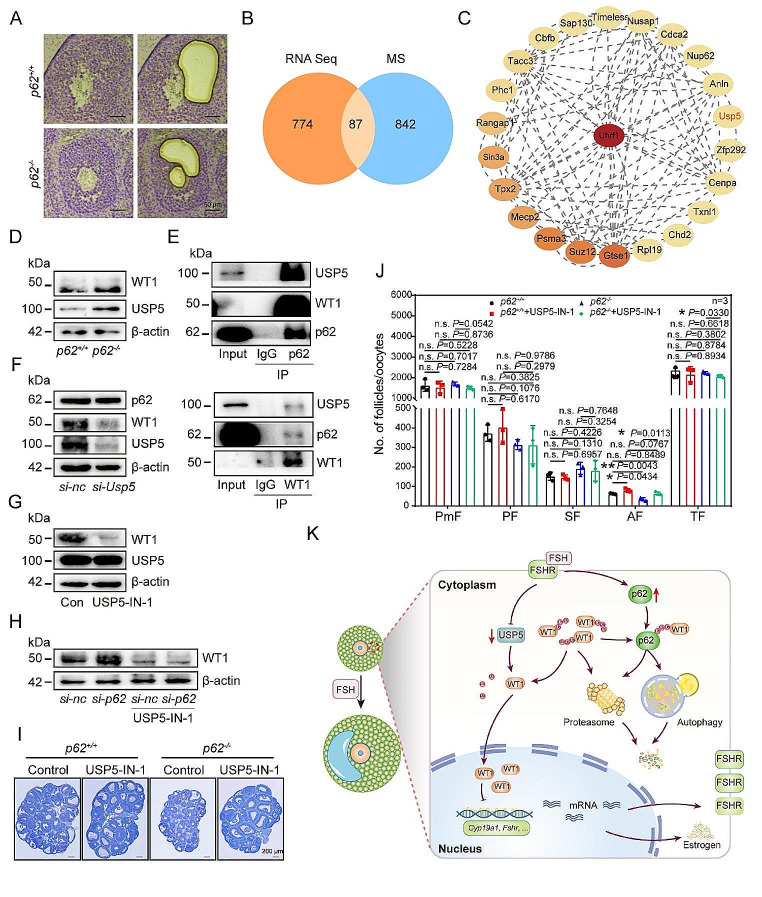
In females, the pathophysiological mechanism of poor ovarian response (POR) is not fully understood. Considering the expression level of p62 was significantly reduced in the granulosa cells (GCs) of POR patients, this study focused on identifying the role of the selective autophagy receptor p62 in conducting the effect of follicle-stimulating hormone (FSH) on antral follicles (AFs) formation in female mice. The results showed that p62 in GCs was FSH responsive and that its level increased to a peak and then decreased time-dependently either in ovaries or in GCs after gonadotropin induction in vivo. GC-specific deletion of p62 resulted in subfertility, a significantly reduced number of AFs and irregular estrous cycles, which were same as pathophysiological symptom of POR. By conducting mass spectrum analysis, we found the ubiquitination of proteins was decreased, and autophagic flux was blocked in GCs. Specifically, the level of nonubiquitinated Wilms tumor 1 homolog (WT1), a transcription factor and negative controller of GC differentiation, increased steadily. Co-IP results showed that p62 deletion increased the level of ubiquitin-specific peptidase 5 (USP5), which blocked the ubiquitination of WT1. Furthermore, a joint analysis of RNA-seq and the spatial transcriptome sequencing data showed the expression of steroid metabolic genes and FSH receptors pivotal for GCs differentiation decreased unanimously. Accordingly, the accumulation of WT1 in GCs deficient of p62 decreased steroid hormone levels and reduced FSH responsiveness, while the availability of p62 in GCs simultaneously ensured the degradation of WT1 through the ubiquitin‒proteasome system and autophagolysosomal system. Therefore, p62 in GCs participates in GC differentiation and AF formation in FSH induction by dynamically controlling the degradation of WT1. The findings of the study contributes to further study the pathology of POR.

Keywords: Antral follicles formation; FSH; Granulosa cell differentiation; Ubiquitinatized WT1; p62.


Conflict of interest statement

The authors have no relevant financial or non-financial interests to disclose.

Figures

Fig. 1
Fig. 1
Low p62 was related to POR in women and p62 in GCs is one of the key downstream proteins in response to FSH. (A) PCR results showed the levels of p62 in the GCs of NC and POR female patients, revealing low p62 in GCs of POR (n = 3). (B) Immunofluorescence staining of p62 (green), DDX4 (red) and Hoechst (blue) in the ovaries of PD35 mice. Scale bar: 50 μm. (C) The three-week-old mice were injected with PMSG. The expression pattern of p62 in the whole ovary and the isolated GCs were determined by western blotting at 0 h, 12 h, 24 h, 36 h and 48 h after induction, respectively (n = 3)
Fig. 2
Fig. 2
p62 in GCs was required to support AF formation. (A) Immunofluorescence staining of the p62 (green), FOXL2 (red) and Hoechst (blue) in three-week-old mouse ovaries 48 h after PMSG treatment. Scale bar: 400 μm. (B) Detection of the estrous cycle in p62+/+ and p62−/− adult mice (n = 3). (C) Breeding test (n = 5). (D) Average litter size of both p62+/+ and p62−/− females (n = 15). (E) Representative histology of ovarian sections from 11-month-old p62−/− females stained with hematoxylin. The boxed regions in the panels are magnified. Scale bar: 100 μm. (F) The number of follicles at different developmental stages were determined for 11-month-old females (n = 7). (G) The ovarian weight to body weight ratio at the time points of P0 (n = 8) and P48 (n = 13), respectively. (H) Hematoxylin-stained ovary sections of P48 mice. The boxed region of each figure was magnified accordingly. Scale bar: 50 μm. (I) Statistics of the numbers of PmFs, PFs, SFs, AFs and TFs in ovaries at P48 (n = 3). (J) The thicknesses of GC layers in follicles of P48 ovaries at all developmental stages were compared based on oocyte diameter (n = 200). (K) Levels of serum E2 after mice were treated with PMSG for 48 h (n = 4). (L) Oocyte morphology after superovulation. Scale bar: 100 μm. (M) Statistical data of L (n = 3). PmF, primordial follicle; PF, primary follicle; SF, secondary follicle; AF, antral follicle; TF: total follicle
Fig. 3
Fig. 3
Knockout of p62 in GCs resulted in decreased cell proliferation, increased apoptosis and blocked autophagic flux. (A) Cell proliferation indicated by BrdU-positive GCs in mice ovaries. Scale bar: 50 μm. BrdU: green; Hoechst: blue. Statistics data in the right (n = 9). (B) Cell proliferation indicated by Ki67-positive GCs in mice ovaries. Scale bar: 50 μm. Ki67: green; Hoechst: blue. Statistics data in the right (n = 13). (C) Cell apoptosis indicated by TUNEL signals in mice ovaries. The apoptosis signals in GCs were upregulated after p62 deletion. Scale bar: 50 μm. TUNEL: green; Hoechst: blue. Statistics data in the right (n = 4). (D) The level of Caspase3 protein in mice ovaries. Increased level of cleaved-caspase3 in ovaries of p62−/− mice indicated the upregulated apoptosis signals. Scale bar: 50 μm. Cleaved-caspase3: green; Hoechst: blue. Statistics data in the right (n = 4). (E) Autophagy vesicles observed under electron microscope. The white circle shows autophagic vesicles. N: nucleus. Scale bar: 1 μm. (F) Protein expression of LC3, LAMP1 and LAMP2 in GCs (n = 3). (G) GSEA analysis of lysosomal pathway and proteasomal pathway. (H, I) LC3 puncta aggregation was observed in GCs of SFs (H) and AFs (I). LC3: red/green, Hoechst: blue. Scale bar: 5 μm. (J) Statistics data of H and I (n = 12). The boxed regions in the left panels were magnified in the figure
Fig. 4
Fig. 4
The level of ubiquitination was reduced in p62 knockout GCs. (A) KEGG enrichment showed significantly altered cellular activity after p62 deletion. (B) Heatmap showed the expression levels of differentially expressed genes related to ubiquitination in GCs. (C) Western blotting for the ubiquitination, and β-actin (internal control) levels in GCs of ovaries (n = 3). (D) Ubiquitination (Ub) in the GCs indicated by immunofluorescence in three-week-old p62+/+ and p62−/− mice ovaries. Ub: green; Hoechst: blue. Scale bars: 10 μm. (E) Western blotting for Ub in KGN of PR-619 and control group. (F) The hematoxylin-stained ovary sections of control and PR-619 mice. The boxed region of each figure was magnified accordingly. Scale bar: 100 μm. (G) Statistics of the numbers of PmFs, PFs, SFs and TFs in ovaries at P0 (n = 3)
Fig. 5
Fig. 5
The cellular differentiation capacity was reduced in p62 knockout GCs. (A) The analysis of metabolomics. (B) Conjoint analysis of RNA-seq and metabolome sequencing data. (C) The protein expression of CYP11A1, CYP17A1 and CYP19A1 in GCs of SFs and AFs was detected by immunofluorescence assays. CYP11A1、CYP17A1、CYP19A1: green; Hoechst: blue. Scale bar: 20 μm. (D) Electron microscope observation of mitochondria in the GCs of either p62+/+ or p62−/− mice. Scale bar: 0.2 μm. (E) The aspect ratio of mitochondria (n = 17). (F) Cell differentiation-related proteins CYP11A1, CYP19A1, and FSHR in GCs. (G) Genes related to GC differentiation after p62 deletion were examined (n = 3)
Fig. 6
Fig. 6
WT1 was greatly upregulated after deletion of p62. (A) Negative regulation of steroid metabolic process pathways by GO_BP analysis. (B) The expression pattern of WT1 protein in the isolated GCs was determined after PMSG induction (n = 3). (C) The expression levels of WT1 in GCs of SFs and AFs examined by immunofluorescence. WT1: red; p62: green; Hoechst: blue. Scale bar: 20 μm. (D) The expression pattern of WT1 protein was upregulated in p62 knockout GCs and p62 knockdown KGN cells (n = 3). (E) The mRNA of Wt1 in GCs of p62+/+ and p62−/− mice (n = 7). (F) Knockdown of p62 blocked the degradation of WT1. CHX, cycloheximide, 10 µg/mL. (G) The protein levels of WT1 in KGN cells after CQ or MG132 treatments, respectively (n = 3). (H) Western blotting for WT1 in KGN and GCs of control and PR-619 group (n = 3). (I) The protein levels of WT1 in KGN cells after PCMV-HA-hub K48R or PCMV-HA-hub K63R treatments, respectively (n = 3). (J) The co-IP results after KGN cells were treated with PCMV-HA-hub K48R or PCMV-HA-hub K63R plasmid
Fig. 7
Fig. 7
Available USP5 upregulated the expression of WT1 in the GCs of p62 knockout mice. (A) A schematic of the laser capture microdissection procedure of GCs. After removing the oocyte, the GCs of each SF were cut and collected for analysis. Scale bars: 50 μm. (B) Overlap between mass spectrometry genes and transcriptome sequencing genes. (C) PPI analysis was performed on 87 coincident genes in B. The top 23 genes were selected for mapping. (D) Protein levels of WT1 and USP5 in GCs of p62+/+ and p62−/− mice. (E) The protein interactions between p62 and WT1 or USP5 were demonstrated. (F and G) Protein level of USP5 and WT1 after KGN cells were treated by si-Usp5 (F) or USP5-IN-1 (G), respectively (n = 3). (H) Protein level of USP5 and WT1 after si-p62 plus simultaneous USP5-IN-1 and FSH treatments for 48 h (n = 3). (I) Statistics data of the number of follicles in ovaries after treatments (n = 3). (J) Representative structure of ovaries after USP5-IN-1 treatments in vivo. Scale bar: 200 μm. (K) Proposed model for the role of p62 in regulating ovarian GC differentiation

Similar articles

Cited by

References

    1. Ferraretti AP, La Marca A, Fauser BC, Tarlatzis B, Nargund G, Gianaroli L. ESHRE consensus on the definition of ‘poor response’ to ovarian stimulation for in vitro fertilization: the Bologna criteria. Hum Reprod. 2011;26:1616–1624. doi: 10.1093/humrep/der092. - DOI - PubMed
    1. Lebovitz O, Haas J, Mor N, Zilberberg E, Aizer A, Kirshenbaum M, Orvieto R, Nahum R. Predicting IVF outcome in poor ovarian responders. BMC Womens Health. 2022;22:395. doi: 10.1186/s12905-022-01964-y. - DOI - PMC - PubMed
    1. Roque M, Haahr T, Esteves SC, Humaidan P. The POSEIDON stratification - moving from poor ovarian response to low prognosis. JBRA Assist Reprod. 2021;25:282–292. doi: 10.5935/1518-0557.20200100. - DOI - PMC - PubMed
    1. Pu D, Wu J, Liu J. Comparisons of GnRH antagonist versus GnRH agonist protocol in poor ovarian responders undergoing IVF. Hum Reprod. 2011;26:2742–2749. doi: 10.1093/humrep/der240. - DOI - PubMed
    1. Gong Y, Zhang K, Xiong D, Wei J, Tan H, Qin S. Growth hormone alleviates oxidative stress and improves the IVF outcomes of poor ovarian responders: a randomized controlled trial. Reprod Biol Endocrinol. 2020;18:91. doi: 10.1186/s12958-020-00648-2. - DOI - PMC - PubMed

MeSH terms

Substances

LinkOut - more resources