. 2024 May 3:14:1389634.
doi: 10.3389/fonc.2024.1389634. eCollection 2024.

Persistent gene expression and DNA methylation alterations linked to carcinogenic effects of dichloroacetic acid

Affiliations

Persistent gene expression and DNA methylation alterations linked to carcinogenic effects of dichloroacetic acid

Gleta Carswell et al. Front Oncol. .

Abstract

Background: Mechanistic understanding of transient exposures that lead to adverse health outcomes will enhance our ability to recognize biological signatures of disease. Here, we measured the transcriptomic and epigenomic alterations due to exposure to the metabolic reprogramming agent, dichloroacetic acid (DCA). Previously, we showed that exposure to DCA increased liver tumor incidence in B6C3F1 mice after continuous or early life exposures significantly over background level.

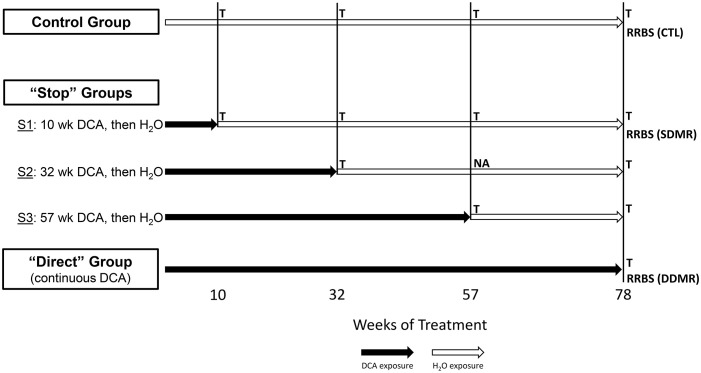
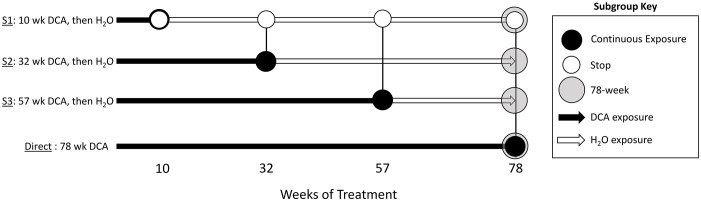
Methods: Using archived formalin-fixed liver samples, we utilized modern methodologies to measure gene expression and DNA methylation levels to link to previously generated phenotypic measures. Gene expression was measured by targeted RNA sequencing (TempO-seq 1500+ toxicity panel: 2754 total genes) in liver samples collected from 10-, 32-, 57-, and 78-week old mice exposed to deionized water (controls), 3.5 g/L DCA continuously in drinking water ("Direct" group), or DCA for 10-, 32-, or 57-weeks followed by deionized water until sample collection ("Stop" groups). Genome-scaled alterations in DNA methylation were measured by Reduced Representation Bisulfite Sequencing (RRBS) in 78-week liver samples for control, Direct, 10-week Stop DCA exposed mice.

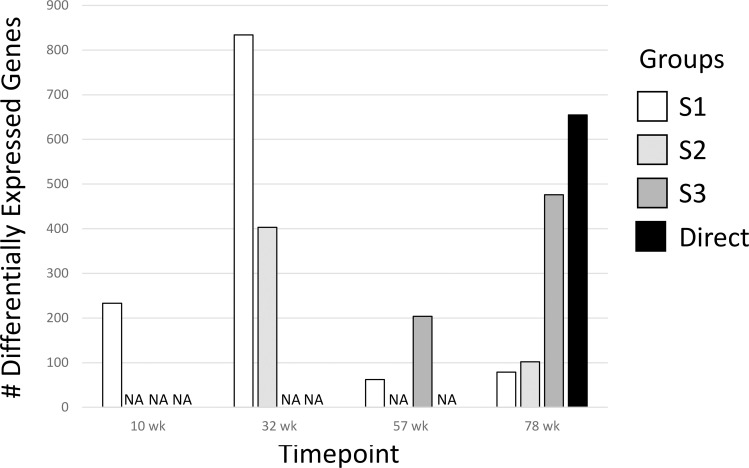
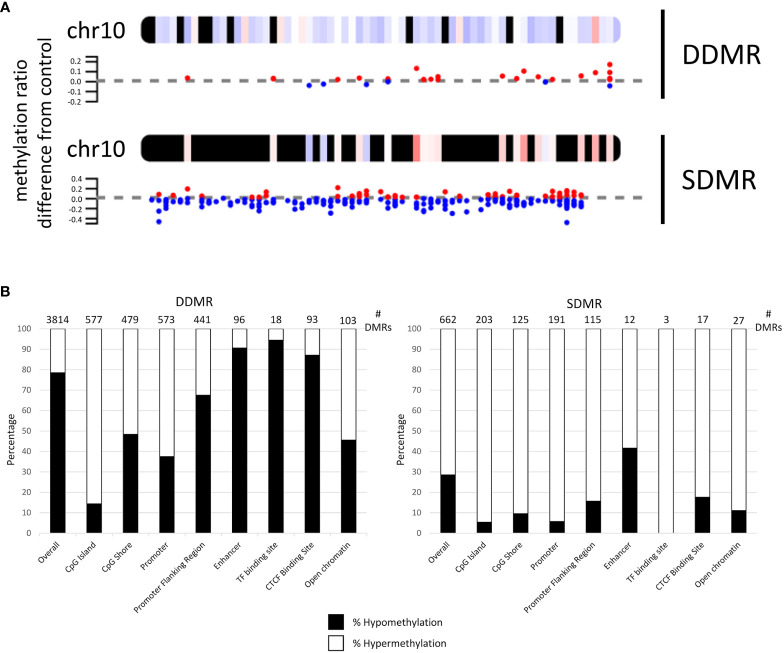
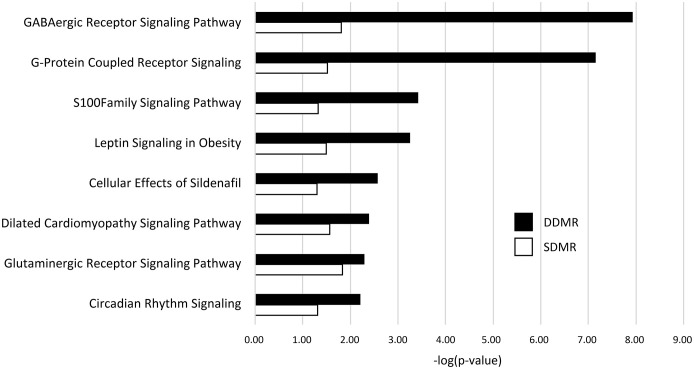
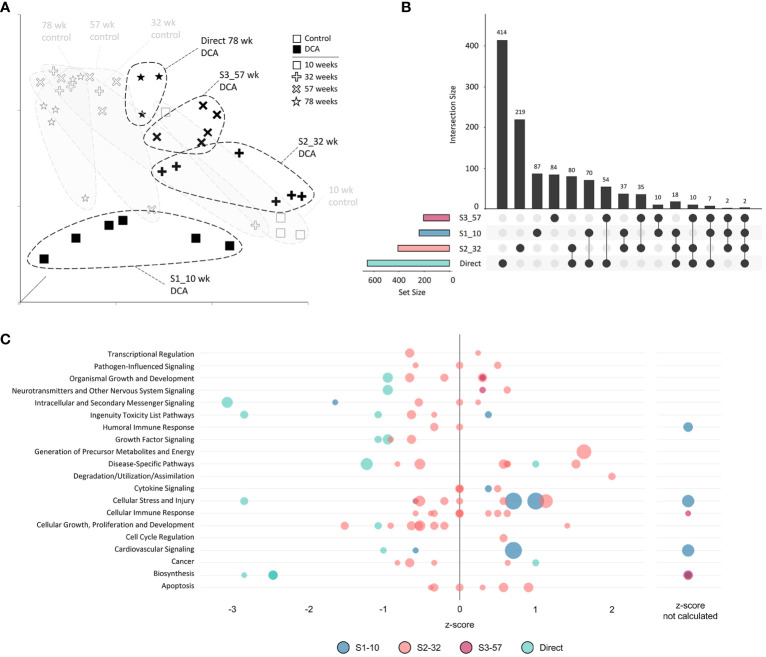
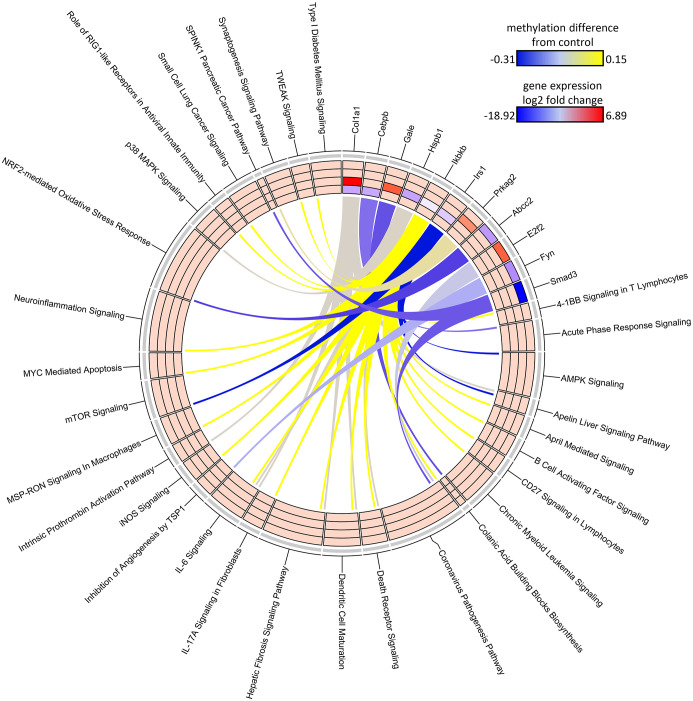
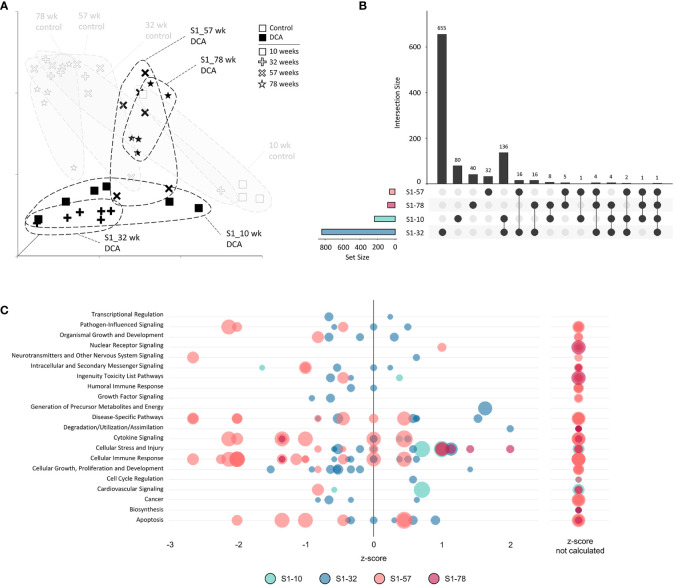
Results: Transcriptomic changes were most robust with concurrent or adjacent timepoints after exposure was withdrawn. We observed a similar pattern with DNA methylation alterations where we noted attenuated differentially methylated regions (DMRs) in the 10-week Stop DCA exposure groups compared to the Direct group at 78-weeks. Gene pathway analysis indicated cellular effects linked to increased oxidative metabolism, a primary mechanism of action for DCA, closer to exposure windows especially early in life. Conversely, many gene signatures and pathways reversed patterns later in life and reflected more pro-tumorigenic patterns for both current and prior DCA exposures. DNA methylation patterns correlated to early gene pathway perturbations, such as cellular signaling, regulation and metabolism, suggesting persistence in the epigenome and possible regulatory effects.

Conclusion: Liver metabolic reprogramming effects of DCA interacted with normal age mechanisms, increasing tumor burden with both continuous and prior DCA exposure in the male B6C3F1 rodent model.

Keywords: DNA methylation (5mC); age; dichloro acetic acid; liver; mouse model; transcriptomics (RNA sequencing); tumorigenesis.


Conflict of interest statement

The authors declare that the research was conducted in the absence of any commercial or financial relationships that could be construed as a potential conflict of interest.

Figures

Figure 1
Figure 1
Study groups and sample overview. The stop-treatment mouse study design consisted of samples from four time courses of DCA exposure. The control group was given drinking water ad libitum, whereas mice in the “Stop” groups “S1”, “S2”, and “S3” had 3.5g/L DCA added for 10, 32, and 57 weeks, respectively. The “Direct” group was given DCA in drinking water for the length of the study (78 weeks). Liver gene expression was measured at each of these time points with the exception of “S2_57” weeks, where archived samples were not available (NA). The 1500+ TempO-seq assay was used to measure gene expression in FFPE samples indicated as “T”. Differentially Methylated Regions (DMRs) were determined by Reduced Representation Bisulfite Sequencing (RRBS) at the 78-week time point for the control (CTL), “S1” Stop group (SDMR) and the Direct group (DDMR) using frozen liver tissue.
Figure 2
Figure 2
Differentially Expressed Genes (DEGs) for all groups. The 1500+ TempO-seq gene expression assay was used to determine differentially expressed genes compared to time-matched controls. DEGs were determined from 3-6 mice using a False Discovery Rate (FDR)-adjusted p-value of ≤0.05. All experimental groups were represented (see Figure 1 ), with the exception of S2-57 weeks, where samples were missing from the archive (NA, not available).
Figure 3
Figure 3
Mapping of differentially methylated regions for Direct (DDMR) and Stop (SDMR) 78-week measures. (A) Representative mapping DMRs for Chromosome 10. Red and blue dots represent hyper- and hypomethylated regions, respectively, as defined by calculations provided in Methods. Averaged intervals of hyper- or hypomethylation are represented by a gradient scale of red-to-blue, respectively, on the chromosome map. Y-axis represents the ratio of methylation differentiation compared to control. All chromosomal maps can be seen in Supplementary Figure 2 . (B) DMR intersection with identified CpG and regulatory features in the mouse genome. Bar graphs represent the percentage of hyper- and hypo-methylated regions in different CpG and regulatory regions that are identified by Ensembl Regulatory Build (release 90; http://useast.ensembl.org/info/genome/funcgen/process/humanandmouse/annotation.html).
Figure 4
Figure 4
DMR-linked genes enrichment of canonical gene pathways. Genes linked to DMRs in both the Direct (DDMR) and Stop (SDMR) groups by mapping to the nearest Transcriptional Start Site (TSS). All gene pathways that were enriched in both groups are graphed. Enrichment was considered significant if Fisher’s Exact test -log (p-value) was greater than 1.3.
Figure 5
Figure 5
Overview of subgrouping of study timepoints. We defined the “Continuous Exposure” subgroup as samples from mice that were continuously exposed to DCA (S1-10, S2-32, S3-57, and Direct-78; black-filled dots. The “Stop” subgroup consisted of samples collected from mice exposed to 10 weeks of DCA only at all collected timepoints (the S1 group progression: S1-10, S1-32, S1-57, and S1-78; white dots). The “78-week” subgroup consisted of all the samples collected at 78 weeks (S1-78, S2-78, S3-78, and Direct-78; grey-filled dots).
Figure 6
Figure 6
Continuous exposure subgroup differentially expressed genes and enriched canonical gene pathways. (A) Uniform Manifold Approximation and Projection (UMAP) for the “Continuous Exposure” subgroup samples. UMAP is based on 15 Principal Components of normalized count data before DEG determination, which captured over 99% of the variation displayed in these samples. (B) UpSet plot demonstrating differences and similarities of significantly (FDR-corrected p-value<0.05) altered genes compared to time-matched controls. Connected dots identify the group(s) that match to the adjacent bar and DEG number unique for those samples. (C) Bubble graph representing gene expression pathways enriched by the “Continuous Exposure” subgroup. Each bubble represents an individual canonical pathway, calculated by Ingenuity Pathway Analysis (IPA), that are categorized by larger meta-categories along the y-axis. The right-to-left placement identifies predicted pathway activation or repression (positive or negative z-score, respectively). Some pathways did not have the data to generate this prediction (no z-score). The size represents the -log(p-value) of the pathway enrichment. The color indicates the experimental mouse group that the pathway enrichment was measured.
Figure 7
Figure 7
Circos plot of DDMR genes linked to “direct” group gene pathways. Connections denote DDMR-linked genes with canonical gene pathways that are enriched by DEGs identified in the Direct groups. Color gradient of connections denote degree of methylation change compared to control mice (yellow = hypermethylated, purple = hypomethylated). Tracks denote log2 fold-change (red = upregulation, blue = downregulation) of gene expression compared to time-matched controls for S1 10-week, S2 32-week, S3 57-week and Direct 78-week sample groups (inside -> outside). Slice size for individual pathways is proportional to number of DEGs that link to each individual pathway.
Figure 8
Figure 8
Stop subgroup differentially expressed genes and enriched canonical gene pathways. (A) Uniform Manifold Approximation and Projection (UMAP) for the “Stop” subgroup samples. UMAP is based on 15 Principal Components of normalized count data before DEG determination, which captured over 99% of the variation displayed in these samples. (B) UpSet plot demonstrating differences and similarities of significantly (FDR-corrected p-value<0.05) altered genes compared to time-matched controls. Dots identify the group(s) that match to the adjacent bar and DEG number unique for those samples. (C) Bubble graph representing gene expression pathways enriched by the “Stop” subgroup. Each bubble represents an individual canonical pathway, calculated by Ingenuity Pathway Analysis (IPA), that are categorized by larger meta-categories along the y-axis. The right-to-left placement identifies predicted pathway activation or repression (positive or negative z-score, respectively). Some pathways did not have the data to generate this prediction (no z-score). The size represents the -log(p-value) of the pathway enrichment. The color indicates the experimental mouse group that the pathway enrichment was measured.
Figure 9
Figure 9
Circos plot of SDMR genes linked to “stop” subgroup gene pathways. Connections denote SDMR-linked genes with canonical gene pathways that are enriched by DEGs identified in the S1 groups. Color gradient of connections denote degree of methylation change compared to control mice (yellow = hypermethylated, purple = hypomethylated). Tracks denote log2 fold-change (red = upregulation, blue = downregulation) of gene expression compared to time-matched controls for S1 10-week, S1 32-week, S1 57-week and S1 78-week experimental groups (inside -> outside). Slice size for individual pathways is proportional to number of DEGs that link to each individual pathway.
Figure 10
Figure 10
78-week subgroup differentially expressed genes and enriched canonical gene pathways. (A) Uniform Manifold Approximation and Projection (UMAP) for “78-week” subgroup samples. UMAP is based on 15 Principal Components of normalized count data before DEG determination, which captured over 99% of the variation displayed in these samples. (B) UpSet plot demonstrating differences and similarities of significantly (FDR-corrected p-value<0.05) altered genes compared to time-matched controls. Dots identify the group(s) that match to the adjacent bar and DEG number unique for those samples. (C) Bubble graph representing gene expression pathways enriched by the “78-week” subroup. Each bubble represents an individual canonical pathway, calculated by Ingenuity Pathway Analysis (IPA), that are categorized by larger meta-categories along the y-axis. The right-to-left placement identifies predicted pathway activation or repression (positive or negative z-score, respectively). Some pathways did not have the data to generate this prediction (no z-score). The size represents the -log(p-value) of the pathway enrichment. The color indicates the experimental mouse group that the pathway enrichment was measured.

Similar articles

References

    1. EPA . Guidelines for Carcinogen Risk Assessment. Risk Assessment Forum, Washington, D.C: (2005). Available at: https://www.epa.gov/sites/default/files/2013-09/documents/cancer_guideli... (25 April 2024, date last accessed).
    1. Barton HA, Cogliano VJ, Flowers L, Valcovic L, Setzer RW, Woodruff TJ. Assessing susceptibility from early-life exposure to carcinogens. Environ Health Perspect. (2005) 113:1125–33. doi: 10.1289/ehp.7667 - DOI - PMC - PubMed
    1. Birnbaum LS, Fenton SE. Cancer and developmental exposure to endocrine disruptors. Environ Health Perspect. (2003) 111:389–94. doi: 10.1289/ehp.5686 - DOI - PMC - PubMed
    1. Hoover RN, Hyer M, Pfeiffer RM, Adam E, Bond B, Cheville AL, et al. . Adverse health outcomes in women exposed in utero to diethylstilbestrol. N Engl J Med. (2011) 365:1304–14. doi: 10.1056/NEJMoa1013961 - DOI - PubMed
    1. Weinhouse C, Anderson OS, Bergin IL, Vandenbergh DJ, Gyekis JP, Dingman MA, et al. . Dose-dependent incidence of hepatic tumors in adult mice following perinatal exposure to bisphenol A. Environ Health Perspect. (2014) 122:485–91. doi: 10.1289/ehp.1307449 - DOI - PMC - PubMed