. 2024 Apr;11(2):024308.
doi: 10.1117/1.NPh.11.2.024308. Epub 2024 May 17.

Modulation of neuronal dynamics by sustained and activity-dependent continuous-wave near-infrared laser stimulation

Affiliations

Modulation of neuronal dynamics by sustained and activity-dependent continuous-wave near-infrared laser stimulation

Alicia Garrido-Peña et al. Neurophotonics. 2024 Apr.

Abstract

Significance: Near-infrared laser illumination is a non-invasive alternative/complement to classical stimulation methods in neuroscience but the mechanisms underlying its action on neuronal dynamics remain unclear. Most studies deal with high-frequency pulsed protocols and stationary characterizations disregarding the dynamic modulatory effect of sustained and activity-dependent stimulation. The understanding of such modulation and its widespread dissemination can help to develop specific interventions for research applications and treatments for neural disorders.

Aim: We quantified the effect of continuous-wave near-infrared (CW-NIR) laser illumination on single neuron dynamics using sustained stimulation and an open-source activity-dependent protocol to identify the biophysical mechanisms underlying this modulation and its time course.

Approach: We characterized the effect by simultaneously performing long intracellular recordings of membrane potential while delivering sustained and closed-loop CW-NIR laser stimulation. We used waveform metrics and conductance-based models to assess the role of specific biophysical candidates on the modulation.

Results: We show that CW-NIR sustained illumination asymmetrically accelerates action potential dynamics and the spiking rate on single neurons, while closed-loop stimulation unveils its action at different phases of the neuron dynamics. Our model study points out the action of CW-NIR on specific ionic-channels and the key role of temperature on channel properties to explain the modulatory effect.

Conclusions: Both sustained and activity-dependent CW-NIR stimulation effectively modulate neuronal dynamics by a combination of biophysical mechanisms. Our open-source protocols can help to disseminate this non-invasive optical stimulation in novel research and clinical applications.

Keywords: activity-dependent optical stimulation; computational models; continuous-wave NIR laser neurotechnology; ionic channel dynamics; neuronal excitability; open-source techniques.


Figures

Fig. 1
Fig. 1
(a) Illustration of the laser beam focused on a neuron in the right parietal ganglia at maximum power showing a sharpened form due to the angle. (b) Representation of waveform shape’s metrics: (i) Spike duration at half width. (ii) Spike amplitude between the maximum and minimum voltage values. (iii) Depolarization slope at half width. (iv) Repolarization slope at half width. (c) Open-pipette temperature estimation method. Each row in the panel represents pulsed and continuous current delivery for the estimation, respectively. For both examples: left column, temperature and voltage relation. Right column filtered mean of voltage recordings from short illumination intervals in the pipette. (d) Simulation of the CGC-model representing the voltage dynamics during an action potential and the corresponding ionic currents defined in the model (INaP, INaT, IA, ID, ILVA, IHVA). The units in the y axis are specified in the legend. (e) Activity-dependent protocol scheme. Neurons were recorded intracellularly and their voltage signals were processed in real-time with the RTXI software. Using the spike prediction algorithms, the shutter was triggered at the desired action potential phase illuminating the neurons. (f) Examples of illumination offset, defined as the time interval from the end of the illumination to the peak of the spike.
Fig. 2
Fig. 2
Effect of sustained CW-NIR laser stimulation on the spike waveform for two distinct neuron types. For all panels: control, laser, and recovery are color-coded in blue, red, and green, respectively. (a) Characterization of no shoulder-shaped-type neuron. (b) Characterization of shoulder-shaped-type neuron. (ai) and (bi) Superimposition of spike waveforms in a recording corresponding to a symmetrical and shoulder spike neuron, respectively. The spikes were aligned to the peak for the x axis and to the onset for the y axis, the mean is depicted in darker colors. (aii) and (bii) Bar charts quantify the change using the difference from laser to control normalized by the mean control value for metrics: duration, depolarization, and repolarization slopes, and amplitude. (c) Violin plots representing the variation of the experiments with respect to the control (N=23) for shoulder and symmetrical types together. For each metric of the waveform, the control, laser, and recovery recordings are normalized to the first control. From left to right: duration, depolarization slope, repolarization slope, and amplitude. Asterisks over the violins indicate that the metric change was highly significant [Bonferroni correction, (ρ<0.01/4), see Sec. 2.7].
Fig. 3
Fig. 3
Firing rate and ISIs analysis for the CW-NIR laser stimulation. (a) AFR in all experiments (N=23). (b) AFR for cases from the experiments in (a) with no change during laser illumination (N=11); (c) AFR for experiments from (a) showing an increase in the firing rate (N=12); (d) ISI histograms for control, laser, and recovery for each experiment (blue, red and green, respectively). Cases showing increased excitation in their firing rate (sample in c) when illuminated by the CW-NIR laser are highlighted in a red square.
Fig. 4
Fig. 4
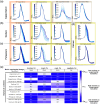
Modeling study of the CW-NIR laser stimulation effects due to isolated biophysical changes that alter the spike waveform. (a)–(d) Superposition of spike waveforms in each model by modulating a single biophysical candidate. The background colors correspond to each simulated model. In (a), the capacitance is changed for the HH and CGC neuron models, and in the two compartments for the N3t neuron model. (b) The spike waveforms changing the conductances of Na channel currents: INa from the HH-model, INaP and INaT, from the CGC-model. (c) The modulation of K conductances in ionic currents: IK in the HH-model and ID and IA for the CGC-model (from left to right). (d) The modification of the calcium current conductances in the CGC-model (IHVA and ILVA). Table in (e) represents the quantification of the changes in the spike metrics when tuning each parameter for every model. Each cell contains the waveform change normalized to the maximum. The color gradient represents similarity based on the standard deviation of the normalized experimental change. Dark purple corresponds to low similarity (2σMEC or larger) and white to high similarity. The quantified experimental reference (MEC) is annotated in the first row of the table.
Fig. 5
Fig. 5
Waveform change in the CGC-model due to ΔT temperature variation. (ai) The spike waveform superposition for distinct ΔT values. Spikes are aligned to the initial value of each waveform. (aii) The normalized change in the waveform is depicted for all metrics (duration, depolarization, and repolarization slopes and amplitude). (b) The change in response to temperature variation from 1°C to 10°C (Q10=3) in the normalized metrics.
Fig. 6
Fig. 6
Study of the laser effect at different stages of the spike waveform with an activity-dependent stimulation protocol. The panels quantify the change induced by the laser stimulation at distinct illumination offsets, time intervals from the end of the illumination to the peak of the spike. Top panel shows a spike waveform from the experiment as a time reference for the offset—time 0 corresponds to the spike peak. Boxplots represent the difference of each metric with respect to the control. All illumination intervals, pictured in the blue boxes, had the same duration of 58 ms, and spikes were grouped by the illumination offset. Recovery and continuous laser reference are also shown in green and red boxes at the left and right in the figure, respectively. The spike metrics selected here were duration, depolarization, and repolarization slopes, second, third, and fourth rows, respectively.
Fig. 7
Fig. 7
Normalized change for grouped values of spike duration, depolarization, and repolarization slopes at distinct illumination offsets in the activity-dependent stimulation protocol. Each value in each group was normalized to the mean of its corresponding day controls as a minimum value and the mean of the continuous laser recordings for each day as the maximum value. The maximum value for each metric is marked by a black circle.

References

    1. Cogan S. F., “Neural stimulation and recording electrodes,” Annu. Rev. Biomed. Eng. 10(1), 275–309 (2008).ARBEF710.1146/annurev.bioeng.10.061807.160518 - DOI - PubMed
    1. Chamorro P., et al. , “Generalization of the dynamic clamp concept in neurophysiology and behavior,” PLoS One 7, e40887 (2012).POLNCL10.1371/journal.pone.0040887 - DOI - PMC - PubMed
    1. Carter M., Shieh J. C., Guide to Research Techniques in Neuroscience, Academic Press; (2015).
    1. Bickle J., “Revolutions in neuroscience: tool development,” Front. Syst. Neurosci. 10, 24 (2016).10.3389/fnsys.2016.00024 - DOI - PMC - PubMed
    1. Lecoq J., Orlova N., Grewe B. F., “Wide, fast, deep: recent advances in multiphoton microscopy of in vivo neuronal activity,” J. Neurosci. 39(46), 9042–9052 (2019).JNRSDS10.1523/JNEUROSCI.1527-18.2019 - DOI - PMC - PubMed