. 2024 May 3;10(9):e30702.
doi: 10.1016/j.heliyon.2024.e30702. eCollection 2024 May 15.

Overexpression of RBM15 modulated the effect of trophoblast cells by promoting the binding ability between YTHDF2 and the CD82 3'UTR to decrease the expression of CD82

Affiliations

Overexpression of RBM15 modulated the effect of trophoblast cells by promoting the binding ability between YTHDF2 and the CD82 3'UTR to decrease the expression of CD82

Guangning You et al. Heliyon. .

Abstract

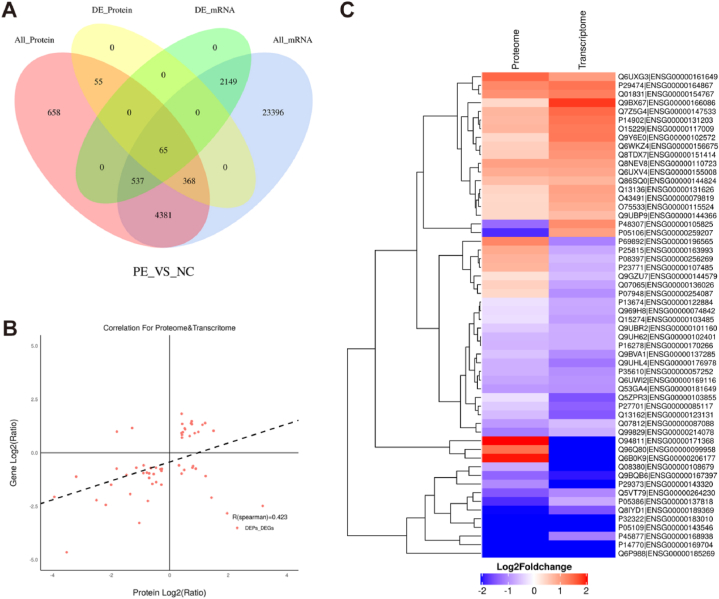
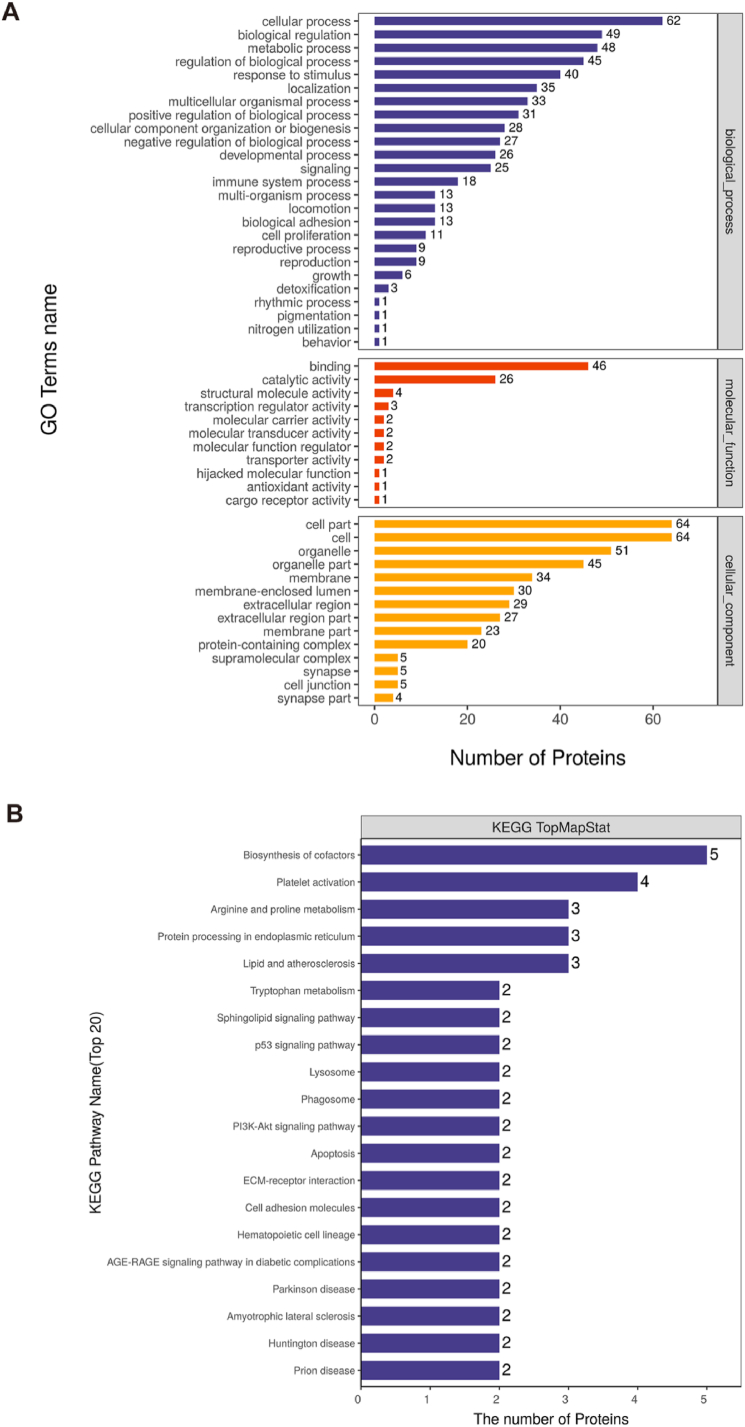
Background: Pre-eclampsia (PE) is a syndrome with no specific pathological mechanism and is specific to pregnancy. The combined analysis of proteomics and transcriptomics possesses many benefits for treating this disease. m6A modification plays a major role in PE; however, mechanism have not been studied clearly. This study investigated the potential mechanism underlying the role of m6A in PE.

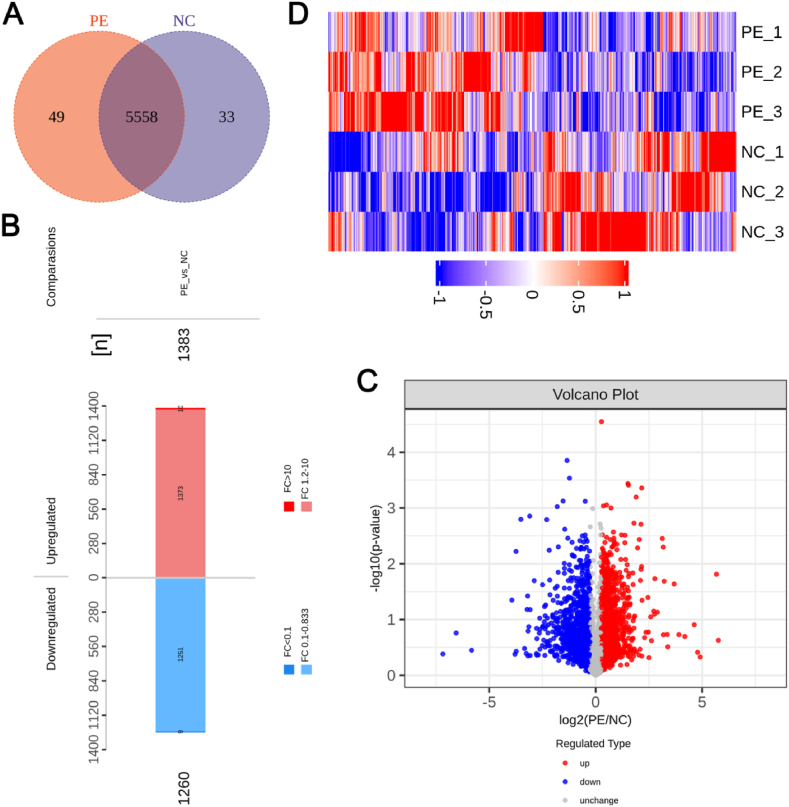
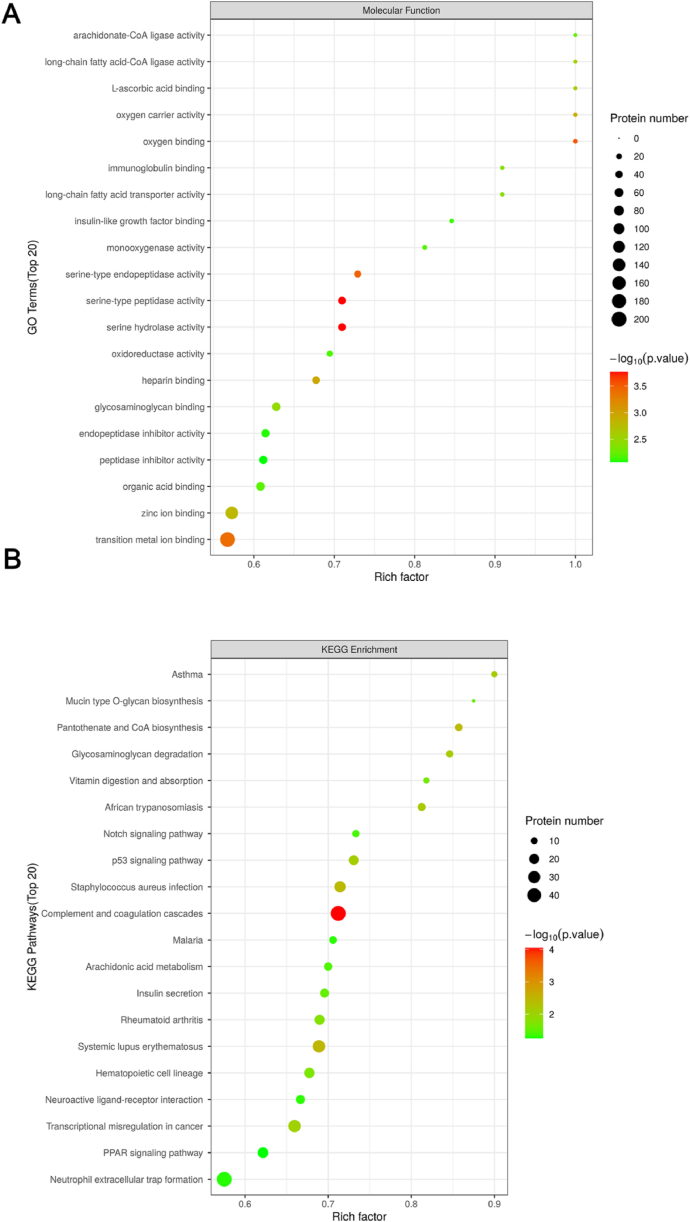
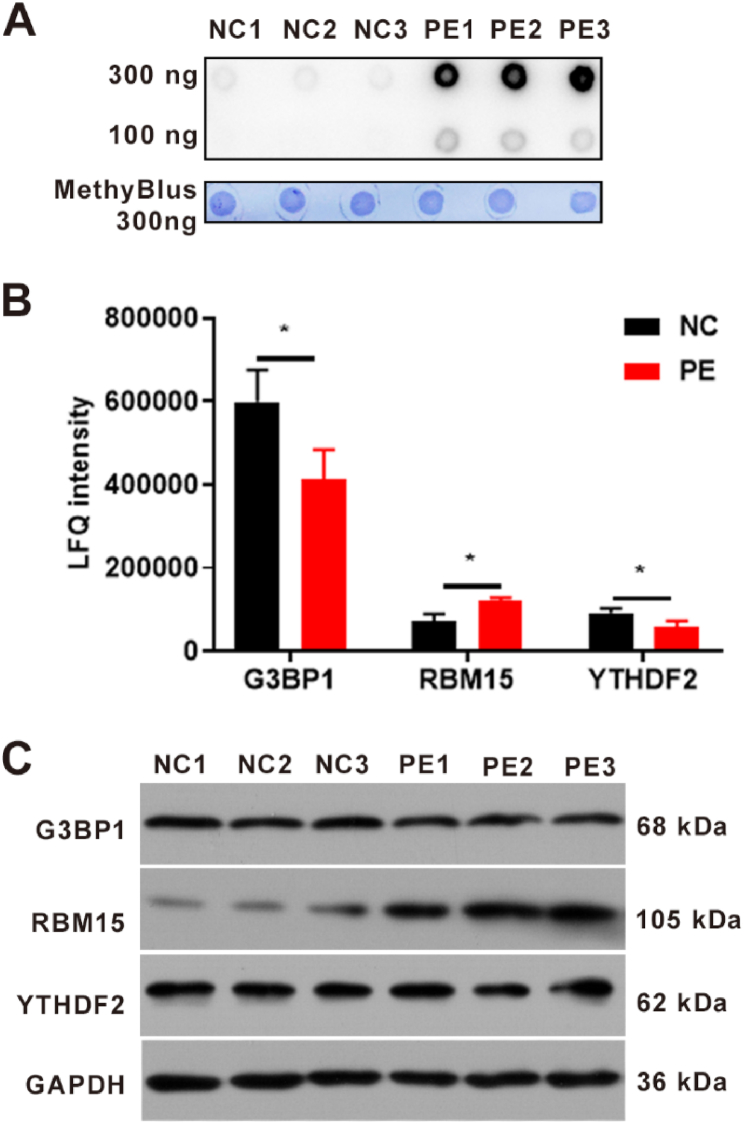
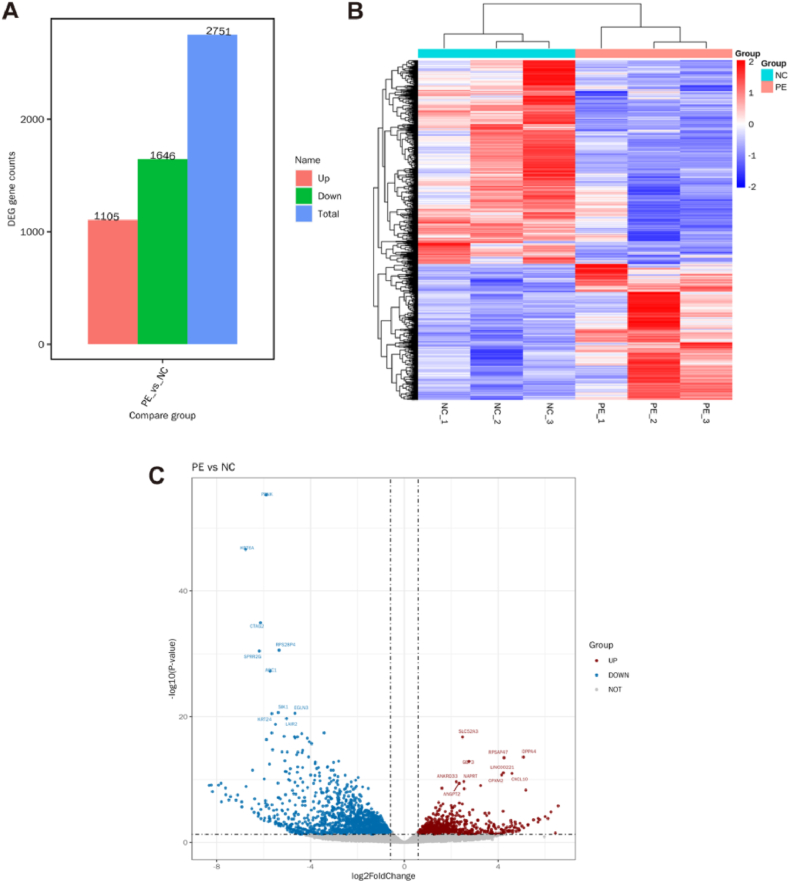
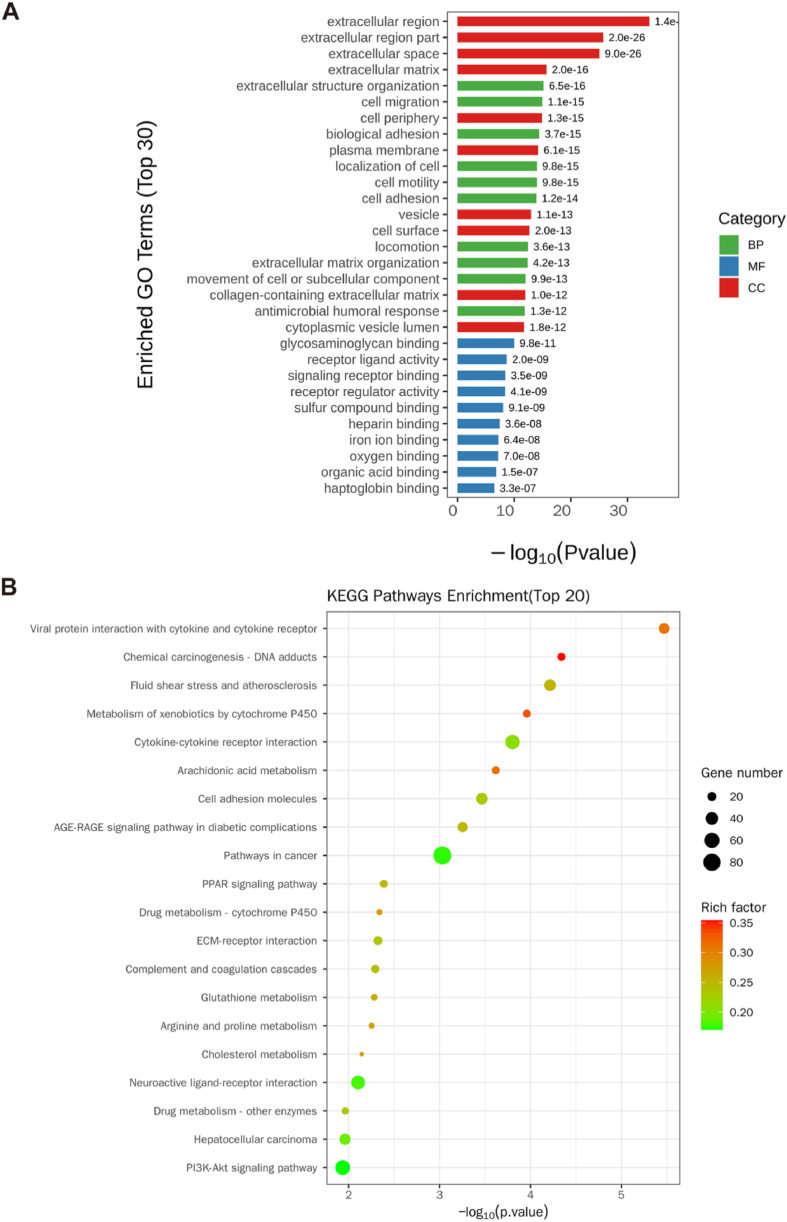
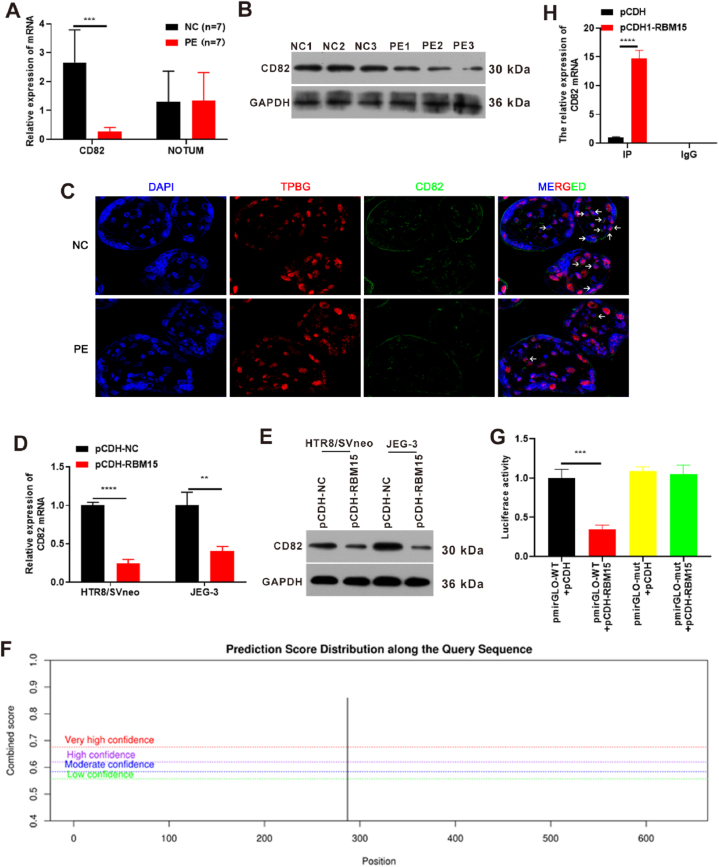
Methods: Mass spectrometry-based label-free quantitative proteomics and transcriptomics experiments were conducted on the placenta of patients with pre-eclampsia and normal pregnancies, and the two omics were followed by joint analysis. Total m6A modification in placental tissues, HTR8/SVneo cells, and JEG-3 cells was measured by dot blot. The levels of RBM15 and CD82 in tissues and cells were detected using qPCR. The protein levels of G3BP1, RBM15, MMP-2, YTHDF2, and MMP-9 were measured by western blotting. The function, migration, and invasion characteristics of HTR8/SVneo and JEG-3 cells were measured using Transwell assays. SRAMP predicted the m6A modification site in the CD82 mRNA 3'UTR, and this was confirmed using luciferase activity and YTHDF2-RIP.

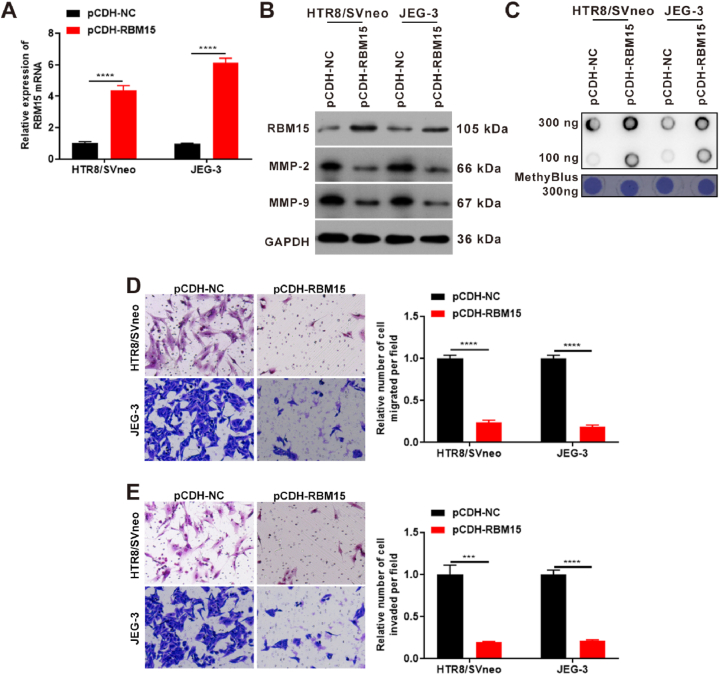
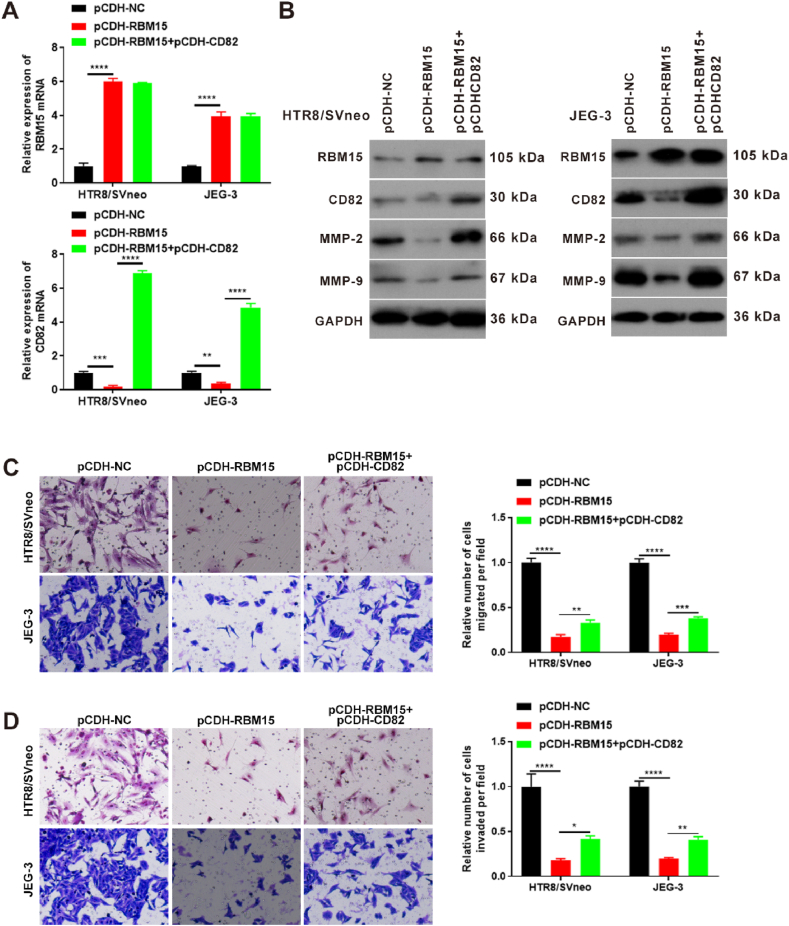
Results: m6A modification was promoted in the PE group, and the RBM15 abundance was increased. Overexpression of RBM15 increased m6A modification. However, overexpression of RBM15 suppressed the expression of MMP-2 and MMP-9 and also the migratory and invasive capabilities of HTR8/SVneo and JEG-3 cells. CD82 expression levels were decreased in PE, and CD82 expression was confirmed via qPCR, western blotting and immunofluorescence. Furthermore, RBM15 overexpression reduced CD82 mRNA and protein levels. Luciferase activity and YTHDF2-RIP results verified that overexpression of RBM15 promoted the binding ability between YTHDF2 and the CD82 3'UTR, thereby decreasing CD82 expression. Finally, CD82 overexpression reversed the effect of RBM15 overexpression on the expression of MMP-2 and MMP-9 and on the migratory and invasive capabilities of the cells.

Conclusions: Overexpression of RBM15 hindered the migratory and invasive capabilities of trophoblasts, while concurrently enhancing m6A modification. The potential mechanism was that overexpression of RBM15 promoted the binding capability between YTHDF2 and CD82 3'UTR and decrease the expression of CD82. Thus, this study provides a theoretical basis for the treatment of PE.


Conflict of interest statement

The authors declare that they have no known competing financial interests or personal relationships that could have appeared to influence the work reported in this paper.

Figures

Fig. 1
Fig. 1
Proteins detected by MSLQP in pre-eclampsia and normal pregnancy placenta. (A) A Venn diagram was used to analyse the number of proteins detected in pre-eclampsia and normal pregnancy placenta. N (biological replicates) = 3 each group. (B) The number of significantly differential proteins between pre-eclampsia and normal pregnancy placenta. Red indicates the up-regulated proteins, and blue indicates the down-regulated proteins. (C) A Volcano plot was used to analyse the proteins detected in the placenta from pre-eclampsia and normal pregnancy. Blue indicated the down-regulated proteins, grey indicated the proteins with no difference in expression between the two groups, and red indicated the up-regulated proteins. (D) A heat map was used to identify significantly differentially expressed proteins between pre-eclampsia and normal pregnancy placenta. Red indicates the up-regulated proteins, and blue indicates the down-regulated proteins. PE, pre-eclampsia; NC, normal pregnancy placenta; FC, fold change.
Fig. 2
Fig. 2
Gene Ontology and Kyoto Encyclopedia of Genes and Genomes were used to analyse the function and signalling pathways of differentially expressed proteins between pre-eclampsia and normal pregnancy placenta. (A) Bubble chart of the top 20 molecular functions after Gene analysis using Blast2Go. (B) Bubble chart of the top 20 signalling pathways as analysed using the Kyoto Encyclopedia of Genes and Genomes.
Fig. 3
Fig. 3
Verification of the expression of m6A modification-related proteins. (A) Dot Blot detection of m6A modification of total RNA in pre-eclampsia and normal pregnancy placenta. N (biological replicates) = 3 each group. (B) Proteins detected by MSLQP in the placenta of pre-eclampsia and normal pregnancy revealed that there were significant differences in m6A modification-related protein expression levels, including G3BP1, RBM15, and YTHDF2. N (biological replicates) = 3 each group. (C) Western blotting was used to detect the expression of G3BP1, RBM15, and YTHDF2 in placenta from pre-eclampsia and normal pregnancy. N (biological replicates) = 3 each group. *, p value less than 0.05. PE, pre-eclampsia; NC, normal pregnancy placenta; G3BP1, Ras GTPase-activating protein-binding protein 1; RBM15, RNA-binding protein 15; YTHDF2, YTH domain-containing family protein 2; MSLQP: mass spectrometry-based label-free quantitative proteomics.
Fig. 4
Fig. 4
RBM15 inhibited trophoblast cell function and promoted m6A modification levels in HTR8/SVneo and JEG-3 cells. (A) qPCR detected the expression of RBM15 mRNA levels after overexpression of RBM15 for 24 h. (B) Western blotting was used to detect the expression levels of RBM15, MMP-2, and MMP-9 after overexpression of RBM15 for 48 h. (C) Dot Blots were used to detect the m6A modification of total RNA after overexpression of RBM15 for 24 h in both HTR8/SVneo and JEG-3 cells. (D) Transwell assays were used to assess the changes in cell migration after overexpression of RBM15 for 48 h. (E) Transwell assays were used to detect the changes in cell invasion after overexpression of RBM15 for 48 h ***, p value less than 0.001; ****, p value less than 0.0001. RBM15, RNA-binding protein 15; MMP-2, matrix metallopeptidase 2; MMP-9, matrix metallopeptidase 9; GAPDH, glyceraldehyde-3-phosphate dehydrogenase; pCDH-NC, the vector of pCDH.
Fig. 5
Fig. 5
Differentially expressed genes using transcriptome sequencing in pre-eclampsia and normal pregnancy placenta. (A) Number of significantly differential expressed mRNAs in pre-eclampsia and normal pregnancy placenta. Red indicated the number of elevated mRNAs in the PE group, green indicated the number of downregulated mRNAs in the PE group, and blue indicated the number of total significantly differential expressed mRNAs between the two groups. N (biological replicates) = 3 each group. (B) A heat map was used to indicate the significantly differential expressed mRNAs in pre-eclampsia and normal pregnancy placenta. Blue indicated downregulated mRNAs in the PE group, and red indicated upregulated mRNAs in the PE group. N (biological replicates) = 3 each group. (C) A Volcano plot was used to present the detected mRNAs between pre-eclampsia and normal pregnancy placenta. Blue indicated downregulated mRNAs in the PE group, red indicated upregulated mRNAs in the PE group, and grey indicated no significantly expressed mRNAs between PE and NC group. N (biological replicates) = 3 each group. PE, pre-eclampsia; NC, normal pregnancy placenta; DEGs: differentially expressed genes.
Fig. 6
Fig. 6
Gene Ontology and Kyoto Encyclopedia of Genes and Genomes were used to analyse the function and signalling pathways of differentially expressed mRNAs between pre-eclampsia and normal pregnancy placenta. (A) Column chart of the top 30 functions after analysis by Gene Ontology using Blast2Go (https://www.blast2go.com/). (B) Bubble chart of the top 20 signal pathways as analysed by the Kyoto Encyclopedia of Genes and Genomes.
Fig. 7
Fig. 7
Combination analysis of the transcriptome and mass spectrometry-based label-free quantitative proteomics that was used to assess the transcription and translation characteristics of differentially expressed genes in placenta from pre-eclampsia and normal pregnancy (A) A Venn diagram was used to indicate the number of associations between the transcriptome and proteome at the quantitative and differential expression levels. Red indicates the number of genes corresponding to quantifiable proteins in the NC and PE groups, yellow indicates the number of genes corresponding to significantly differentially expressed proteins, blue indicates the number of genes detected in the NC and PE groups, and green indicates the number of significantly differentially expressed genes. (B) Analysis of correlated genes. (C) Heat map indicating the 56 correlated genes and proteins. The left panel presents the proteome, the right panel indicates the transcriptome, and each line represents a protein/mRNA. Red indicates upregulation, and blue indicates downregulation. PE, pre-eclampsia; DE, differential expressed.
Fig. 8
Fig. 8
Gene Ontology and Kyoto Encyclopedia of Genes and Genomes were used to analyse the function and signalling pathways of the correlated genes in transcriptome and mass spectrometry-based label-free quantitative proteomics. (A) GO secondary classification of proteins. Each column represents a secondary classification of GO, and the three colours represent three major categories. Blue represents biological processes, orange represents molecular functions, and yellow represents cell components. The left ordinate represents the number of differential protein entries in the secondary classification, and the right ordinate represents the percentage of entries in the total differential protein number in the correlated genes. (B) Kyoto Encyclopedia of Genes and Genomes analysis of the top 20 pathways with the most significant numbers of differentially expressed proteins. The abscissa represents the name of the KEGG pathway, and the ordinate represents the number of differential proteins corresponding to the KEGG pathway. From top to bottom, the number of differentially expressed proteins in the association is ranked from high to low.
Fig. 9
Fig. 9
Overexpression of RBM15 inhibited CD82 expression and its potential regulation mechanism. (A) qPCR was used to detect the expression levels of NOTUM and CD82 in the placental NC and PE groups. N (biological replicates) = 7 each group. (B–C) Western blotting (B) and immunofluorescence (C) were used to detect CD82 abundance in the placenta of the NC and PE groups. TPGB is the markers of trophoblast cells. N (biological replicates) = 3 each group. (D) qPCR analysis of CD82 expression following RBM15 overexpression. The pCDH-RBM15 vector and its control vector, pCDH-NC, were transfected into HTR8/SVneo and JEG-3 cells for 24 h. (E) Western blotting was used to detect CD82 abundance after RBM15 overexpression. pCDH-RBM15 vector and its control vector pCDH-NC were transfected into cells for 48 h. (F) SRAMP predicted the m6A modification site of CD82 mRNA 3'UTR. (G) Effect of overexpression of RBM15 on the stability of the CD82 3’UTR was detected by luciferase activity. pmirGLO-CD82 3′UTR WT (pmirGLO-WT) or pmirGLO-CD82 3′UTR mut (pmirGLO-mut) vector and pCDH-RBM15 (or pCDH) were co-transfected into 293T cells for 48 h. (H) YTHDF2-RIP detection was used to evaluate the binding ability between YTHDF2 and the CD82 3′UTR. pCDH or pCDH-RBM15 were transfected into HTR8/SVneo for 48 h **p value less than 0.01, ***p value less than 0.001, ****p value less than 0.0001. PE, pre-eclampsia; NC, normal pregnancy placenta; CD82, cluster of differentiation 82; NOTUM, palmitoleoyl-protein carboxylesterase; RBM15, RNA-binding protein 15; GAPDH, glyceraldehyde-3-phosphate dehydrogenase; pCDH-NC, vector.
Fig. 10
Fig. 10
RBM15 participates in the effect of trophoblast cells via regulation CD82 in HTR8/SVneo and JEG-3 cells. (A) qPCR was used to detect the expression of RBM15 and CD82 after overexpression of RBM15 and CD82. pCDH, pCDH-RBM15, or pCDH-CD82 were transfected into cells for 24 h. (B) Western blotting was used to detect the abundance of RBM15, CD82, MMP-2, and MMP-9 after the overexpression of RBM15 and CD82. Cells were transfected with pCDH, pCDH-RBM15, or pCDH-CD82 for 48 h. (C) Transwell assays were used to detect changes in cell migration after overexpression of RBM15 and CD82. Cells were transfected with pCDH, pCDH-RBM15, or pCDH-CD82 for 48 h. (D) Transwell assays were used to detect changes in cell invasion after overexpression of RBM15 and CD8. pCDH, pCDH-RBM15, or pCDH-CD82 were transfected into cells for 48 h *p value less than 0.05; **p value less than 0.01; ***p value less than 0.001; ****p value less than 0.0001. RBM15, RNA-binding protein 15; MMP-2, matrix metallopeptidase 2; MMP-9, matrix metallopeptidase 9; GAPDH, glyceraldehyde-3-phosphate dehydrogenase; pCDH-NC, pCDH vector; CD82, cluster of differentiation 82.

Similar articles

Cited by

References

    1. Dimitriadis E., et al. Pre-eclampsia. Nat. Rev. Dis. Prim. 2023;9(1):8. - PubMed
    1. Chappell L.C., et al. Pre-eclampsia. Lancet. 2021;398(10297):341–354. - PubMed
    1. Phipps E.A., et al. Pre-eclampsia: pathogenesis, novel diagnostics and therapies. Nat. Rev. Nephrol. 2019;15(5):275–289. - PMC - PubMed
    1. Turco M.Y., Moffett A. Development of the human placenta. Development. 2019;146(22) - PubMed
    1. Zhang Y., et al. circRNA N6-methyladenosine methylation in preeclampsia and the potential role of N6-methyladenosine-modified circPAPPA2 in trophoblast invasion. Sci. Rep. 2021;11(1) - PMC - PubMed

LinkOut - more resources