Review
. 2024 Apr 8;4(5):345-358.
doi: 10.1016/j.jacasi.2024.02.002. eCollection 2024 May.

Impact of Aging on Cardiovascular Diseases: From Chronological Observation to Biological Insights: JACC Family Series

Affiliations
Review

Impact of Aging on Cardiovascular Diseases: From Chronological Observation to Biological Insights: JACC Family Series

Dong Zhao et al. JACC Asia. .

Abstract

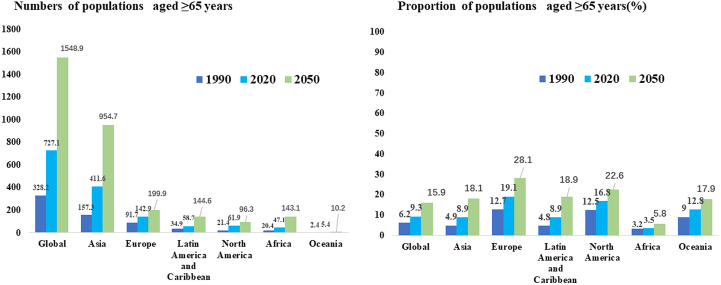
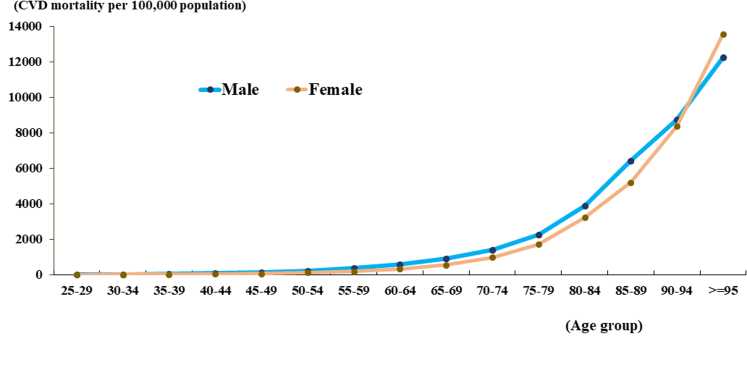
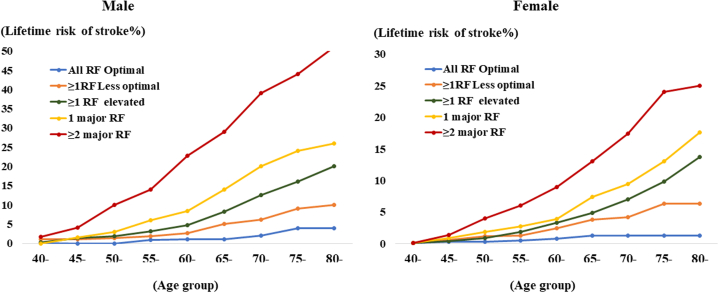
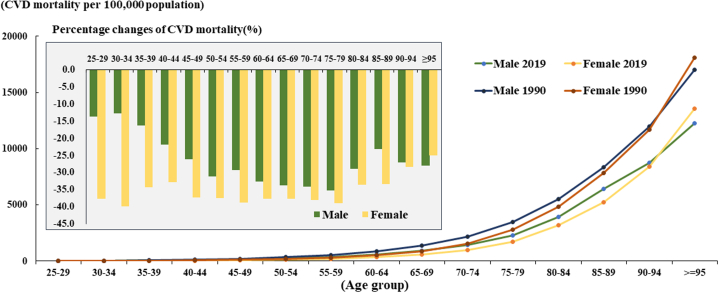
Cardiovascular disease (CVD) has increasing challenges for human health with an increasingly aging population worldwide, imposing a significant obstacle to the goal of healthy aging. Rapid advancements in our understanding of biological aging process have shed new light on some important insights to aging-related diseases. Although numerous reviews delved into the mechanisms through which biological aging affects CVD and age-related diseases, most of these reviews relied heavily on research related to cellular and molecular processes often observed from animal experiments. Few reviews have provided insights that connect hypotheses regarding the biological aging process with the observed patterns of chronological aging-related impacts on CVD in human populations. The purpose of this review is to highlight some of the major questions in studies of aging-related CVD and provide our perspectives in the context of real-world patterns of CVD with multidimensional information and potential biological insights.

Keywords: aging; biological aging; cardiovascular disease; chronological aging.


Conflict of interest statement

The authors have reported that they have no relationships relevant to the contents of this paper to disclose.

Figures

None
Graphical abstract
Figure 1
Figure 1
Increasing Aged Populations Around the World From 1990 to 2050 Increasing sizes and proportions of populations aged ≥65 years from 1990 to 2050 in global and 6 world regions based on published data from the World Health Organization and World Bank.,
Figure 2
Figure 2
Global Age-Specific CVD Mortality Rates in 2019 Global age-specific CVD mortality rates in 2019 illustrate the association between aging and CVD mortality through the exponential curve of age-specific CVD mortality from age 25 years to age ≥95 years of the world population. CVD = cardiovascular disease.
Figure 3
Figure 3
Lifetime Risk of Stroke in Individuals With Different Risk-Factor Profiles Potential impact of the hypothetical intrinsic biological aging process on risk of major types of CVD and the interactions between the hypothetical intrinsic biological aging and major CVD risk factors such as blood pressure, lipids, smoking status, and diabetes status. Reprinted with permission from Wang et al. Abbreviations as in Figure 2.
Figure 4
Figure 4
Decreasing Age-Specific CVD Mortality Rates From 1990 to 2019 Decrease in age-specific CVD mortality rate from 1990 to 2019 across all age groups from 25 to ≥95 years, both in men and women. Abbreviations as in Figure 2.
Figure 5
Figure 5
Age-Specific CVD Mortality by Time and SDI Differences in age-specific CVD mortality rates and changes in women and men among countries with different SDI levels (low, low middle, middle, high middle, and high) in 1990 and 2019. (A) women ages 25 to 64 years in 1990; (B) women ages 65 to ≥95 years in 1990; (C) men ages 25 to 64 in 1990; (D) men ages 65 to ≥95 years in 1990; (E) women ages 25 to 64 years in 2019; (F) women ages 65 to ≥95 years in 2019; (G) men ages 25 to 64 in 2019; (H) men ages 65 to ≥95 years in 2019. SDI = Socio-demographic Index; other abbreviations as in Figure 2.
Figure 6
Figure 6
Decline in Rates of Age-Specific Cardiovascular Disease Mortality by SDI Decreases in age-specific CVD mortality rate among countries with different SDI levels (low, low middle, middle, high middle, and high) from1990 to 2019. (A) Countries with low SDI levels; (B) countries with high SDI levels. Abbreviations as in Figures 2 and 5.
Figure 7
Figure 7
Comparison of Age-Specific CVD and Cancer Mortality in 2019 Patterns of age-specific CVD mortality and age-specific cancer mortality. (A) Age-specific CVD mortality and cancer mortality from age 25 to 95 years; (B) age-specific CVD mortality and cancer mortality from age 25 to 64 years; and (C) age-specific CVD mortality and cancer mortality from age 65 to ≥95 years. Abbreviations as in Figure 2.
Figure 8
Figure 8
Sequential Growth Ratios of Age-Specific CVD and Cancer Mortality Rates Gender-specific acceleration patterns CVD and cancer mortality as per 5 years’ increase from ages 25 to ≥95 years. (A) Sequential growth ratio of CVD mortality by age groups in men and women. (B) Sequential growth ratios of cancer mortality by age groups in men and women. Abbreviations as in Figure 2.
Central Illustration
Synergistic Effects of Biological Aging Process on Aging-Related Cardiovascular Disease Risk The impact of biological aging on aging-related CVD may be a synergistic effect of the hypothetical intrinsic biological aging process, status of modifiable risk factors, and the levels of socioeconomic development. CVD = cardiovascular disease.

References

    1. World Health Organization . Sustainable Development Goals.; Geneva, Switzerland: 2023. World Health Statistics 2023: Monitoring Health for the SDGs.
    1. Global Burden of Disease Collaborative Network . Institute for Health Metrics and Evaluation (IHME); Seattle, WA: 2020. Global Burden of Disease Study Results.http://ghdx.healthdata.org/gbdresults-tool
    1. United Nations, Population Division. World Population Prospects 2019, Volume I: Comprehensive Tables (ST/ESA/SER.A/426) Department of Economic and Social Affairs; 2019.
    1. United Nations, Population Division. World Population Prospects 2022: Summary of Results. (UN DESA/POP/2022/TR/NO. 3.) Department of Economic and Social Affairs; 2022.
    1. Lopez A.D., Mathers C.D. Measuring the global burden of disease and epidemiological transitions: 2002-2030. Ann Trop Med Parasitol. 2006;100(5-6):481–499. - PubMed