

Time‑dependent ROC curve analysis to determine the predictive capacity of seven clinical scales for mortality in patients with COVID‑19: Study of a hospital cohort with very high mortality
- PMID: 38765855
- PMCID: PMC11099607
- DOI: 10.3892/br.2024.1788
Time‑dependent ROC curve analysis to determine the predictive capacity of seven clinical scales for mortality in patients with COVID‑19: Study of a hospital cohort with very high mortality
Abstract
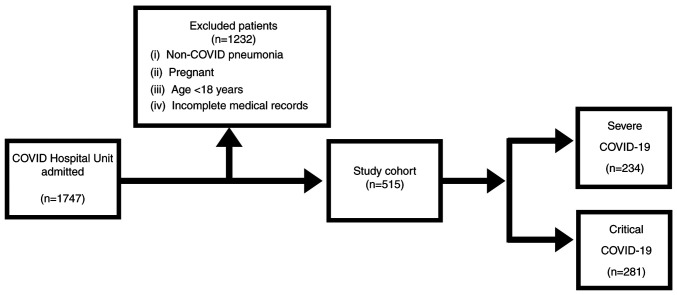
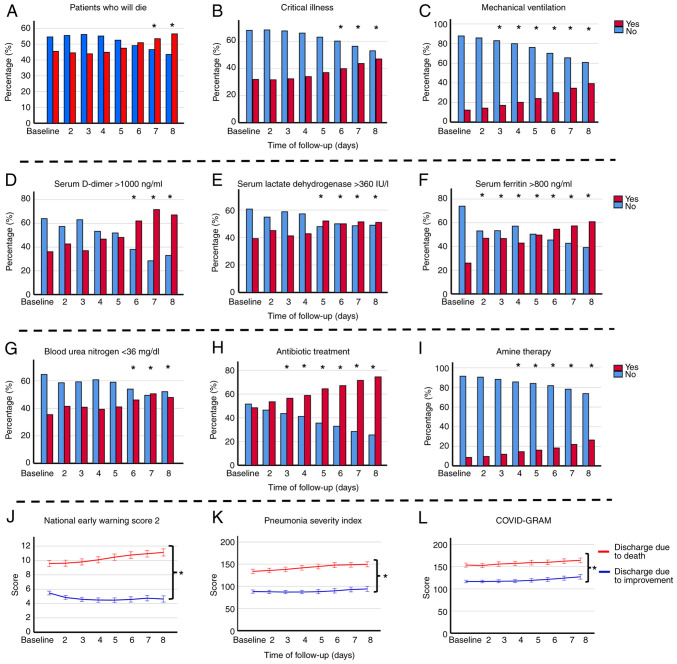
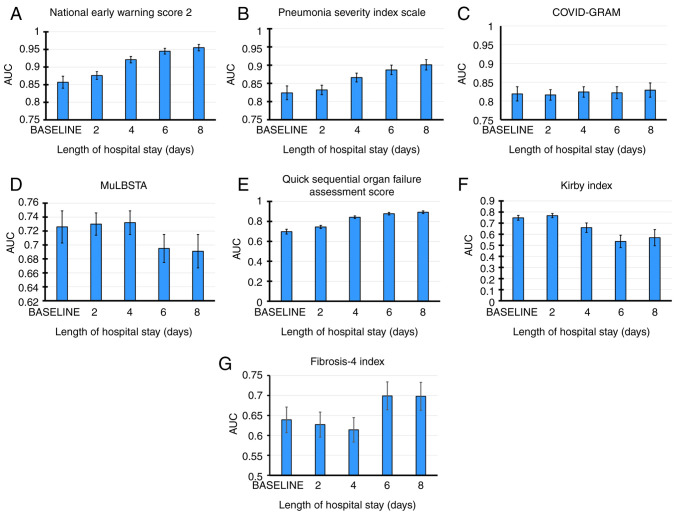
Clinical data from hospital admissions are typically utilized to determine the prognostic capacity of Coronavirus disease 2019 (COVID-19) indices. However, as disease status and severity markers evolve over time, time-dependent receiver operating characteristic (ROC) curve analysis becomes more appropriate. The present analysis assessed predictive power for death at various time points throughout patient hospitalization. In a cohort study involving 515 hospitalized patients (General Hospital Number 1 of Mexican Social Security Institute, Colima, Mexico from February 2021 to December 2022) with COVID-19, seven severity indices [Pneumonia Severity Index (PSI) PaO2/FiO2 arterial oxygen pressure/fraction of inspired oxygen (Kirby index), the Critical Illness Risk Score (COVID-GRAM), the National Early Warning Score 2 (NEWS-2), the quick Sequential Organ Failure Assessment score (qSOFA), the Fibrosis-4 index (FIB-4) and the Viral Pneumonia Mortality Score (MuLBSTA were evaluated using time-dependent ROC curves. Clinical data were collected at admission and at 2, 4, 6 and 8 days into hospitalization. The study calculated the area under the curve (AUC), sensitivity, specificity, and predictive values for each index at these time points. Mortality was 43.9%. Throughout all time points, NEWS-2 demonstrated the highest predictive power for mortality, as indicated by its AUC values. PSI and COVID-GRAM followed, with predictive power increasing as hospitalization duration progressed. Additionally, NEWS-2 exhibited the highest sensitivity (>96% in all periods) but showed low specificity, which increased from 22.9% at admission to 58.1% by day 8. PSI displayed good predictive capacity from admission to day 6 and excellent predictive power at day 8 and its sensitivity remained >80% throughout all periods, with moderate specificity (70.6-77.3%). COVID-GRAM demonstrated good predictive capacity across all periods, with high sensitivity (84.2-87.3%) but low-to-moderate specificity (61.5-67.6%). The qSOFA index initially had poor predictive power upon admission but improved after 4 days. FIB-4 had a statistically significant predictive capacity in all periods (P=0.001), but with limited clinical value (AUC, 0.639-0.698), and with low sensitivity and specificity. MuLBSTA and IKIRBY exhibited low predictive power at admission and no power after 6 days. In conclusion, in COVID-19 patients with high mortality rates, NEWS-2 and PSI consistently exhibited predictive power for death during hospital stay, with PSI demonstrating the best balance between sensitivity and specificity.
Keywords: COVID-19; ROC curve; hospital mortality; sensitivity; severity of illness index; specificity.
Copyright: © 2024 Mendoza-Hernandez et al.
Conflict of interest statement
The authors declare that they have no competing interests.
Figures
References
-
- Barbero MG. ¿Como ha afectado la COVID- 19 al sistema sanitario y la formación de los médicos y que hemos aprendido? Educación Médica. 2021;22:S1–S2.
-
- Pan American Health Organization: Epidemiological update: SARS-CoV-2 and other respiratory viruses in the Americas Region-8 January 2024., 2024.
-
- Delgado-Enciso I, Paz-Garcia J, Barajas-Saucedo CE, Mokay-Ramírez KA, Meza-Robles C, Lopez-Flores R, Delgado-Machuca M, Murillo-Zamora E, Toscano-Velazquez JA, Delgado-Enciso J, et al. Safety and efficacy of a COVID-19 treatment with nebulized and/or intravenous neutral electrolyzed saline combined with usual medical care vs. usual medical care alone: A randomized, open-label, controlled trial. Exp Ther Med. 2021;22(915) doi: 10.3892/etm.2021.10347. - DOI - PMC - PubMed
-
- Havers FP, Pham H, Taylor CA, Whitaker M, Patel K, Anglin O, Kambhampati AK, Milucky J, Zell E, Moline HL, et al. COVID-19-associated hospitalizations among vaccinated and unvaccinated adults 18 years or older in 13 US States, January 2021 to April 2022. JAMA Intern Med. 2022;182:1071–1081. doi: 10.1001/jamainternmed.2022.4299. - DOI - PMC - PubMed
LinkOut - more resources
Full Text Sources