[Preprint]. 2024 May 8:2024.05.07.591898.
doi: 10.1101/2024.05.07.591898.

Dopey-dependent regulation of extracellular vesicles maintains neuronal morphology

Affiliations

Dopey-dependent regulation of extracellular vesicles maintains neuronal morphology

Seungmee Park et al. bioRxiv. .

Update in

Abstract

Mature neurons maintain their distinctive morphology for extended periods in adult life. Compared to developmental neurite outgrowth, axon guidance, and target selection, relatively little is known of mechanisms that maintain mature neuron morphology. Loss of function in C. elegans DIP-2, a member of the conserved lipid metabolic regulator Dip2 family, results in progressive overgrowth of neurites in adults. We find that dip-2 mutants display specific genetic interactions with sax-2, the C. elegans ortholog of Drosophila Furry and mammalian FRY. Combined loss of DIP-2 and SAX-2 results in severe disruption of neuronal morphology maintenance accompanied by increased release of neuronal extracellular vesicles (EVs). By screening for suppressors of dip-2 sax-2 double mutant defects we identified gain-of-function (gf) mutations in the conserved Dopey family protein PAD-1 and its associated phospholipid flippase TAT-5/ATP9A. In dip-2 sax-2 double mutants carrying either pad-1(gf) or tat-5(gf) mutation, EV release is reduced and neuronal morphology across multiple neuron types is restored to largely normal. PAD-1(gf) acts cell autonomously in neurons. The domain containing pad-1(gf) is essential for PAD-1 function, and PAD-1(gf) protein displays increased association with the plasma membrane and inhibits EV release. Our findings uncover a novel functional network of DIP-2, SAX-2, PAD-1, and TAT-5 that maintains morphology of neurons and other types of cells, shedding light on the mechanistic basis of neurological disorders involving human orthologs of these genes.

Keywords: DIP-2 lipid regulator; PAD-1/DOPEY; SAX-2/Fry; TAT-5 phospholipid flippase; endosomal trafficking; neuronal maintenance.


Figures

Figure 1.
Figure 1.. DIP-2 and SAX-2 function synergistically to maintain neuronal morphology
(A-B) Confocal images of touch receptor neurons (TRNs) labeled with Pmec-4-GFP(zdIs5) in 1-day old adults of genotype indicated. Red arrowheads mark the soma of ALMs (A) and PLMs (B). In wild type, ALM extends a single anterior axonal process with a single branch in the nerve ring (not shown) and either has no posterior neurite or a very short posterior neurite (<10 μm). Any ALM posterior neurite >10 μm was scored as an ‘ectopic posterior neurite’ (red arrows). Some sax-2(0) mutants showed an enlarged and misshapen soma and small blebs (blue arrows) along anterior neurites. dip-2(0) sax-2(0) double mutants exhibited multiple ectopic neurites (black arrows) in addition to the ectopic posterior neurite, as well as large blebs (blue arrows) from the anterior axon and soma. PLM (B) showed a similar range of defects in mutants indicated. Scale = 10 μm. (C,D) Overexpression of DIP-2 did not rescue sax-2(0) single mutant neuronal morphology phenotypes (left columns). Overexpression of DIP-2 in TRNs but not in epidermis can partly suppress ALM ectopic posterior neurites and PLM overshooting phenotypes of dip-2(0) sax-2(0) double mutants to the level of sax-2(0) single mutants (right columns). Ectopic posterior neurites were further classified by length. Neuron morphology scored in A1 adult (N = 18–40). Statistics, Freeman-Halton extension of Fisher’s exact test. (E) Score of ALM ectopic posterior neurites in L1, L4 and 1-day old adult animals of genotype indicated, classified based on neurite length. N = 23–58. (F) Individual animals were repeatedly imaged over multiple time points to measure the length of the longest ectopic neurite in L1, L4, day 1 adult, and day 5 adult stages (N = 2–10 per time point). x-axis, hours after hatching. Statistics, one-way ANOVA. *(P<0.05), **(P<0.01), ***(P<0.001).
Figure 2.
Figure 2.. The PAD-1(E1909K) gain-of-function mutation suppresses dip-2(0) sax-2(0) double mutant phenotypes
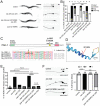
(A) Bright field images of 1-day old adults (left) and confocal images of ALM neurons (right) in animals of genotype indicated. pad-1(ju1806 E1909K) suppressed both body length and neuronal morphology defects in dip-2(0) sax-2(0) double mutants. Scale = 100 μm for body images and 10 μm for neuronal images. (B) Quantitation of ALM posterior neurite phenotypes in animals of genotype indicated. pad-1(E1909K) suppresses the sprouting of long posterior neurite in dip-2(0) sax-2(0) double and sax-2(0) single mutants. pad-1(E1909A) reduced the length of ALM posterior neurites. (C) PAD-1 protein structure illustration with the sequence alignment below showing the region affected by pad-1(ju1806 E1909K). Color-coded sequence alignment of PAD-1 residues (aa1894–1932) and the corresponding residues in the DOPEY orthologs from Mus musculus (UniProt Q8BL99 and Q3UHQ6) and Drosophila melanogaster (A1ZBE8) was obtained using Clustal Omega. % identity to PAD-1 is indicated. Mouse and human DOPEY1 are identical in this region. Arrow points to E1909, and the black underline points to 8 residues deleted in pad-1(ju1948). DEC corresponds to the ‘Dopey Extreme C-terminus’ implicated in targeting of Dopey1 to the Golgi. (D) Alphafold (https://alphafold.ebi.ac.uk) prediction of structure of the region spanning aa 1894–1932 in PAD-1; E1909 is indicated with red arrow. (E) Genetic interaction between pad-1 gain and loss-of-function mutation with sax-2(0). ALM ectopic neurites scored using Pmec-7-GFP(muIs32) marker. pad-1(E1909K) displayed dominant suppression of ALM ectopic neurite outgrowth. pad-1(0) caused partially penetrant ectopic ALM neurites and did not enhance sax-2(0). (F) pad-1(E1909K) suppressed soma shape defects of sax-2(0) single mutants. ALM soma shape defects were categorized as “0” (normal: ovoid soma shape with uniform GFP expression); “1” (soma slightly altered from the ovoid shape but even GFP expression) or “2” (soma significantly misshapen and/or uneven GFP expression). Scale = 10 μm. Statistics (D,E): Fisher’s exact test. ***(P < 0.001), **(P<0.01), *(P<0.05).
Figure 3.
Figure 3.. Localization of SAX-2, PAD-1(WT), and PAD-1(E1909K)
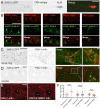
(A) SAX-2::GFP(ju1831) in ALM neuron labelled with mKate (juSi329). Small SAX-2::GFP puncta were visible in the periphery of ALM soma and in surrounding epidermis. Scale, 10 μm (B) Airyscan images of PAD-1::mSc KI partially co-localized with the late endosomal marker RAB-7 in motor neurons. PAD-1 mSc KI did not co-localize with other endosomal markers RAB-5 and RAB-11.1 or Golgi markers eGFP::RAB-6.2 and RUND-1::eGFP. Scale = 5 μm. (C) Images represent the anterior ganglion near the nerve ring where N-terminal GFP::SAX-2 and PAD-1::mSc puncta are present in neuronal soma but do not co-localize. The inset image is single confocal slice of a soma (nucleus indicated by N) showing that PAD-1 and SAX-2 puncta are adjacent (white arrows) but not overlapping. Scale = 10 μm. The scale in the magnified image is 1 μm. (D) Images of oocytes showing a lack of co-localization of GFP::SAX-2 and PAD-1::mSc, with both types of puncta occasionally adjacent (white arrows). Scale = 10 μm. The scale in the magnified image is 1 μm. (E) Images of PAD-1(E1909K)::mSc in oocytes showing significantly increased association with the plasma membrane, compared to PAD-1(+)::mSc. Scale = 10 μm. (F) Quantitation of PAD-1::mSc or PAD-1(E1909K)::mSc signal intensity at the plasma membrane, cortical granules (recycling endosomes), and cytosol in oocytes. Intensities are normalized to the WT PAD-1::mSc control in each location. Statistics: t-test. ***(P < 0.001). N in white indicates oocyte nucleus.
Figure 4.
Figure 4.. The TAT-5(A316V) gain-of-function mutant suppresses dip-2(0) sax-2(0) double mutant phenotypes
(A) Cartoon of TAT-5 isoform A. Blue M1-M10 represent the 10 transmembrane segments. The cytosolic loop between segments M2 and M3 contains part of the actuator (A) domain (yellow). The cytosolic region between M4 and M5 contains the nucleotide-binding (N) domain (pink) and the phosphorylation (P) domain (orange). Sequence alignment below shows the region encompassing A316 of TAT-5 isoform A and the corresponding region in other essential P4-ATPases of subclass 2: yeast Neo1p (QHB09325) and human ATP9A (O75110) and ATP9B (AAI25220). A316 is conserved between TAT-5 and these orthologs, but not in TAT-1 (subclass 1b). (B) Images show suppression of ALM morphology defects in 1-day old dip-2(0) sax-2(0) mutant adults by tat-5(A316V), including ectopic posterior neurites (red arrow), additional ectopic neurites (black arrow) and soma morphology defects (red arrowhead). tat-5(A316V) single mutants displayed normal ALM morphology. Scale = 10 μm. (C) Images of ALM in 5-day old control, tat-5(0) and tat-5(A316V). tat-5(0) but not tat-5(A316V) displayed a long posterior neurite from the ALM soma. (D) Quantitation of ALM ectopic neurite defects in aged animals of genotype indicated. Both tat-5(A316V, ju1805) and pad-1(E1909K, ju1806) partly suppressed dip-2(0) defects at 1-day old (A1, left) and 5-day old adult (A5, right) stages. ALMs in 5-day old tat-5(A316V) adults displayed short posterior neurites, whereas ALMs in age-matched tat-5(0) exhibited long posterior neurites. Statistics: Fisher’s exact test. ***(P < 0.001), **(P<0.01), *(P<0.05). (E) Airyscan images show ALM neurons labelled with juSi329 [Pmec-4::mKate] and expressing wur36 [GFP::TAT-5B/D KI]. Both dip-2(0) and sax-2(0) single mutants display GFP::TAT-5 in ectopic posterior neurites. Scale = 10 μm. The fluorescent signals of GFP::TAT-5 in the “1” dashed boxes within mKate+ ectopic neurites were line-scanned and plotted to show co-localization of TAT-5 and mKate. Signals in the dashed boxes labelled “2” serve as background. (F) Quantitation of mean intensity of GFP::TAT-5 (Arbitrary Units, AU) in the ALM soma. Kruskal-Wallis test with Dunn’s post test. * (P<0.05).
Figure 5.
Figure 5.. DIP-2 and SAX-2 synergistically regulate neuronal and oocyte membrane morphology
(A) Confocal images (maximum intensity projections of 5–10 focal planes) of ALM neurons labelled with mKate and GFP::PH domain under the control of the mec-4 promoter (juEx8228). White arrows indicate vesicular structures labelled with GFP::PH; arrowheads indicate ALM soma. Scale = 10 μm. (B) Quantitation of ALMs exhibiting GFP::PH vesicular structures in the soma and proximal neurites (see Methods). Statistics: Fisher exact test. *(P<0.05) (C) Quantitation of oocyte membrane defects in 1-day old young adults. Statistics: Fisher’s exact test. (D) Images show oocyte plasma membranes labelled with ltIs38 [Ppie-1-GFP::PH]. dip-2(0) single mutants displayed normal membrane morphology. sax-2(0) single mutants and dip-2(0) sax-2(0) double mutants displayed variable abnormalities including thickened membrane patches and vesicles close to or outside the oocyte plasma membrane; these defects were suppressed to near wild type by pad-1(E1909K), which as a single mutant displayed normal plasma membrane morphology. Black arrows indicate aberrant vesicular structures or plasma membrane patches. Scale = 10 μm.
Figure 6.
Figure 6.. Elevation of TSP-6+ neuronal EVs in dip-2(0) sax-2(0) double mutants and suppression by pad-1(E1909K) and tat-5(A316V)
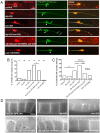
(A) Quantitation of EVs released from embryonic cells. EVs labeled by mCherry::PH::CTPD were elevated in the partial loss-of-function GFP::PAD-1 KI; this was suppressed by introduction of E1909K mutation. pad-1(E1909K) and PAD-1::mSc KI displayed normal levels of embryonic EVs. Statistics, t-test with Bonferroni correction. (B) Images and quantitation of morphological defects in ASER neuron (marker ntIs1). In sax-2(0) single mutants, ASER displayed ectopic neurite outgrowth (black arrows) and misshapen soma shape (red arrowheads). dip-2(0) mutants displayed largely normal ASER morphology and strongly enhanced sax-2(0) phenotypes; the synergistic defects of dip-2(0) sax-2(0) double mutants were suppressed by pad-1(E1909K). Statistics, Fisher’s exact test. (C) Confocal images of environmental EVs (TSP-6::mSc-+ puncta), defined as puncta released from the nose tip and observed in the adjacent medium. Superimposed confocal and bright field to show nose tip morphology. White arrows and bracket indicate TSP-6::mSc-+ EVs. (D) Quantitation of environmentally released TSP-6::mSc EVs. Statistics: one-way ANOVA, Šidák post test. (E) Images of the nerve ring region, head neurons expressing TSP-6::mSc, and AMsh cells labelled with YFP (outlined in dashed lines). TSP-6::mSc puncta were occasionally seen in the AMsh of dip-2(0) or sax-2(0) single mutants. In dip-2(0) sax-2(0) double mutants, TSP-6::mSc puncta accumulated in the soma of AMsh. pad-1(E1909K) suppressed the accumulation of TSP-6::mSc puncta in the AMsh soma and had normal levels of TSP-6::mSc puncta as single mutant. (F) Quantitation of TSP-6::mSc puncta in the soma of AMsh glial cells. Scale = 10 μm. Statistics: Kruskal-Wallis test, Dunn post test. (G) Quantitation of extent of TSP-6::mSc localization in ciliated neurons. Statistics: Kruskal-Wallis test with Dunn’s post test. For all the above statistical results, *** (P<0.001), ** (P<0.01), *(P<0.05).

References

    1. Heckman E.L., and Doe C.Q. (2021). Establishment and Maintenance of Neural Circuit Architecture. J Neurosci 41, 1119–1129. 10.1523/JNEUROSCI.114320.2020. - DOI - PMC - PubMed
    1. Bradke F., Di Giovanni S., and Fawcett J. (2020). Neuronal Maturation: Challenges and Opportunities in a Nascent Field. Trends Neurosci 43, 360–362. 10.1016/j.tins.2020.02.005. - DOI - PubMed
    1. Faust T.E., Gunner G., and Schafer D.P. (2021). Mechanisms governing activity-dependent synaptic pruning in the developing mammalian CNS. Nat Rev Neurosci 22, 657–673. 10.1038/s41583-021-00507-y. - DOI - PMC - PubMed
    1. Furusawa K., and Emoto K. (2021). Spatiotemporal regulation of developmental neurite pruning: Molecular and cellular insights from Drosophila models. Neurosci Res 167, 54–63. 10.1016/j.neures.2020.11.010. - DOI - PubMed
    1. Bhatt D.H., Zhang S., and Gan W.B. (2009). Dendritic spine dynamics. Annu Rev Physiol 71, 261–282. 10.1146/annurev.physiol.010908.163140. - DOI - PubMed

Publication types