[Preprint]. 2024 Oct 10:2024.05.08.593194.
doi: 10.1101/2024.05.08.593194.

Environment by environment interactions (ExE) differ across genetic backgrounds (ExExG)

Affiliations

Environment by environment interactions (ExE) differ across genetic backgrounds (ExExG)

Kara Schmidlin et al. bioRxiv. .

Abstract

While the terms "gene-by-gene interaction" (GxG) and "gene-by-environment interaction" (GxE) are widely recognized in the fields of quantitative and evolutionary genetics, "environment-byenvironment interaction" (ExE) is a term used less often. In this study, we find that environmentby-environment interactions are a meaningful driver of phenotypes, and moreover, that they differ across different genotypes (suggestive of ExExG). To support this conclusion, we analyzed a large dataset of roughly 1,000 mutant yeast strains with varying degrees of resistance to different antifungal drugs. Our findings reveal that the effectiveness of a drug combination, relative to single drugs, often differs across drug resistant mutants. Remarkably, even mutants that differ by only a single nucleotide change can have dramatically different drug × drug (ExE) interactions. We also introduce a new framework that more accurately predicts the direction and magnitude of ExE interactions for some mutants. Understanding how ExE interactions change across genotypes (ExExG) is crucial not only for modeling the evolution of pathogenic microbes, but also for enhancing our knowledge of the underlying cell biology and the sources of phenotypic variance within populations. While the significance of ExExG interactions has been overlooked in evolutionary and population genetics, these fields and others stand to benefit from understanding how these interactions shape the complex behavior of living systems.


Figures

Figure 1:
Figure 1:. Comparative visualizations of ExE, GxGxE and ExExG interactions.
(A) ExE interactions are understudied. Search results retrieved from Pubmed on May 3, 2024 demonstrate that publications describing ExE interactions, including GxExE, show substantial disparities when compared to simpler interactions like GxG and GxE, and drug interactions, which have significantly greater representation. Complete search term results are located in table S1. (B) A cartoon to define ExE. Environments 1 and 2 have unique effects on an organism’s phenotype or fitness (light orange and light yellow bars). When exposed to both environments simultaneously, one might expect that the combined effect is additive (E+E, indicated by gray). Here, we define ExE as when the observed effect of combining environments differs from the expectation (blue and red bars). (C) A cartoon to define GxGxE. GxGxE interactions describe how the combined effect of the same two mutations (light pink and dark pink bars) changes across two or more environments (top vs bottom panels). In this cartoon, the effects of gene 1 and gene 2 are additive in environment A (top panel; expectation equals observed), but produce unexpected interactions in environment B. Since the interaction between genes (GxG) differs across environments, this is referred to as a GxGxE interaction. (D) A cartoon to define ExExG. In general, ExExG interactions describe how the combined effect of two environments (purple and teal bars) changes across two or more genetic backgrounds (top vs. bottom panels). In this manuscript, the environments we study are different drugs. Different drug-resistant genotypes are exposed to the same single drugs (Drug 1, purple and Drug 2, teal) and their combination (Drug combo, gray). In this cartoon, genotype A (top) is resistant to drug 1 and 2 and thus has a fitness advantage over the ancestor of all the drug-resistant mutants in these environments (purple and teal bars). But genotype A is unexpectedly sensitive to the combination of these two drugs, losing almost all of its fitness advantage (blue bar). This might imply that Drug 1 and drug 2 interact synergistically, enhancing one another’s ability to harm cells. However, this is not the case for genotype B, with respect to which the drugs interact antagonistically, meaning they hinder one another’s ability to harm cells, resulting in genotype B having an increased fitness advantage over the ancestor (red bar). Since the effect of combining drugs (ExE) varies across genotypes, this is referred to as ExExG.
Figure 2:
Figure 2:. ExE interactions vary across drug pairs and across mutants.
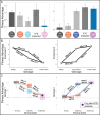
(A) We predict fitness in four double drug environments from fitness in four relevant single drug environments. (B) Environment-byenvironment interactions are revealed when fitness in a double drug environment deviates from the expectation generated by the relevant single drug environments. Four different models (horizontal axis) are used to calculate expected fitness for each of roughly 1000 mutants per drug pair (LRLF: n=1688; LRHF: n=850; HRLF: n=1318; HRHF: n=1023). Points representing each mutant are colored blue when a mutant’s fitness is worse than expected (synergy), and red when fitness is higher than expected (antagonism). Boxplots summarize the distribution across all mutants, displaying the median (center line), interquartile range (IQR) (upper and lower hinges), and highest value within 1.5 × IQR (whiskers). (C) Some mutants have different ExE interactions than others. The left panel displays the fitness of a yeast strain with a mutation in the HDA1 gene. It has lower fitness in the LRLF double drug environment than expected based on the simple additive model depicted in figure 1. The right hand panel shows a different yeast strain that has higher fitness than expected in the same environment. Error bars represent the range of fitness measured across two replicate experiments. Fitness is always measured relative to a reference strain, which is the shared ancestor of all mutant strains. (D) ExE interactions vary more across mutants than they do across drug pairs. The vertical axis displays the standard deviation across all four environments (brown) or across all roughly 1,000 mutants (green) when ExE is predicted using an additive model.
Figure 3:
Figure 3:. A few mutations can change a drug pair from having a synergistic to an antagonistic effect.
(AD) Fitness advantages of strains with mutations in either PDR1/3 (n=35), IRA1 (n=3), SUR1 (n=2), GPB2 (n=2), relative to unmutated reference strains. Light gray bars represent the average fitness of each class of mutants in single drug environments, dark gray bars represent fitness predictions in double drug environments made using an additive model, and colored bars represent average fitness in double drug environments (colored blue when fitness is lower than prediction and red when fitness exceeds the prediction). Colors lighten when within 0.5 of the expected value. The type and magnitude of ExE interaction appears to be similar across mutations to the same gene, but different across mutations to different genes. Each row corresponds to one of the double drug environments we study, including (A) LRLF, (B) LRHF, (C) HRLF, (D) HRHF. (E) ExE for 774 mutants in each studied drug combination broken down by cluster assigned in previous work (56). Mutants are colored by their type of ExE interaction. Here, mutants that experience synergistic interactions are noted with a blue point while antagonistic interactions are noted with a red point. Colors lighten as ExE approaches zero. Sequenced mutants from A-D are shown by colored diamonds. Boxplots summarize the distribution across all mutants, displaying the median (center line), interquartile range (IQR) (upper and lower hinges), and highest value within 1.5 × IQR (whiskers).
Figure 4:
Figure 4:. Classical GxG framework inspired a new “drug effect” (DE) model that accurately predicts the behavior of some drug resistant mutants in double drug environments.
(A) Our original additive model (“E+E”) makes poor fitness predictions for the 145 mutants in the left panel, but not for the 158 mutants in the right panel. Another key difference is that the mutants in the left panel have fitness advantages over the reference strain in the no drug environment, while the mutants in the right panel do not. The mutants in each panel clustered together in previous work based on their fitness in 12 environments (56). Dark gray bars represent average fitness in no drug, light gray bars represent average fitness in single drug environments, medium gray bars represent fitness predictions in double drug environments made using our original additive model, and colored bars represent average fitness in double drug environments. Error bars represent standard deviation. (B) Classic GxG additive models are different from the additive models in panel A and in earlier figures. GxG models add together the effect of each single mutation to predict the fitness of the double mutant, rather than adding together the fitness of each single mutant (12). The left panel provides an example where the wildtype (ab) has a fitness advantage in environment 1. Gaining mutation A or B results in decreased fitness. Subtracting the effect of both A and B allows for the correct prediction of the double mutant’s (AB) fitness in environment 1. The right panel presents a second environment where the wildtype fitness is improved by mutations A and B. Here adding the effect of both A and B results in accurate prediction of the double mutant’s fitness. (C) Repurposing the GxG model in panel B to predict fitness results in accurate predictions for the mutants described in panel A. Boxplots summarize the distribution across all mutants, displaying the median (center line), interquartile range (IQR) (upper and lower hinges), and highest value within 1.5 × IQR (whiskers). No drug is shown in dark gray, single drugs in blue/orange and double drugs in pink/purple. The effect of each drug is represented by a colored line matching that of the single drug. The average prediction of the DE model for both groups of mutants is shown by a purple diamond.
Figure 5:
Figure 5:. Different drug-resistant mutants have different drug dose responses.
(AB) Toy examples showing how fitness predictions made assuming an additive model can fail when nonlinearities are present. (CE) A simple nonlinear model cannot account for ExE in these data because different mutants have different drug dose responses. Each panel captures unique mutants; sequenced mutants are highlighted with diamonds corresponding in color to those in figure 3. Boxplots summarize each distribution, displaying the median (center line), interquartile range (IQR) (upper and lower hinges), and highest value within 1.5 × IQR (whiskers). (F) Three isolated mutants from panel C have similar growth curves in multiple fluconazole concentrations. (G) Three isolated mutants from panel D grow better in low fluconazole and increasingly worse as the drug concentration increases.

Similar articles

References

    1. Bateson W., Mendel’s principles of heredity (University Press, 1909).
    1. Phillips P. C., The language of gene interaction. Genetics 149, 1167–1171 (1998). - PMC - PubMed
    1. Ogbunugafor C. B., Wylie C. S., Diakite I., Weinreich D. M., Hartl D. L., Adaptive Landscape by Environment Interactions Dictate Evolutionary Dynamics in Models of Drug Resistance. PLoS Comput. Biol. 12, e1004710 (2016). - PMC - PubMed
    1. Weinreich D. M., Lan Y., Wylie C. S., Heckendorn R. B., Should evolutionary geneticists worry about higher-order epistasis? Curr. Opin. Genet. Dev. 23, 700–707 (2013). - PMC - PubMed
    1. Eguchi Y., Bilolikar G., Geiler-Samerotte K., Why and how to study genetic changes with context-dependent effects. Curr. Opin. Genet. Dev. 58–59, 95–102 (2019). - PubMed

Publication types