[Preprint]. 2024 May 12:2024.05.09.593285.
doi: 10.1101/2024.05.09.593285.

The molecular mechanism of on-demand sterol biosynthesis at organelle contact sites

Affiliations

The molecular mechanism of on-demand sterol biosynthesis at organelle contact sites

Naama Zung et al. bioRxiv. .

Abstract

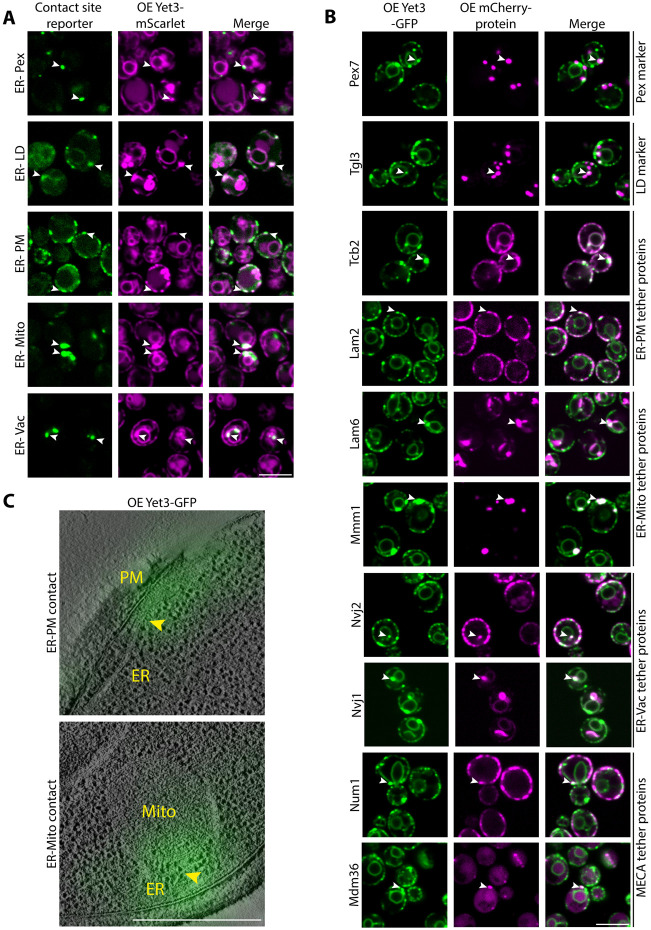
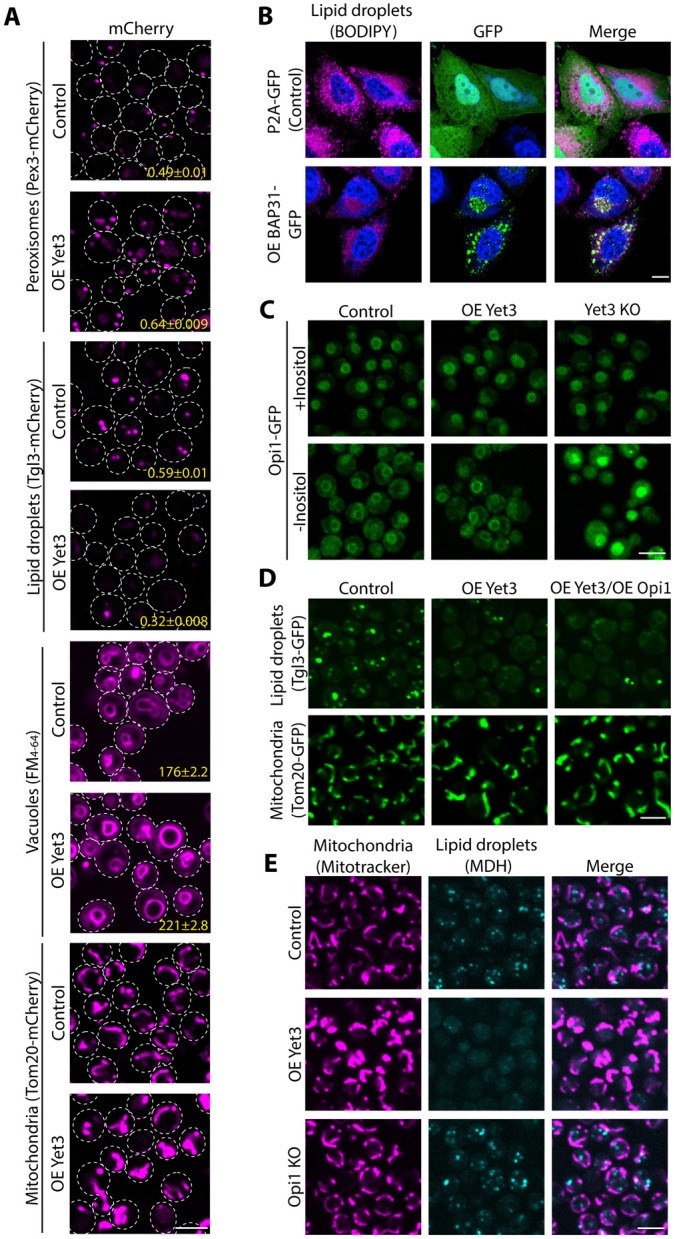
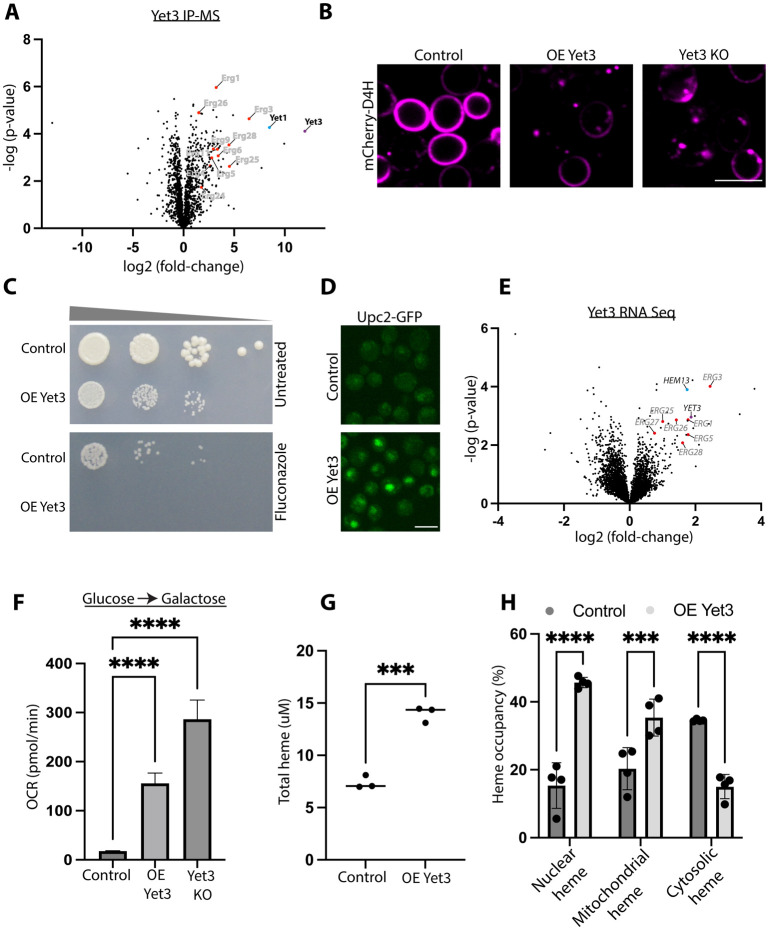
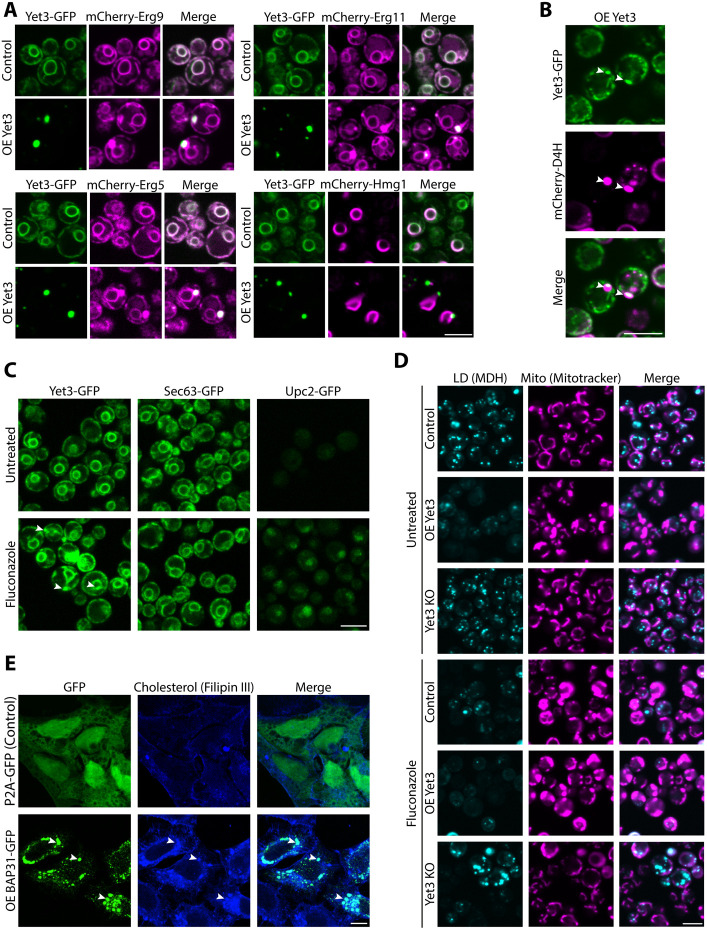
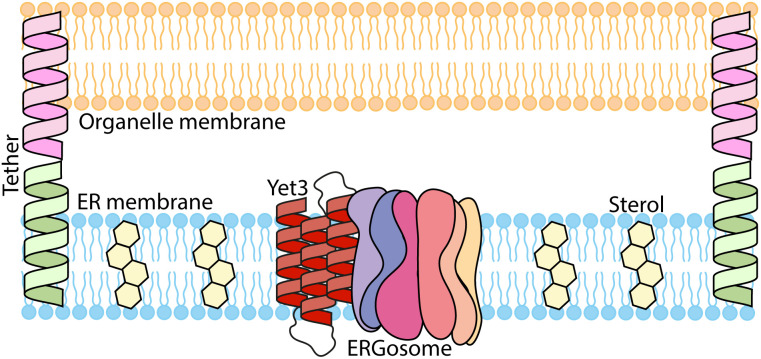
Contact-sites are specialized zones of proximity between two organelles, essential for organelle communication and coordination. The formation of contacts between the Endoplasmic Reticulum (ER), and other organelles, relies on a unique membrane environment enriched in sterols. However, how these sterol-rich domains are formed and maintained had not been understood. We found that the yeast membrane protein Yet3, the homolog of human BAP31, is localized to multiple ER contact sites. We show that Yet3 interacts with all the enzymes of the post-squalene ergosterol biosynthesis pathway and recruits them to create sterol-rich domains. Increasing sterol levels at ER contacts causes its depletion from the plasma membrane leading to a compensatory reaction and altered cell metabolism. Our data shows that Yet3 provides on-demand sterols at contacts thus shaping organellar structure and function. A molecular understanding of this protein's functions gives new insights into the role of BAP31 in development and pathology.


Figures

Figure 1-
Figure 1-. Yet3 is a pan-ER contact site protein
A. Overexpressed (OE) Yet3-mScarlet concentrates at many ER contact sites. To visualize the localization of Yet3 at contacts using fluorescence microscopy, various split-Venus reporters were used: ER-Peroxisomes (Pex) reporter (Snd3-VN/Pex25-VC); ER-Lipid droplets (LD) reporter (Snd3-VN/Faa4-VC); ER-Plasma membrane (PM) reporter (Snd3-VN/Ina1-VC); ER-Mitochondria (Mito) reporter (Snd3-VN/Tom20-VC) and ER-Vacuole (Vac) reporter (Snd3-VN/Zrc1-VC). White arrows show areas of co-localization between Yet3 puncta and the indicated reporter signals. Strains were imaged with a 100x oil lens. Scale bar, 5μm. B. Overexpressed (OE) Yet3-GFP localizes to contact sites in the absence of a synthetic reporter. Marker proteins (Pex7 and Tgl3 for Pex or LDs, respectively), and tether proteins (Tcb2 and Lam2 in the ER-PM contact, Lam6 and Mmm1 in the ER-Mito contact, Nvj1 and Nvj2 in the ER-Vac contact, Num1 and Mdm36 in the ER-mitochondria-plasma membrane (MECA) contact), were expressed under a constitutive promoter and tagged with mCherry on their N’. White arrows mark areas of co-localization between the Yet3 puncta and the mCherry tagged proteins. Strains were imaged with a 100x oil lens. Scale bar, 5μm. C. Correlated Light and Electron Microscopy (CLEM) images showing that Yet3 localizes to both ER-mitochondria (Mito) and ER-plasma membrane (PM) contacts. The yellow arrows point to the contact site between the ER tubule and the indicated organelle, where the Yet3-GFP signal is bright. Scale bar, 500nm.
Figure 2-
Figure 2-. Yet3 levels affect organelles in an Opi1-independentmanner
A. Microscopy images highlighting how multiple organelles are affected by overexpression (OE) of Yet3. In strains that overexpress Yet3, peroxisome number (marked using Pex3-mCherry) increased, while LD number (marked with Tgl3-mCherry) decreased. The vacuoles (dyed with FM4-64) and mitochondria (shown by Tom20-mCherry) appear enlarged. The mean number of peroxisomes and LDs per cell was quantified and is presented in yellow at the bottom of each image, with standard error of mean. The mean of the vacuole area per cell was quantified and is presented in yellow at the bottom of the image, with standard error of mean. The differences were statistically significant using a two-tailed t-test, ****p ≤ 0.0001. In the peroxisome analysis, N=5188, 7090 for control and OE Yet3 respectively. In the LD analysis, N= 5648, 6378 for control and OE Yet3 respectively. In the vacuole analysis, N= 6734, 6378 for control and OE Yet3 respectively. Cells were imaged with a 60x oil lens. Scale bar, 5μm B. HeLa S3 cells display a decreased number of LDs following overexpression (OE) of the human homolog of Yet3, BAP31. HeLa S3 cells were transfected with either P2A-GFP plasmid as a control or BAP31-GFP plasmid for overexpressing BAP31. LDs were visualized using BODIPY red, and Hoechst dye was used for nuclear staining in blue. Shown are representative images from three replicates. Cells were imaged using a 63x glycerol lens. Scale bar, 10μm. C. Increased expression of Yet3 does not cause mis-localization of Opi1. On the background of Yet3 overexpression (OE) or knockout (KO), Opi1-GFP consistently enters the nucleus when inositol is present. Depletion of inositol from the media showed an Opi1-GFP signal on the nuclear membrane in both control and Yet3 overexpression. However knockout of Yet3 led to Opi1 accumulating inside the nucleus as expected. All strains were imaged with a 60x oil lens. Scale bar, 5μm. D. Increased levels of Opi1 in inositol-containing media did not rescue the phenotypes of overexpressed (OE) Yet3. Mitochondria were visualized by Tom20-GFP and LDs using Tgl3-GFP. Images were taken using a 60x oil lens. Scale bar, 5μm. E. Knockout (KO) of OPI1 does not mimic the Yet3 overexpression (OE) phenotypes. Mitochondria were imaged using Mitotracker Orange and LDs by using the blue MDH dye. Images were taken using a 60x oil lens. Scale bar, 5μm.
Figure 3-
Figure 3-. Yet3 interacts with the post-squalene ergosterol biosynthesis machinery, affecting sterol distribution in the cell
A. Ergosterol biosynthesis proteins are enriched as interactors of Yet3. A volcano plot showing −log(p-value) vs. log2(fold-change) of changes observed following Immunoprecipitation-Mass Spectrometry (IP-MS) to identify peptides of interacting proteins when compared to an overexpressed Tom20-GFP control. Highlighted are enriched interactors of overexpressed Yet3-GFP. Ergosterol biosynthesis proteins, shown in red, are both enriched and are statistically significant (*p ≤ 0.05). Yet3 itself is represented by a purple dot, while Yet1 is represented in a blue dot. Shown are average enrichment values from biological triplicates. B. Yet3 expression levels affect the distribution of plasma membrane sterols. mCherry-D4H, a reporter for free ergosterols, was expressed on the background of control, overexpressed (OE) Yet3 and Yet3 knockout (KO) strains, demonstrating altered sterol distribution in the cell. All samples were imaged with a 100x oil lens. Scale bar, 5μm. C. Overexpression (OE) of Yet3 sensitized cells to the ergosterol-biosynthesis inhibiting drug, fluconazole. Drop dilution assay of control and overexpressed Yet3 strains grown on control (Untreated) or Fluconazole (20ug/ml) containing media. Images were acquired after three days at 30°C. A representative image from three replicates is shown. D. The transcriptional activator of ergosterol biosynthesis, Upc2, enters the nucleus upon overexpression (OE) of Yet3. Upc2, known to translocate from the cytosol to the nucleus upon sensing a reduction in PM ergosterols, was tagged with GFP on its C’ to visualize its cellular localization by fluorescence microscopy using a 60x oil lens. Scale bar, 5μm. E. mRNAs of ergosterol biosynthesis enzymes are upregulated in strains overexpressing Yet3 compared to control cells. The volcano plot shows −log(p-value) against log2(fold change) of changes recorded using RNA-Seq. Highlighted in red are the post-squalene pathway transcripts, HEM13 is marked in blue and the YET3 mRNA is in purple. Next Generation Sequencing (NGS) was performed in three replicas per strain. F. Oxygen consumption rate (OCR) increases in overexpression (OE) of Yet3 and in the Yet3 knockout (KO). All samples were grown on glucose overnight and transferred to galactose for 24 hours before measuring their basal respiration. Significance of the changes for three independent replicates was tested using two-way ANOVA. ****p ≤ 0.0001. G. Total heme concentration in overexpressed (OE) Yet3 is higher than in control. A porphyrin fluorescence assay was used to measure heme concentration. Significance of the changes for three independent replicates was tested using an unpaired t-test. ***p ≤ 0.001. H. In contrast to mitochondria and the nucleus, cytosolic free heme was reduced in overexpression (OE) of Yet3. Unbound heme concentration was measured using the Heme Sensor1 (HS1). HS1 levels of heme were measured by heme dependent fluorescence emission compared to an independent fluorophore by percentage. The HS1 was targeted to the mitochondrial matrix by fusing it to the N’ of Cox4, or to the nucleus by fusing it to the C’ of SV40. Significance of the changes from three independent replicates was tested using two-way ANOVA significance test. ***p ≤ 0.001. ****p ≤ 0.0001.
Figure 4-
Figure 4-. Yet3 recruits the ERGosome to provide on-demand sterols at ER contact sites
A. Yet3 overexpression (OE) alters the localization of post-squalene biosynthesis pathway proteins to specific subdomains on the ER membrane. Constitutively expressed post-squalene proteins tagged with mCherry on their N’ were homogeneously distributed in strains expressing endogenous Yet3-GFP. Upon overexpression of Yet3, they concentrated in ER subdomains that co-localize with Yet3 puncta. The pre-squalene enzyme, mCherry-Hmg1, did not alter its distribution nor concentrate together with overexpressed Yet3 puncta, which demonstrates that this is not an unspecific restructuring of the ER as a whole. Images were taken with a 100x oil lens. Scale bar, 5μm. B. Yet3-GFP containing foci co-localized with sterol-rich areas (measured using the free ergosterol reporter mCherry-D4H), showcasing that internal ergosterol accumulates at contact sites when Yet3 is overexpressed. Strains were imaged with a 100x oil lens. Scale bar, 5μm. C. During conditions of decreased ergosterol abundance in the cell (created by treating the cells with the ergosterol biosynthesis inhibitor Fluconazole), Yet3, expressed under its own promoter, accumulates at ER subdomains. Endogenously expressed Yet3-GFP is homogenously distributed around the ER. Applying Fluconazole (20ug/ml), caused sterol depletion from cells as can be seen by the translocation into the nucleus of Upc2-GFP, a transcription factor that senses ergosterol reduction in the PM and enters the nucleus. Under these conditions, Yet3-GFP also accumulates in subdomains of the ER, while another ER protein, Sec63-GFP, does not change. Strains were imaged in 60x lens. Scale bar, 5μm. D. Yet3 depletion rescues Fluconazole induced cellular alterations. Yeast strains with endogenous (Control), overexpressing (OE) or knocked out (KO) for Yet3 were imaged in regular media or treated with Fluconazole (20ug/ml) to inhibit ergosterol biosynthesis. Fluconazole addition reduced LD number and altered the shape of mitochondria (Mito) in a way that pheno-mimicked the Yet3 overexpression alone. Combined overexpression of Yet3 and growth in fluconazole led to enhanced phenotypes. Importantly, knockout of Yet3 rescued both LD abundance and mitochondrial morphology in cells treated with Fluconazole compared to untreated control cells. Mitochondria were stained with Mitotracker Orange, and LDs were stained using MDH. Strains were imaged in PBS. Scale bar, 5μm. E. BAP31 overexpression alters cholesterol distribution. Confocal images of HeLa S3 cells transfected with an overexpression (OE) BAP31-GFP plasmid, demonstrate changes in cholesterol (visualized using Filipin III dye) distribution in the cell. P2A-GFP plasmid was transfected to HeLa S3 as control. White arrows in cells overexpressing BAP31 indicate co-localization between cholesterol concentrations and BAP31 puncta on the ER. Cells were imaged using a 63x glycerol lens. Scale bar, 10μm.
Figure 5-
Figure 5-. Schematic illustration of our model for Yet3 molecular function.
Yet3 accumulates at ER contact sites and recruits the post-squalene proteins in the ergosterol biosynthesis pathway to create the ERGosome. There, it increases the concentration of ergosterols, which create the sterol rich domains essential for contact formation and function.

Similar articles

Cited by

References

    1. Zung N., & Schuldiner M. (2020). New horizons in mitochondrial contact site research. In Biological Chemistry (Vol. 401, Issue 6). 10.1515/hsz-2020-0133. - DOI - PubMed
    1. Eisenberg-Bord M., Shai N., Schuldiner M., & Bohnert M. (2016). A Tether Is a Tether Is a Tether: Tethering at Membrane Contact Sites. In Developmental Cell (Vol. 39, Issue 4). 10.1016/j.devcel.2016.10.022. - DOI - PubMed
    1. Scorrano L., De Matteis M.A., Emr S., Giordano F., Hajnóczky G., Kornmann B., Lackner L.L., Levine T.P., Pellegrini L., Reinisch K., et al. (2019). Coming together to define membrane contact sites. Nat Commun 10. 10.1038/s41467-019-09253-3. - DOI - PMC - PubMed
    1. Shai N., Yifrach E., Van Roermund C.W.T., Cohen N., Bibi C., Ijlst L., Cavellini L., Meurisse J., Schuster R., Zada L., et al. (2018). Systematic mapping of contact sites reveals tethers and a function for the peroxisome-mitochondria contact. Nat Commun 9. 10.1038/s41467-018-03957-8. - DOI - PMC - PubMed
    1. Bernhard W., and Rouiller C. (1956). Close topographical relationship between mitochondria and ergastoplasm of liver cells in a definite phase of cellular activity. J Biophys Biochem Cytol 2, 73–78. 10.1083/JCB.2.4.73. - DOI - PMC - PubMed

Publication types