

This is a preprint.
Resting state brain network segregation is associated with walking speed and working memory in older adults
- PMID: 38766046
- PMCID: PMC11100712
- DOI: 10.1101/2024.05.07.592861
Resting state brain network segregation is associated with walking speed and working memory in older adults
Update in
-
Resting state brain network segregation is associated with walking speed and working memory in older adults.Neuroimage. 2025 Apr 15;310:121155. doi: 10.1016/j.neuroimage.2025.121155. Epub 2025 Mar 16. Neuroimage. 2025. PMID: 40101865
Abstract
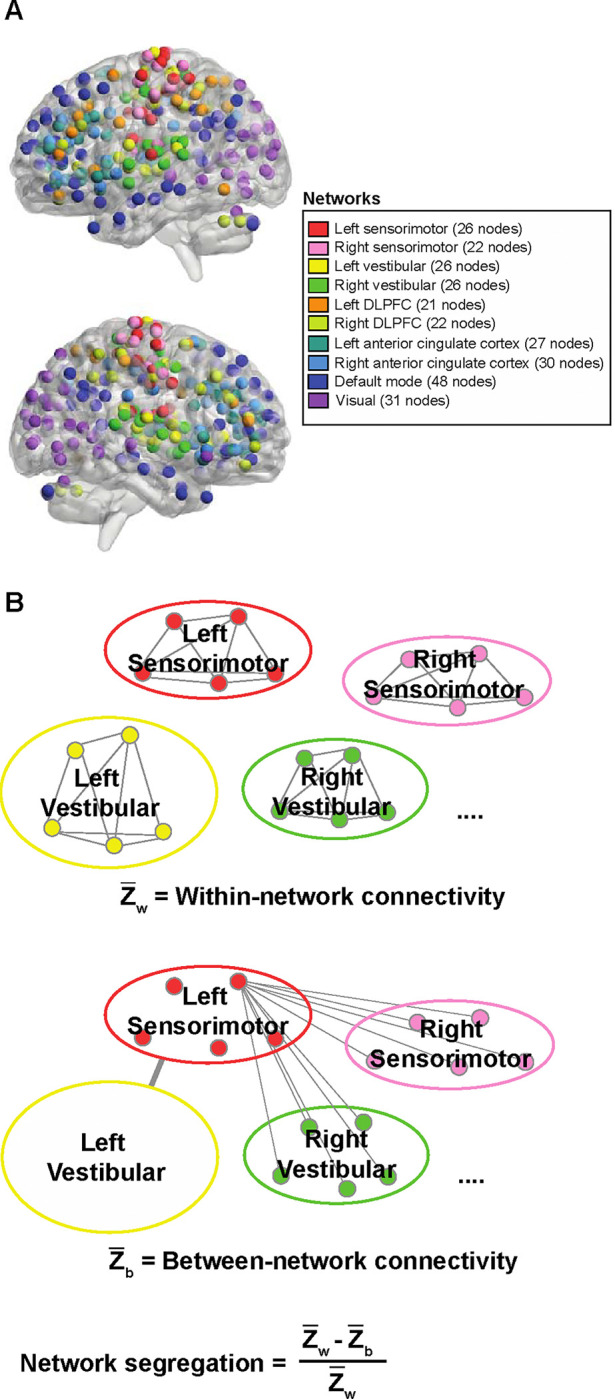
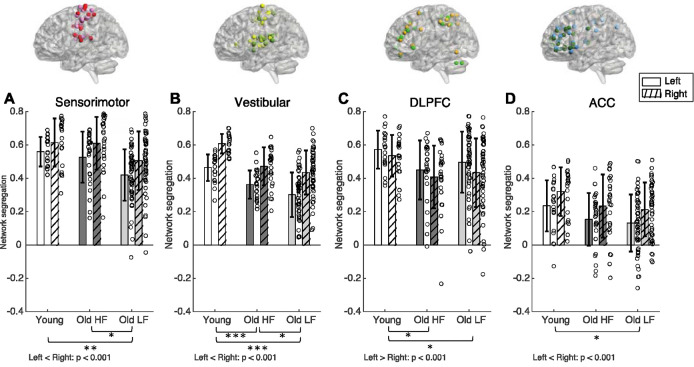
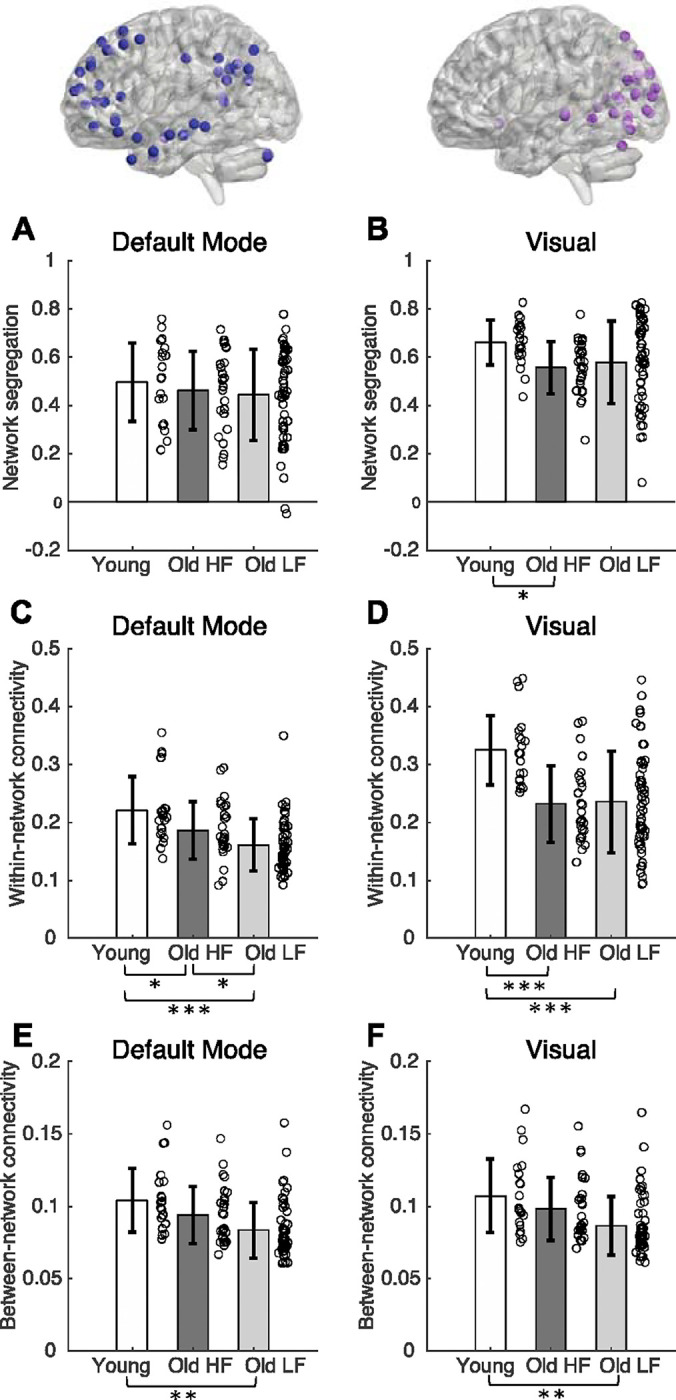
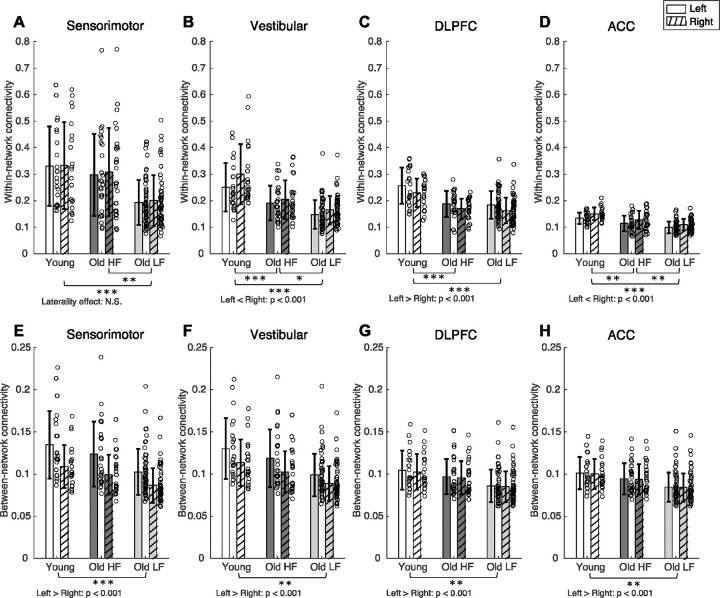
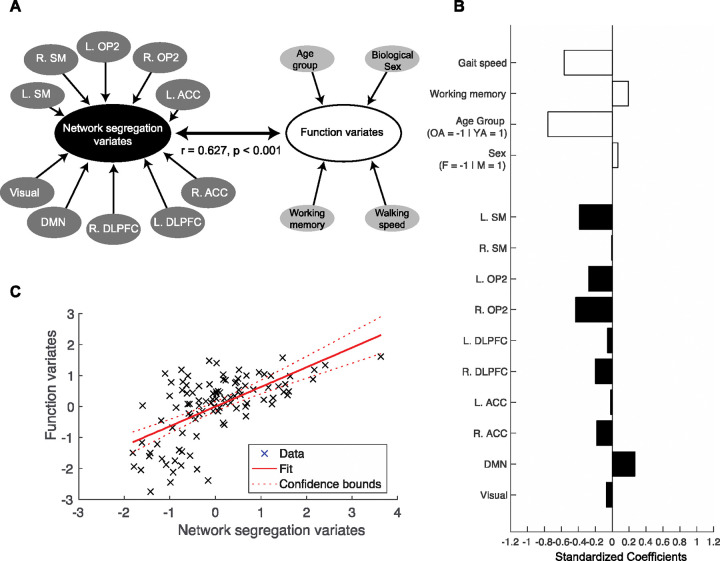
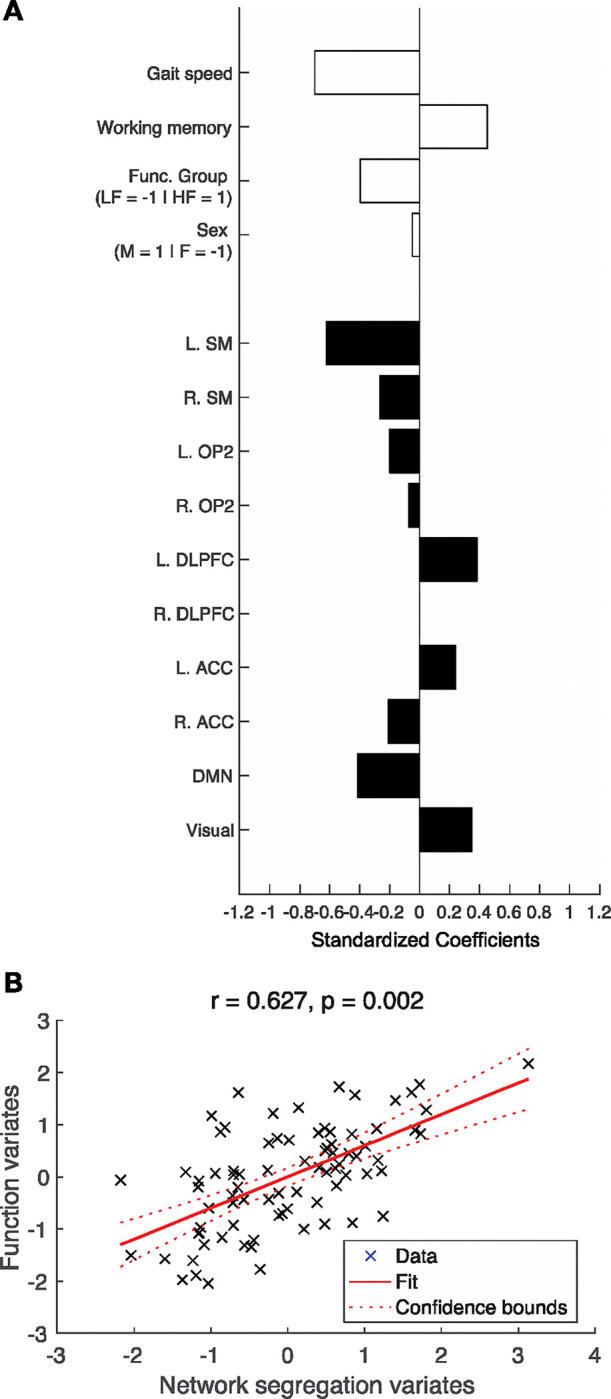
Older adults exhibit larger individual differences in walking ability and cognitive function than young adults. Characterizing intrinsic brain connectivity differences in older adults across a wide walking performance spectrum may provide insight into the mechanisms of functional decline in some older adults and resilience in others. Thus, the objectives of this study were to: (1) determine whether young adults and high- and low-functioning older adults show group differences in brain network segregation, and (2) determine whether network segregation is associated with working memory and walking function in these groups. The analysis included 21 young adults and 81 older adults. Older adults were further categorized according to their physical function using a standardized assessment; 54 older adults had low physical function while 27 were considered high functioning. Structural and functional resting state magnetic resonance images were collected using a Siemens Prisma 3T scanner. Working memory was assessed with the NIH Toolbox list sorting test. Walking speed was assessed with a 400 m-walk test at participants' self-selected speed. We found that network segregation in mobility-related networks (sensorimotor, vestibular) was higher in older adults with higher physical function compared to older adults with lower physical function. There were no group differences in laterality effects on network segregation. We found multivariate associations between working memory and walking speed with network segregation scores. The interaction of left sensorimotor network segregation and age groups was associated with higher working memory function. Higher left sensorimotor, left vestibular, right anterior cingulate cortex, and interaction of left anterior cingulate cortex network segregation and age groups were associated with faster walking speed. These results are unique and significant because they demonstrate higher network segregation is largely related to higher physical function and not age alone.
Keywords: Functional connectivity; aging; behavior; fMRI; resting state; segregation.
Conflict of interest statement
Disclosure of competing interests: None.
Figures
Similar articles
-
Resting state brain network segregation is associated with walking speed and working memory in older adults.Neuroimage. 2025 Apr 15;310:121155. doi: 10.1016/j.neuroimage.2025.121155. Epub 2025 Mar 16. Neuroimage. 2025. PMID: 40101865
-
Falls prevention interventions for community-dwelling older adults: systematic review and meta-analysis of benefits, harms, and patient values and preferences.Syst Rev. 2024 Nov 26;13(1):289. doi: 10.1186/s13643-024-02681-3. Syst Rev. 2024. PMID: 39593159 Free PMC article.
-
Surgical interventions for treating extracapsular hip fractures in older adults: a network meta-analysis.Cochrane Database Syst Rev. 2022 Feb 10;2(2):CD013405. doi: 10.1002/14651858.CD013405.pub2. Cochrane Database Syst Rev. 2022. PMID: 35142366 Free PMC article.
-
Systemic pharmacological treatments for chronic plaque psoriasis: a network meta-analysis.Cochrane Database Syst Rev. 2017 Dec 22;12(12):CD011535. doi: 10.1002/14651858.CD011535.pub2. Cochrane Database Syst Rev. 2017. Update in: Cochrane Database Syst Rev. 2020 Jan 9;1:CD011535. doi: 10.1002/14651858.CD011535.pub3. PMID: 29271481 Free PMC article. Updated.
-
Signs and symptoms to determine if a patient presenting in primary care or hospital outpatient settings has COVID-19.Cochrane Database Syst Rev. 2022 May 20;5(5):CD013665. doi: 10.1002/14651858.CD013665.pub3. Cochrane Database Syst Rev. 2022. PMID: 35593186 Free PMC article.
Cited by
-
Mediterranean diet and brain functional connectivity in a population without dementia.Front Neuroimaging. 2024 Dec 6;3:1473399. doi: 10.3389/fnimg.2024.1473399. eCollection 2024. Front Neuroimaging. 2024. PMID: 39713787 Free PMC article.
References
-
- Abellan van Kan G., Rolland Y., Andrieu S., Bauer J., Beauchet O., Bonnefoy M., Cesari M., Donini L.M., Gillette Guyonnet S., Inzitari M., Nourhashemi F., Onder G., Ritz P., Salva A., Visser M., Vellas B., 2009. Gait speed at usual pace as a predictor of adverse outcomes in community-dwelling older people an International Academy on Nutrition and Aging (IANA) Task Force. J Nutr Health Aging 13, 881–889. - PubMed
-
- Aksu S., Indahlastari A., O’Shea A., Marsiske M., Cohen R., Alexander G.E., Dekosky S.T., Hishaw G.A., Dai Y., Wu S.S., Woods A.J., 2024. Effect of transcranial direct current stimulation with cognitive training on executive functions in healthy older adults: a secondary analysis from the ACT trial. Geroscience. - PMC - PubMed
Publication types
Grants and funding
LinkOut - more resources
Full Text Sources