[Preprint]. 2024 May 7:rs.3.rs-4342820.
doi: 10.21203/rs.3.rs-4342820/v1.

The Glucose Transporter 5 Enhances CAR-T Cell Metabolic Function and Anti-tumour Durability

Affiliations

The Glucose Transporter 5 Enhances CAR-T Cell Metabolic Function and Anti-tumour Durability

Bakir Valentić et al. Res Sq. .

Abstract

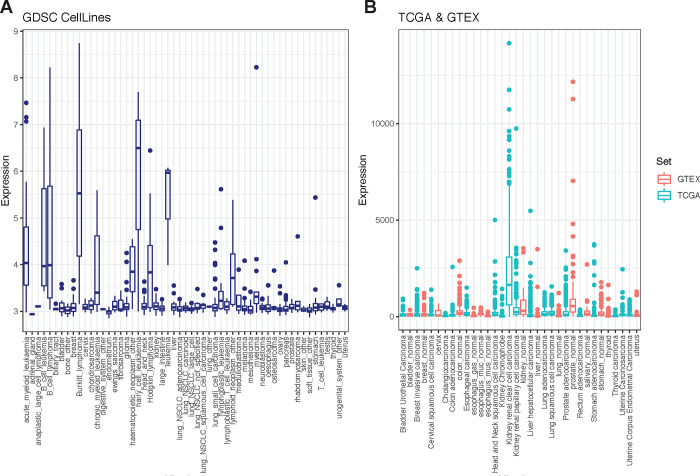
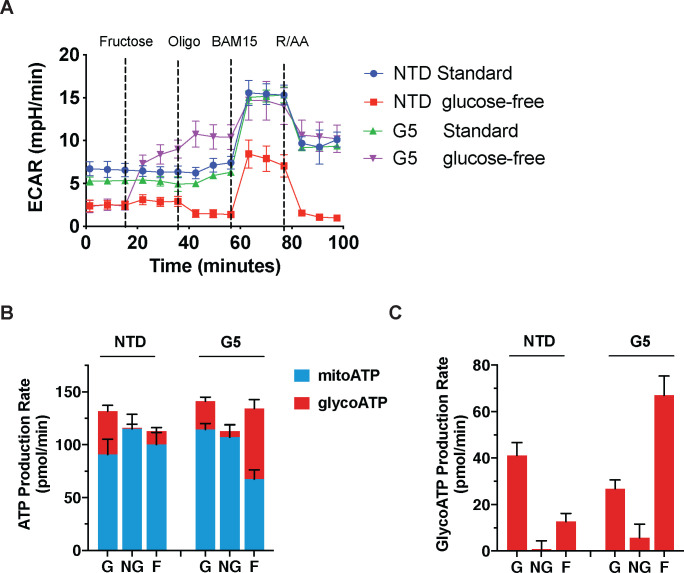
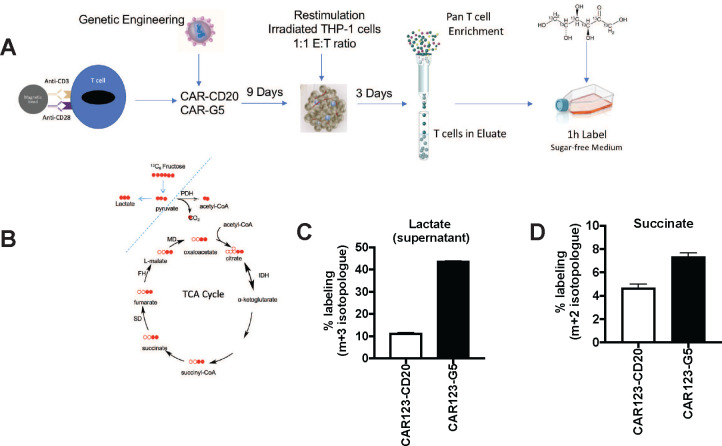
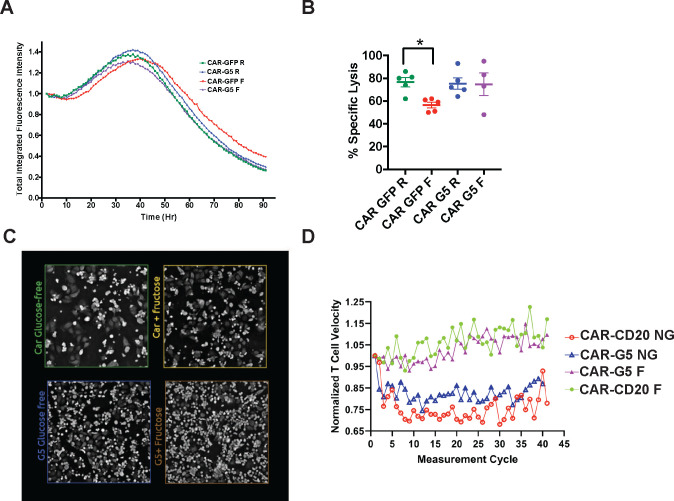
Activated T cells undergo a metabolic shift to aerobic glycolysis to support the energetic demands of proliferation, differentiation, and cytolytic function. Transmembrane glucose flux is facilitated by glucose transporters (GLUT) that play a vital role in T cell metabolic reprogramming and anti-tumour function. GLUT isoforms are regulated at the level of expression and subcellular distribution. GLUTs also display preferential selectivity for carbohydrate macronutrients including glucose, galactose, and fructose. GLUT5, which selectively transports fructose over glucose, has never been explored as a genetic engineering strategy to enhance CAR-T cells in fructose-rich tumour environments. Fructose levels are significantly elevated in the bone marrow and the plasma of acute myeloid leukaemia (AML) patients. Here, we demonstrate that the expression of wild-type GLUT5 restores T cell metabolic fitness in glucose-free, high fructose conditions. We find that fructose supports maximal glycolytic capacity and ATP replenishment rates in GLUT5-expressing T cells. Using steady state tracer technology, we show that 13C6 fructose supports glycolytic reprogramming and TCA anaplerosis in CAR-T cells undergoing log phase expansion. In cytotoxicity assays, GLUT5 rescues T cell cytolytic function in glucose-free medium. The fructose/GLUT5 metabolic axis also supports maximal migratory velocity, which provides mechanistic insight into why GLUT5-expressing CAR-Ts have superior effector function as they undergo "hit-and-run" serial killing. These findings translate to superior anti-tumour function in a xenograft model of AML. In fact, we found that GLUT5 enhances CAR-T cell anti-tumour function in vivo without any need for fructose intervention. Accordingly, we hypothesize that GLUT5 is sufficient to enhance CAR-T resilience by increasing the cells' competitiveness for glucose at physiologic metabolite levels. Our findings have immediate translational relevance by providing the first evidence that GLUT5 confers a competitive edge in a fructose-enriched milieu, and is a novel approach to overcome glucose depletion in hostile tumour microenvironments (TMEs).


Conflict of interest statement

Declaration of Interests ROC reports sponsored research agreements with Poseida Therapeutics outside of the submitted work.

Figures

Figure 1.
Figure 1.. GLUT5 induction is a metabolic adaptation observed in several tumour cells
A) Gene expression of GLUT5 across 1000 human cancer cell lines found in the Genomics of Drug Sensitivity in Cancer (GDSC) database. B) GLUT5 gene expression in various cancer samples (TCGA) and normal human tissue (GTEX) from cBioportal. Tissue is ordered by highest mean expression.
Figure 2.
Figure 2.. Lentiviral-mediated expression of GLUT5 in T cells
GLUT5 expression following lentiviral transduction was determined by immunostaining with an antibody against GLUT5. Nuclei were counterstained with the fluorescent dye Hoechst. No immunostaining was observed with an IgG control (data not shown). Representative data from multiple experiments are shown.
Figure 3.
Figure 3.. GLUT5 confers metabolic flexibility in low glucose conditions
A) Following overnight stimulation with anti-CD3/CD28 Dynabeads, primary human T cells were infected with GLUT5 lentiviral supernatants and expanded for 9 days (NTD: non-transduced controls). These cells were switched to standard (Std) or glucose-free Seahorse assay medium. Metabolic responses to 10 mM fructose, oligomycin, BAM15, as well as rotenone and antimycin A were measured by Seahorse Assay. Representative data (mean +/− SEM) from 3 independent experiments with separate donors are shown. B) Estimated ATP production rates in glucose (G), no-glucose (NG), and fructose (F) conditions. Mitochondrial ATP production (mitoATP) is represented by the blue bar fraction for each group, while glycolytic ATP production (glycoATP) is represented by the red bar fraction for each group. Black error bars indicate SEM. C) Bar graph of glycoATP alone, stylized in the same manner as Panel c. Representative data (mean ± SEM) from several independent experiments with separate donors are shown.
Figure 4.
Figure 4.. The fructose/GLUT5 metabolic axis supports glycolysis and TCA cycle anaplerosis
A) Scheme of experimental design. Activated T cells were transduced with CAR123 expressing either CD20 (control gene) or GLUT5. These cells were expanded for 9 days. At restdown, they were co-cultured with irradiated target cells (mRFP+ THP-1) at a 1:1 E:T ratio. After 3 days, T cells were column purified and transferred into medium containing 10 mM 13C-labelled fructose. After one hour, cells and supernatants were harvested for LC-MS. B) Filled red circles indicate 13C atoms, unfilled red circles 12C atoms into descendent metabolites. C) Funnelling of fructose was quantified as % labelling (y-axis; m+3 isotopologue for lactate, m+2 for succinate). Representative data (mean ± SEM) from two independent experiments with separate donors are shown.
Figure 5.
Figure 5.. GLUT5 rescues CAR T cell cytotoxicity in low-glucose conditions
Activated T cells were transduced with CAR123 co-transduced with GFP or GLUT5. These cells were expanded in standard medium for 8 days. At restdown, they were co-cultured with target cells (mRFP+ THP-1) at an effector:target ratio of 1:1. Cytolytic activity was measured in culture medium with/without glucose, ± fructose using eSight RTCA impedance. A) Normalized total integrated fluorescent intensity (y-axis) was measured over time in hours (Hr, x-axis). Representative images from 4 independent experiments with separate donors are shown. B) Without glucose, CAR GFP has significantly diminished cytolytic activity (* p<0.05 by t-test analysis). GLUT5 restores CAR T cell cytolytic activity when fructose replaces glucose in culture medium. Mean ± SEM values from 4–5 independent experiments with separate donors are shown. R: RPMI standard medium; F: glucose-free RPMI medium supplemented with 10mM fructose.
Figure 6.
Figure 6.. The fructose/GLUT5 metabolic axis supports CAR T cell migratory velocity during serial killing
Activated T cells were transduced with CAR123 co-expressing CD20 or GLUT5. These cells were expanded in standard medium for 7 days. After thaw, these cells were co-cultured with CD123+ target cells at a 1.25:1 CAR+ E:T ratio in glucose-free RPMI supplemented with 2% Physiologix, 2mM glutamine, with/without 10mM fructose. Data are Mean ± SEM values. Automated live cell imaging as well as analysis was performed by Nanolive technology.
Figure 7.
Figure 7.. GLUT5 potentiates CD123-CAR T cells anti-tumour function in vivo
A) Adult NSG mice were infused by tail vein injection with 1 × 10⁶ luciferase-expressing MOLM14 tumour cells (day 0). On day 7, the mice received 0.5 × 10⁶ CAR+ T cells in PBS via tail vein. T cells expressed tumour targeting CD123 CAR constructs (CAR) co-expressing CD20 or GLUT5. Non-transduced (NTD) T cells were used as a control. The mice were intraperitoneally injected with either sterile PBS (black dots) or with 10% w/v fructose in PBS (purple dots). Treatments are stylized the same in all panels. B) Absolute fructose levels 30 min following IP injection are shown (n=4 mice per condition; p<0.05 by Student t-test analysis). C) Serial quantification of tumour burden in Molm14 tumour-bearing mice treated with CAR T cells. Data are means ± SEM from starting cohorts (n=12 for tumour alone; n= 5 for NTD; n=8 mice for CAR-CD20; and n=10 for CAR-GLUT5). Tumor volume was compared across CAR groups by two-way ANOVA with Holm-Sidak post hoc analysis. * indicates tumor volume is statistically lower in CAR G5 at day 48 post T cell injection (p<0.05). D) Blood harvested on day 13 by retro-orbital puncture was stained with an antibody against human CD45 in TrueCount tubes to detect adoptively transferred T cells. Data are CD45+T cells per μL blood. Individual mice plus cohort means ± SEM are shown. Circulating T cells are significantly enhanced in CAR GLUT5 relative to CAR GFP (p<0.05 by one way ANOVA with Newman-Keuls multiple comparisons test). E) Tumor volume was compared across groups by one way ANOVA with Newman-Keuls multiple comparisons test. * indicates tumour volume is statistically less in CAR− GLUT5 from CAR-CD20 GLUT5 (p<0.05). Individual mice plus cohort means ± SEM are shown for days 17, 27, and 48. F) Survival proportions of Molm14 tumour-bearing mice in each treatment cohort. Mice with BLI measurements over 1×10¹⁰ photon flux (p/s) were sacrificed. Analysis with log rank (Mantel-Cox) testing demonstrated that GLUT5 is significantly different than the standard CAR (p<0.05). Two independent experiments with GLUT5-expressing, CD123-specific CAR T cells were performed. B cells are a potential source of fructose in AML tumor environment A) UMAP projection shows lineage-specific SORD expression in the bone marrow of AML patients. Representative data from 5 AML patients undergoing CD123 CAR therapy at Penn are shown. Cells are colour-coded to distinguish SORD expression across lineages. Phenotypic markers distinguish hematopoietic (PTPRC=CD45), plasma cells (TNFRSF17=BCMA), and B cells (CD19). SORD is most abundant in CD19+ B cells. B) GLUT5 gene expression in blood cells at various stages of their development. Data was generated from the cBioportal resource.

Similar articles

References

    1. June C. H., O’Connor R. S., Kawalekar O. U., Ghassemi S. & Milone M. C. CAR T cell immunotherapy for human cancer. Science 359, 1361–1365 (2018). - PubMed
    1. Kawalekar O. U. et al. Distinct Signalling of Coreceptors Regulates Specific Metabolism Pathways and Impacts Memory Development in CAR T Cells. Immunity 44, 380–390 (2016). - PubMed
    1. Chen W. L. et al. Enhanced Fructose Utilization Mediated by SLC2A5 Is a Unique Metabolic Feature of Acute Myeloid Leukaemia with Therapeutic Potential. Cancer Cell 30, 779–791 (2016). - PMC - PubMed
    1. Jeong S. et al. High Fructose Drives the Serine Synthesis Pathway in Acute Myeloid Leukemic Cells. Cell Metab 33, 145–159.e6 (2021). - PMC - PubMed
    1. Chen C. et al. ATF4-dependent fructolysis fuels growth of glioblastoma multiforme. Nat Commun 13, 6108 (2022). - PMC - PubMed

Publication types

LinkOut - more resources