[Preprint]. 2024 May 12:2024.05.10.593652.
doi: 10.1101/2024.05.10.593652.

Naturalistic acute pain states decoded from neural and facial dynamics

Affiliations

Naturalistic acute pain states decoded from neural and facial dynamics

Yuhao Huang et al. bioRxiv. .

Update in

Abstract

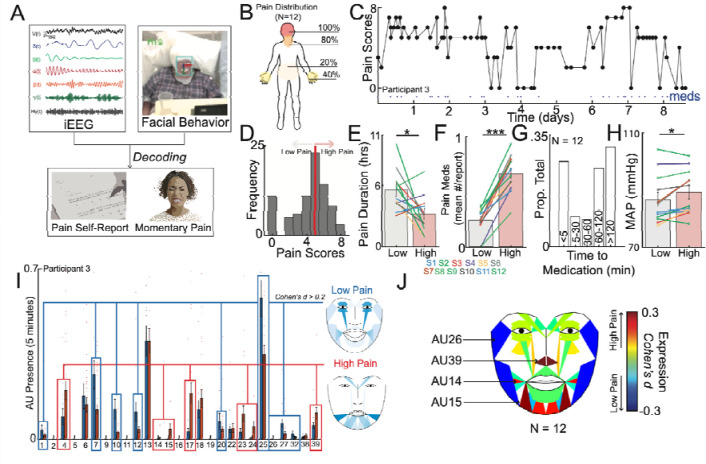
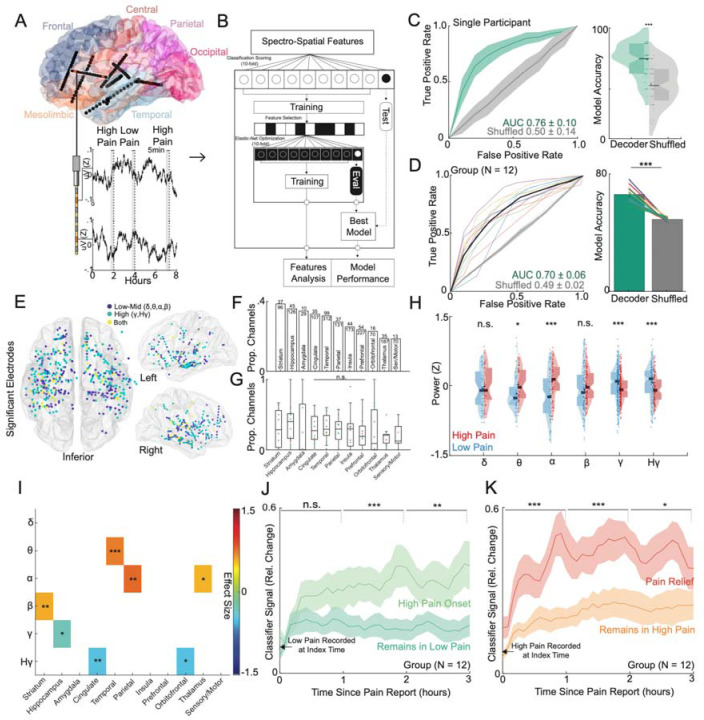
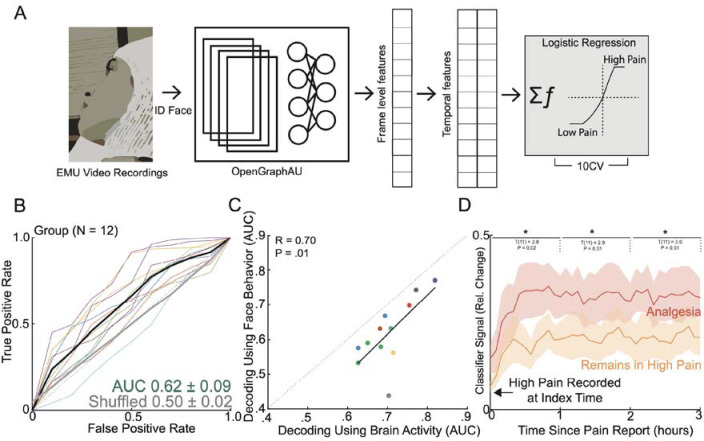
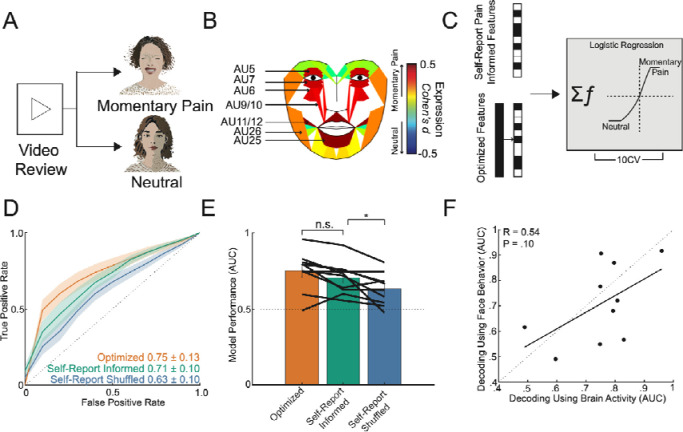
Pain is a complex experience that remains largely unexplored in naturalistic contexts, hindering our understanding of its neurobehavioral representation in ecologically valid settings. To address this, we employed a multimodal, data-driven approach integrating intracranial electroencephalography, pain self-reports, and facial expression quantification to characterize the neural and behavioral correlates of naturalistic acute pain in twelve epilepsy patients undergoing continuous monitoring with neural and audiovisual recordings. High self-reported pain states were associated with elevated blood pressure, increased pain medication use, and distinct facial muscle activations. Using machine learning, we successfully decoded individual participants' high versus low self-reported pain states from distributed neural activity patterns (mean AUC = 0.70), involving mesolimbic regions, striatum, and temporoparietal cortex. High self-reported pain states exhibited increased low-frequency activity in temporoparietal areas and decreased high-frequency activity in mesolimbic regions (hippocampus, cingulate, and orbitofrontal cortex) compared to low pain states. This neural pain representation remained stable for hours and was modulated by pain onset and relief. Objective facial expression changes also classified self-reported pain states, with results concordant with electrophysiological predictions. Importantly, we identified transient periods of momentary pain as a distinct naturalistic acute pain measure, which could be reliably differentiated from affect-neutral periods using intracranial and facial features, albeit with neural and facial patterns distinct from self-reported pain. These findings reveal reliable neurobehavioral markers of naturalistic acute pain across contexts and timescales, underscoring the potential for developing personalized pain interventions in real-world settings.


Figures

Figure 1:
Figure 1:. Naturalistic study design and inpatient tracking of acute pain states.
A) The naturalistic paradigm comprises recording intermittent verbal pain self-report along with simultaneous intracranial electroencephalography (iEEG) and patient videos. Transient episodes of momentary pain are manually annotated based on video review. iEEG spectro-spatial features and quantitative facial dynamics are used to decode acute pain states. B) Group-level anatomical distribution of self-reported pain locations (N = 12). C) Variations in pain scores for an example participant over the course of nine days. Dots denote time when a pain medication was given. D) Histogram of all recorded pain scores for the same example participant. The median value was used to denote the threshold to define low versus high acute pain states. E) Amount of time spent in low versus high pain states based on consecutive pain reports that are of the same state. Participants overall spent less time in the high pain state compared to the low pain state (paired t-test; t(11): 2.6, P=0.02). F) More pain medications were given during the high pain state compared to the low pain state (paired t-test; t(11): 10.1, P<.001). G) Distribution of pain medication timing with relations to time of pain report. H) Higher mean arterial pressure (MAP) across participants was observed in the high pain state as compared to the low pain state (paired t-test: t(11): 2.7, P=0.02). I) Proportion of different AUs encountered during high versus low pain states for an example participant. Certain AUs denoting a positive affect are more expressed during low pain states whereas AUs associated with negative affect are more expressed during high pain states. J) Consensus AUs (d > 0.2) across participants which were differentially expressed between acute pain states. Colors represent the effect size between high versus low pain states. *Denotes P < 0.05, **P < 0.01 and *** P < 0.001.
Figure 2:
Figure 2:. Intracranial neural activity sufficient for decoding of self-reported acute pain states are spatially distributed, temporally stable and modulated by pain onset or pain relief.
A) Location of implanted depth electrodes in an example participant. Traces of raw voltage recording are shown for the two-colored electrodes over an 8-hour period, during which three self-reported pain scores were recorded. Five minutes prior to each pain score are used to construct spectro-spatial features. B) Spectro-spatial features are subsequently used to train an Elastic-Net regularized logistic regression model to classify between low versus high pain states. A nested cross-validation design is used to optimize hyperparameter selection and prevent overfitting. C) Left Panel: Mean receiver operating characteristics (ROC) curve for the same example participant for self-reported pain state classification across cross-validation folds and bootstraps. The grey curve represents the ROC curve when the outcome label is randomly shuffled. The shaded error bar represents the s.e.m across cross-validation folds and bootstraps. Right Panel: Accuracy of the model in prediction of pain states across folds and bootstraps. Accuracy of the model is significantly higher than the shuffled model (two-sample t-test; P<0.001). D) Left Panel: Group ROC curve for prediction of self-reported pain states across 12 participants. The shaded error bar represents the s.e.m across 12 participants. Right Panel: Accuracy of the model in prediction of pain states across 12 participants. Accuracy of the model is significantly higher than the shuffled model (paired t-test: t(11):10.2, P<0.001). E) Significant electrodes across participant classifiers are shown on a common brain in MNI coordinates. Color indicates whether a low to mid frequency (delta, alpha, theta, beta), high-frequency (gamma, high-gamma) or both type of spectral features were used at that location. F) Bar graph showing the sorted proportion of different anatomical regions recruited by classifiers across participants. G) Box plots showing proportion of different anatomical regions recruited stratified by individual participants. Each color dot represents a single participant. No significant difference was observed in the proportion of recruited electrodes across anatomical regions (Chi-square; χ2 = 7.2, P = 0.70). H) Normalized median distributions of low versus high pain state feature values as stratified by power bands. The median values from high pain states were significantly different from low pain states within theta (two-sample t-test; t(86): 2.41, P=0.02), alpha (t(138): 4.81, P<0.001), gamma (t(510): 3.25, P<0.001) and high gamma (t(234): 3.21, P<0.001) power bands. I) Heatmap displaying the power-region feature pairs that demonstrate a consistent effect size between high and low pain states (one-sample t-test; Single asterisk is p<0.05, double asterisk is p<0.01, and triple asterisk is p<0.001; FDR correction for multiple test comparisons). J) Percent change in the index classifier signal overtime when starting in a low pain state and subsequently stratified by if the next pain measurement remains in a low pain state or transitions to a high pain state (pain onset). Greater percent change in classifier signal is observed during pain onset. Shaded error bars represent s.e.m across participants. K) Percent change in the index classifier signal overtime when starting in a high pain state and subsequently stratified by if the next pain measurement remains in a high pain state or transitions to a low pain state (analgesia). Greater percent change in classifier signal is observed during analgesia. Shaded error bars represent s.e.m across participants. Single asterisk is p<0.05, double asterisk is p<0.01, and triple asterisk is p<0.001
Figure 3:
Figure 3:. Facial dynamics underlying acute pain states.
A) To evaluate aspects of behavior during high versus low self-reported pain states, we performed automatic quantification of facial muscle activation on a per-video frame basis. To do this, we devised a custom video processing pipeline where faces were first extracted from a frame, then the participant of interest was isolated from staff and family members using facial recognition, and finally the isolated face embeddings were fed into a pre-trained deep learning model to facial action unit (AU). Frame level AU outputs were collapsed across time to generate temporal statistics, which were subsequently used to decode self-reported pain states in a nested cross-validation scheme. B) Group ROC curves for decoding pain states using facial dynamics quantified during the five-minute window prior to pain report, which is the same time window used for electrophysiological pain decoding. Lines represent participants while the shaded gray error bar represents the decoding performance when the outcome label was shuffled. C) Performance of decoding based on facial dynamics is directly correlated with decoding based on brain activity (Pearson’s R: 0.70, P=0.01). Given all the points are on the right of the diagonal, brain decoding outperforms facial behavioral decoding for all participants. D) Percent change in the index classifier signal overtime when starting in a high pain state and subsequently stratified by if the next pain measurement remains in a high pain state or transitions to a low pain state (analgesia). Greater percent change in classifier signal is observed during analgesia. Shaded error bars represent s.e.m across participants. Single asterisk is p<0.05, double asterisk is p<0.01, and triple asterisk is p<0.001
Figure 4:
Figure 4:. Transient episodes of momentary pain can be decoded using neural and facial activity.
A) Manual video reviews by two evaluators were performed to identify periods of momentary pain and periods of neutral affect. B) Consensus AUs (d > 0.2) across participants which were differentially expressed between periods of momentary pain and periods of neutral affect. Majority of these AUs have been implicated in pain expression previously. Colors represent the effect size between momentary pain and neutral periods. C) Classifiers were trained using the full spectro-spatial feature set (optimized model) and using solely features previously selected by the index pain self-report state classifier (pain self-report informed model). D) ROC curves for prediction of momentary pain from neutral affect across participants, stratified by the optimized model, the pain self-report informed model, and the self-reported pain shuffled model (spectro-spatial features selected from pain self-report state classifier trained on shuffled pain labels). The shaded error bar represents the s.e.m across 10 participants. E) Bar plot comparison of the three trained models. There was no significant difference between the optimized and the pain self-report informed model performance (paired t-test; t(9): 2.0, P=0.07). The pain self-report informed model performed better than using features not supervised to the self-report pain states (paired t-test; t(9): 2.7, P=0.03) F) Comparison of momentary pain decoding based on facial dynamics and neural features.

Similar articles

References

    1. Dahlhamer J. et al. Prevalence of Chronic Pain and High-Impact Chronic Pain Among Adults - United States, 2016. MMWR Morb. Mortal. Wkly. Rep. 67, 1001–1006 (2018). - PMC - PubMed
    1. Di Maio G. et al. Mechanisms of Transmission and Processing of Pain: A Narrative Review. Int. J. Environ. Res. Public Health 20, (2023). - PMC - PubMed
    1. Wager T. D. et al. An fMRI-based neurologic signature of physical pain. N. Engl. J. Med. 368, 1388–1397 (2013). - PMC - PubMed
    1. Čeko M., Kragel P. A., Woo C.-W., López-Solà M. & Wager T. D. Common and stimulus-type-specific brain representations of negative affect. Nat. Neurosci. 25, 760–770 (2022). - PubMed
    1. Picard M.-E. et al. Facial expression is a distinctive behavioural marker of pain processing in the brain. bioRxiv (2023) doi:10.1101/2023.07.26.550504. - DOI

Publication types