[Preprint]. 2024 May 8:rs.3.rs-3243545.
doi: 10.21203/rs.3.rs-3243545/v1.

Programable Albumin-Hitchhiking Nanobodies Enhance the Delivery of STING Agonists to Potentiate Cancer Immunotherapy

Affiliations

Programable Albumin-Hitchhiking Nanobodies Enhance the Delivery of STING Agonists to Potentiate Cancer Immunotherapy

John Wilson et al. Res Sq. .

Update in

  • Potentiating cancer immunotherapies with modular albumin-hitchhiking nanobody-STING agonist conjugates.
    Kimmel BR, Arora K, Chada NC, Bharti V, Kwiatkowski AJ, Finkelstein JE, Hanna A, Arner EN, Sheehy TL, Pastora LE, Yang J, Pagendarm HM, Stone PT, Hargrove-Wiley E, Taylor BC, Hubert LA, Fingleton BM, Gibson-Corley KN, May JC, McLean JA, Rathmell JC, Richmond A, Rathmell WK, Balko JM, Wilson JT. Kimmel BR, et al. Nat Biomed Eng. 2025 Oct;9(10):1719-1739. doi: 10.1038/s41551-025-01400-0. Epub 2025 Jun 11. Nat Biomed Eng. 2025. PMID: 40500332 Free PMC article.

Abstract

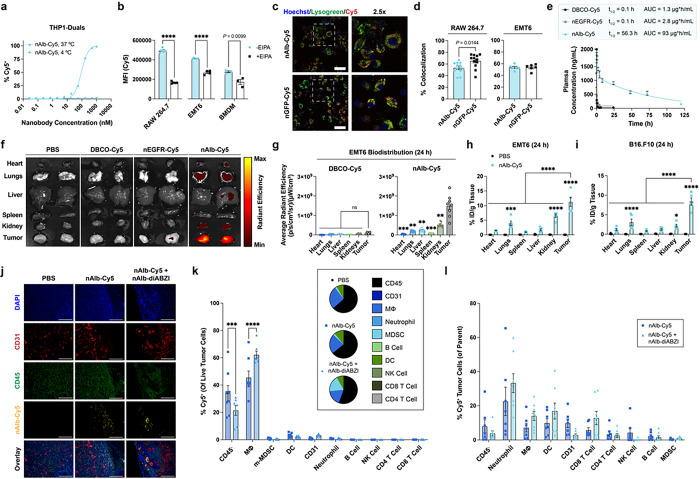
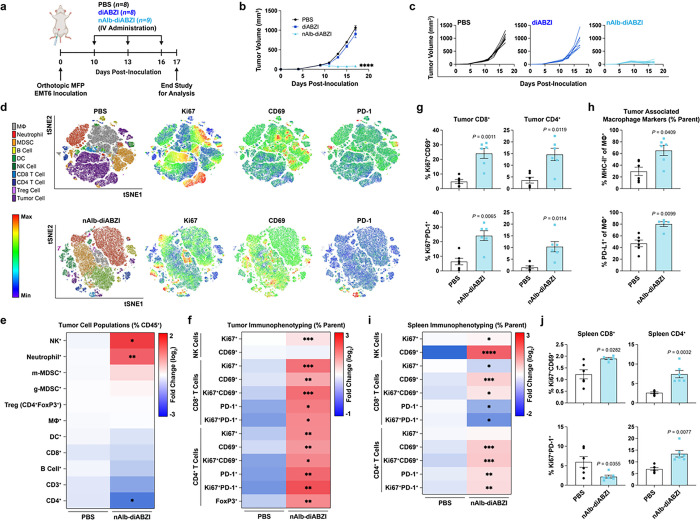
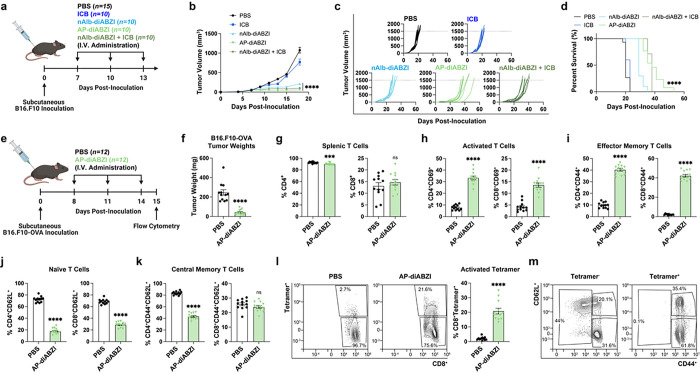
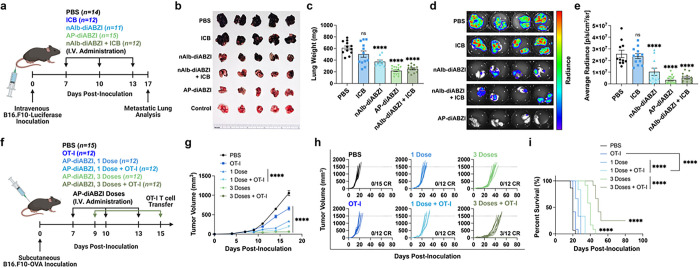
Stimulator of interferon genes (STING) is a promising target for potentiating antitumor immunity, but multiple pharmacological barriers limit the clinical utility, efficacy, and/or safety of STING agonists. Here we describe a modular platform for systemic administration of STING agonists based on nanobodies engineered for in situ hitchhiking of agonist cargo on serum albumin. Using site-selective bioconjugation chemistries to produce molecularly defined products, we found that covalent conjugation of a STING agonist to anti-albumin nanobodies improved pharmacokinetics and increased cargo accumulation in tumor tissue, stimulating innate immune programs that increased the infiltration of activated natural killer cells and T cells, which potently inhibited tumor growth in multiple mouse tumor models. We also demonstrated the programmability of the platform through the recombinant integration of a second nanobody domain that targeted programmed cell death ligand-1 (PD-L1), which further increased cargo delivery to tumor sites while also blocking immunosuppressive PD-1/PD-L1 interactions. This bivalent nanobody carrier for covalently conjugated STING agonists stimulated robust antigen-specific T cell responses and long-lasting immunological memory, conferred enhanced therapeutic efficacy, and was effective as a neoadjuvant treatment for improving responses to adoptive T cell transfer therapy. Albumin-hitchhiking nanobodies thus offer an enabling, multimodal, and programmable platform for systemic delivery of STING agonists with potential to augment responses to multiple immunotherapeutic modalities.

Keywords: STING; adoptive T cell transfer; albumin; cancer; immune checkpoint blockade; immunotherapy; nanobody.


Conflict of interest statement

Competing Interests J.T.W., K.A., and B.R.K. are inventors on U.S. Provisional Application No. 63/472,528 “NANOBODY-DRUG CONJUGATES AND METHODS OF PREPARING THEREOF” which describes nanobody conjugation and delivery technologies. W.K.R. is an employee of Vanderbilt University Medical Center and appointed to the Vanderbilt University School of Medicine. She has received research support from Incyte Corp. within the past three years, and serves on the Board of Scientific Advisors for the National Cancer Institute. J.C.R. is an employee of Vanderbilt University Medical Center and appointed to the Vanderbilt University School of Medicine. He is a founder, scientific advisory board member, and stockholder of Sitryx Therapeutics, a scientific advisory board member and stockholder of Caribou Biosciences and holds stock options for Nirogy Therapeutics. He has consulted and received speaker fees from Merck, Pfizer, and Abbie. He has received research support from Incyte Corp. within the past three years. J.M.B. receives research support from Genentech/Roche and Incyte Corporation, has received advisory board payments from AstraZeneca and Mallinckrodt and is an inventor on patents regarding immunotherapy targets and biomarkers in cancer.

Figures

Figure 1
Figure 1. Design, synthesis, and in vitro characterization of an anti-albumin nanobody for site-selective conjugation of STING agonists.
(a) Scheme depicting the concept of an albumin-hitchhiking nanobody-STING agonist conjugate for cancer immunotherapy. Anti-albumin nanobodies conjugated to STING agonists bind to circulating albumin in situ, resulting in improved pharmacokinetics and increased biodistribution to tumor sites that stimulates antitumor innate and adaptive immune responses. (b) Computational model of the anti-albumin nanobody (nAlb) binding at domain IIB of human serum albumin. (c) Isothermal calorimetry (ITC) traces (top) and binding isotherms (bottom) of nAlb binding to human and mouse serum albumin at pH 7.5. (d) Reaction scheme for generating molecularly homogeneous nAlb conjugates through site-selective enzymatic ligation of an amine-PEG3-azide followed by conjugation of agonist or dye cargo through copper-free click chemistry addition. (e) Structure of diABZI STING agonist conjugated to a DBCO-PEG11 handle for ligation to azide-functionalized nanobodies via click-chemistry. (f) Electrospray ionization mass spectrometry (ESI-MS) and (g) sodium dodecyl sulfate polyacrylamide electrophoresis (SDS-PAGE) demonstrating nanobody conjugate purity and molecular weight. (h-i) Dose-response curves in (h) A549-Dual (n=3) and (i) THP1-Dual IFN-I reporter cell lines (n=3) with estimated EC50 values indicated in the legends. (j) qPCR analysis of gene expression in murine bone marrow derived macrophages (BMDM) treated in vitro with 0.25 μM of free diABZI or nAlb-diABZI conjugate (n=3). P values determined by one-way ANOVA with post-hoc Tukey’s correction for multiple comparisons; *P≤0.05, **P≤0.01, ***P≤0.001, and ****P<0.0001 compared to PBS control. Replicates are noted as biological, and data shown as mean ± SEM.
Figure 2
Figure 2. Anti-albumin nanobodies increase cargo delivery to tumor sites to promote uptake by cancer cells and tumor-associated myeloid cells.
(a) Dose-response curve for nanobody-Cy5 conjugate surface binding and intracellular uptake at 37 °C and 4 °C measured by flow cytometry in EGFR (THP-1) in vitro. (b) Uptake of nAlb-Cy5 (2 μM) in RAW 264.7, EMT6, and BMDM cells with the addition of control PBS (−EIPA) or macropinocytosis inhibitor (+EIPA). (c) Colocalization of Cy5 (red) with lysotracker green (green) and Hoechst (blue) in RAW 264.7 cells with (d) percent colocalization determination for nAlb-Cy5 and nGFP-Cy5 in RAW 264.7 and EMT6 cells. (scale bar: 100 μm) (e) Pharmacokinetics of free DBCO-Cy5 dye and indicated nanobody-Cy5 conjugates injected intravenously at 2 mg/kg in healthy female C57BL/6 mice (n=5). Elimination phase half-life and area under the curve (AUC) are indicated in legend. (f) Representative IVIS fluorescent images of excised tumors and major organs and (g) quantification of average radiant efficiencies 24 h following intravenous administration of vehicle (PBS), DBCO-Cy5, nEGFR-Cy5, and nAlb-Cy5 at 2 mg/kg to female Balb/c mice with orthotopic EMT6 breast tumors (n=5–8). P values determined by one-way ANOVA with post-hoc Tukey’s correction for multiple comparisons; *P≤0.05, **P≤0.01, ***P≤0.001, and ****P<0.0001 compared to the tumor. (h-i) Quantification of percent injected dose per gram of tissue (% ID/g) 24 h following intravenous administration of vehicle (PBS) and nAlb-Cy5 at 2 mg/kg to (h) female Balb/c mice with orthotopic EMT6 breast tumors (n=5) and (i) female C57BL/6 mice with subcutaneous B16.F10 tumors (n=5). P values determined by two-way ANOVA with post-hoc Tukey’s correction for multiple comparisons; *P≤0.05, **P≤0.01, ***P≤0.001, and ****P<0.0001. (j) Representative fluorescent microscopy images of tumor sections stained for DAPI (blue), CD45 (green), and CD31 (red) 24 h following administration of nAlb-Cy5 (yellow) alone or in combination with nAlb-diABZI (scale bar: 200 μm). (k-l) Flow cytometric analysis of nAlb-Cy5 cellular uptake by in EMT6 tumors evaluated as (k) the percentage of indicated cell type comprising all Cy5+ live cells or (l) as the percentage of Cy5+ cells within an indicated live cell population 24 h following administration of vehicle (PBS), nAlb-Cy5 alone, or nAlb-Cy5 co-administered with nAlb-diABZI; median fluorescent intensities (MFI) for each cell population is shown in Fig. S12 (n=7–8). Inset: percentage of indicated cell population in the tumor as measured by flow cytometry. DC: dendritic cell; Mj: macrophage; MDSC: myeloid derived suppressor cell; NK: natural killer cell. P values determined by one-way ANOVA with post-hoc Tukey’s correction for multiple comparisons; *P≤0.05, **P≤0.01, ***P≤0.001, and ****P<0.0001 compared to PBS control. Replicates are noted as biological, and data shown as mean ± SEM.
Figure 3
Figure 3. Albumin-hitchhiking STING agonist inhibits breast tumor growth by shifting the immunocellular profile of the TME.
(a) Schematic of EMT6 tumor inoculations, treatment schedule, and study end point for gene expression and flow cytometry analysis. (b) Tumor growth curves, and (c) spider plots of individual tumor growth curves for each mice with EMT6 tumors treated as indicated (n=8–9). SEM with P value determined by two-way ANOVA with post-hoc Tukey’s correction for multiple comparisons; ****P<0.0001 on day 17 for all groups compared to PBS. (d-j) Flow cytometric analysis of breast tumors and spleen 24 h following final dose of nAlb-diABZI. (d) tSNE plots of live cells in EMT6 tumors colored by cell population with relative expression level of Ki67, CD69, and PD-1 as indicated on heat map. DC: dendritic cell; Mj: macrophage; NK: natural killer cell; MDSC: myeloid-derived suppressor cell. (e-f) Heat maps summarizing (e) the fold change in the percentage of indicated cell population and (f) fold change in the frequency of NK cells, CD8+ T cells, and CD4+ T cells expressing the indicated marker or marker combination in EMT6 breast tumors. (g) Quantification of Ki67+CD69+ and Ki67+PD1+ CD8+ and CD4+ T cells in EMT6 tumors following treatment with vehicle (PBS) or nAlb-diABZI. (h) Quantification of frequency of MHC-II+ and PD-L1+ macrophages in EMT-6 tumors following treatment with vehicle (PBS) or nAlb-diABZI. (i) Heat map summarizing fold change in the frequency of NK cells, CD8+ T cells, and CD4+ T cells expressing activation markers within splenic populations. *P≤0.05, **P≤0.01, ***P≤0.001, and ****P<0.0001 indicate a statistically significant difference for heat-maps between PBS and AP-diABZI treated groups as determined by two-way ANOVA. (j) Quantification of Ki67+CD69+ and Ki67+PD1+ CD8+ and CD4+ T cells in spleens. *P≤0.05, **P≤0.01, ***P≤0.001, and ****P<0.0001 indicate a statistically significant difference between PBS and nAlb-diABZI treated groups as determined by Student’s t-test, n = 6 per group. Replicates are noted as biological, and data shown as mean ± SEM.
Figure 4
Figure 4. Design, synthesis, and testing of bivalent nanobody-STING agonist conjugate for albumin-hitchhiking and targeting of PD-L1.
(a) Scheme for the cloning, expression, and bioconjugation of small molecule cargo to generate the AP-diABZI conjugate. (b) SDS-PAGE and (c) ESI-MS confirming the purity and molecular weight of AP conjugates. (d-e) Dose-response curves for indicated nanobody-diABZI conjugate in (d) A549-Dual (n=3) and (e) THP1-Dual IFN-I reporter cell lines (n=3) with estimated EC50 values indicated in the legends. (f) qPCR analysis of genes associated with STING activation in bone marrow derived macrophages (BMDMs) in response to treatment at discrete time points (0, 0.5, 1, 2, 3, 4, 6, 8, 24 h) with indicated agonist at 0.25 μM (n=3). P values determined by one-way ANOVA with post-hoc Tukey’s correction for multiple comparisons; *P≤0.05, **P≤0.01, ***P≤0.001, and ****P<0.0001 compared to PBS control. (g-h) Dose response curve for nAlb-Cy5 and AP-Cy5 conjugate surface binding and intracellular uptake at 37 °C and 4 °C measured by flow cytometry in (g) B16.F10 cells (n=2–3) and (h) EMT6 cells (n=3). (i) Mean fluorescent intensity (MFI) for nAlb-Cy5 and AP-Cy5 conjugate surface binding at 2 μM compared to PBS (0 μM) for EMT6 W.T. and EMT6 PD-L1 K.O. cell lines at 37 °C. (j) Pharmacokinetics of indicated nanobody-Cy5 conjugate in healthy Balb/c female mice (n=5). Elimination phase half-life and area under the curve (AUC) are indicated in legend. (k) Representative IVIS fluorescent images of excised tumors and major organs (left) and quantification of average radiant efficiencies (right) of tumors and major organs 48 h after administration of nPD-L1-Cy5 and AP-Cy5 in mice with EMT6 breast tumors (n=3–4). P values determined by one-way ANOVA with post-hoc Tukey’s correction for multiple comparisons; *P≤0.05, **P≤0.01, ***P≤0.001, and ****P<0.0001 compared to the tumor group. (l) Comparison of Cy5 radiant efficiencies in tumor tissue 48 h following administration of indicated nanobody-Cy5 conjugate. P values determined by one-way ANOVA with post-hoc Tukey’s correction for multiple comparisons; *P≤0.05, **P≤0.01, ***P≤0.001, and ****P<0.0001 compared to the PBS control, as well as between nAlb-Cy5 and AP-Cy5. (m) Representative IVIS fluorescent images of excised tumors and major organs (left) and quantification of average radiant efficiencies (right) of tumors and major organs 48 h after administration of AP-Cy5 in mice with EMT6 W.T. and EMT6 PD-L1 K.O. breast tumors (n=5). P values determined by one-way ANOVA with post-hoc Tukey’s correction for multiple comparisons; *P≤0.05, **P≤0.01, ***P≤0.001, and ****P<0.0001 compared to the tumor group. Replicates are noted as biological, and data shown as mean ± SEM.
Figure 5
Figure 5. Systemic administration of AP-diABZI conjugates enhance antitumor immune and therapeutic responses in EMT6 breast cancer model.
(a) Schematic of EMT6 tumor inoculation and treatment schedule (n=10). Anti-PD-L1 IgG (ICB) was injected I.P. at 100 μg and all nanobodies were injected I.V. at 1.25 μg of diABZI per injection. (b) Tumor growth curves, (c) spider plots of individual tumor growth curves, and (d) Kaplan-Meier survival plots for mice with EMT6 tumors treated as indicated. CR = complete responder; SEM with P value determined by two-way ANOVA with post-hoc Tukey’s correction for multiple comparisons; ****P<0.0001 on day 22 for all groups compared to PBS. Endpoint criteria of 1500 mm3 tumor volume with P value was determined by log-rank test; ****P<0.0001 compared to PBS control. (e) Spider plots of individual tumor growth curves and (f) Kaplan-Meier survival curves of mice challenged or re-challenged (complete responders after first treatment regimen) with EMT6 cells (n=9–10). (g) Scheme of EMT6 W.T. and EMT6 PD-L1 K.O. tumor inoculation and treatment schedule (n=5–13). AP-diABZI was injected I.V. at 1.25 μg of diABZI. (h) Kaplan-Meier survival plots for mice with EMT6 W.T. or PD-L1 K.O. tumors treated as indicated. (i-j) Volcano plots representing significance (−log10) and fold change (log2) for gene expression analysis in (i) nAlb-diABZI vs. PBS (n=4) and (j) AP-diABZI vs. PBS (n=4). (k-m) Heat maps of NanoString gene cluster matrices showing Z score fold changes for (k) functional gene annotations, (l) biological signatures, and (m) cell types. Replicates are noted as biological, and data shown as mean ± SEM.
Figure 6
Figure 6. AP-diABZI activates a tumoricidal NK and T cell response.
Flow cytometric analysis of orthotopic EMT6 breast tumors 24 h following two intravenous doses of AP-diABZI (1.25 μg, n=8), or PBS (n=7). (a) tSNE plots of live cells in EMT6 tumors colored by cell population with relative expression level of Ki67, CD69, PD-1, and PD-L1 as indicated on heat map. DC: dendritic cell; Mj: macrophage; NK: natural killer cell; MDSC: myeloid-derived suppressor cell. (b) Heat map summarizing the fold change in the percentage of indicated cell populations in EMT6 tumors. (c) Bar plots showing an increase in CD8+ cells and the ratio of CD8+ to CD4+FoxP3+ cells (as precent of CD3+ tumor cells). (d) Quantification of Ki67+CD69+ and Ki67+PD1+ CD8+ T cells in EMT6 tumors. *P≤0.05, **P≤0.01, ***P≤0.001, and ****P<0.0001 indicate a statistically significant difference between PBS and AP-diABZI treated groups as determined by Student’s t-test. (e) Spleen phenotyping heat map of frequency of NK cells, CD8+ T cells, and CD4+ T cells. *P≤0.05, **P≤0.01, ***P≤0.001, and ****P<0.0001 indicate a statistically significant difference for heat-maps between PBS and AP-diABZI treated groups as determined by two-way ANOVA. (f) Schematic of EMT6 tumor inoculation and treatment schedule with depletion antibodies (n=7–13). Anti-Asialo GM1 (NK) IgG, anti-CD8 IgG, and anti-CD4 IgG were injected I.P. at 100–200 μg and AP-diABZI was injected I.V. at 1.25 μg of diABZI per injection. (g) Tumor growth curves, and (h) Kaplan-Meier survival plots for mice with EMT6 tumors treated as indicated. CR = complete responder; SEM with P value determined by two-way ANOVA with post-hoc Tukey’s correction for multiple comparisons; ****P<0.0001 on day 22 for all groups compared to PBS. Endpoint criteria of 1500 mm3 tumor volume with P value was determined by log-rank test; ****P<0.0001 compared to PBS control. Replicates are noted as biological, and data shown as mean ± SEM.
Figure 7
Figure 7. Albumin-hitchhiking STING agonists stimulate antitumor immunity in B16.F10 melanoma tumor model.
(a) Schematic of B16.F10 tumor inoculation and treatment schedule. (b) Tumor growth curves, (c) spider plots of individual tumor growth curves, and (d) Kaplan-Meier survival plots (n=10–15). Anti-PD-L1 IgG (ICB) was injected I.P. at 100 μg and all nanobodies were injected I.V. at 1.25 μg of diABZI per injection. (b) SEM with P value determined by two-way ANOVA with post-hoc Tukey’s correction for multiple comparisons; ****P<0.0001 on day 18 for all groups compared to PBS. (d) Kaplan-Meier survival curves of mice treated with indicated formulation using 1500 mm3 tumor volume as endpoint criteria with P value was determined by log-rank test; ****P<0.0001 compared to PBS control. (e) Schematic of B16.F10-OVA tumor inoculation, treatment schedule, and study end point for flow cytometry analysis (n=12). AP-diABZI was injected I.V. at 1.25 μg of diABZI per injection. (f) Tumor weight on day 15 for mice with B16.F10-OVA tumors treated with AP-diABZI or PBS. (g) Frequency of CD4+ and CD8+ T cells in the spleen at study endpoint. Flow cytometric analysis of the frequency of (h) CD69+ activated T cells, (i) CD44+CD62L effector memory T cells, (j) CD44CD62L+ naïve T cells, and (k) CD44+CD62L+ central memory T cells. (l) SIINFEKL/H-2kB tetramer staining was performed to determine the frequency of OVA-specific CD8+ T cells in the spleen at study endpoint. (m) Representative flow cytometry dot plots demonstrating the distribution of CD8+ TEM (CD44+CD62L) and TCM (CD44+CD62L+) within the OVA-specific (tetramer+) and non-OVA-specific (tetramer) populations. *P≤0.05, **P≤0.01, ***P≤0.001, and ****P<0.0001 indicate a statistically significant difference between PBS and AP-diABZI treated groups as determined by Student’s t-test. Replicates are noted as biological, and data shown as mean ± SEM.
Figure 8
Figure 8. Albumin-hitchhiking STING agonists improve immunotherapy responses in a model of lung metastatic melanoma and adoptive T cell transfer therapy.
(a) Schematic of B16.F10-LUC I.V. tumor inoculation, treatment schedule, and study end point for analysis of lung tumor burden (n=11–15). Anti-PD-L1 IgG (ICB) was injected I.P. at 100 μg and all nanobodies were injected I.V. at 1.25 μg of diABZI per injection. (b) Representative images of lungs and (c) lung weights of mice treated as indicated. (d) Representative IVIS luminescent images and (e) quantification of average radiance from luciferase expressing B16.F10 within isolated lung tissue. P values determined by one-way ANOVA with post-hoc Tukey’s correction for multiple comparisons; *P≤0.05, **P≤0.01, ***P≤0.001, and ****P<0.0001 compared to the PBS control. (f-i) Evaluation of AP-diABZI as an adjuvant therapy for adoptive OT-I T cell transfer therapy in a B16.F10-OVA model (n=15). (f) Schematic of B16.F10-OVA tumor inoculation and of treatment schedule with OT-I transfer (0.5 million OT-I T cells) either on day 9 (OT-I alone or one dose (1.25 μg) AP-diABZI pre-treatment) or day 15 (three dose AP-diABZI pre-treatment). (g) Tumor growth curves, (h) spider plots of individual tumor growth curves, and (i) Kaplan-Meier survival curves. (g) P value determined by two-way ANOVA with post-hoc Tukey’s correction for multiple comparisons; ****P<0.0001 on day 17 for all groups compared to PBS. (i) Kaplan-Meier survival curves of mice treated with indicated formulation using 1500 mm3 tumor volume as endpoint criteria with P value was determined by log-rank test; ****P<0.0001 compared to PBS control. (CR = complete responder). Replicates are noted as biological, and data shown as mean ± SEM.

References

    1. Haslam A. & Prasad V. Estimation of the Percentage of US Patients With Cancer Who Are Eligible for and Respond to Checkpoint Inhibitor Immunotherapy Drugs. JAMA Netw Open 2, e192535 (2019). - PMC - PubMed
    1. Sharma P., Siddiqui B.A., Anandhan S., Yadav S.S., Subudhi S.K., Gao J., Goswami S. & Allison J.P. The Next Decade of Immune Checkpoint Therapy. Cancer Discov 11, 838–857 (2021). - PubMed
    1. Galon J. & Bruni D. Approaches to treat immune hot, altered and cold tumours with combination immunotherapies. Nat Rev Drug Discov (2019). - PubMed
    1. Demaria O., Cornen S., Daeron M., Morel Y., Medzhitov R. & Vivier E. Harnessing innate immunity in cancer therapy. Nature 574, 45–56 (2019). - PubMed
    1. Corrales L., Matson V., Flood B., Spranger S. & Gajewski T.F. Innate immune signaling and regulation in cancer immunotherapy. Cell Res 27, 96–108 (2017). - PMC - PubMed

Publication types