[Preprint]. 2025 May 7:2024.05.10.589920.
doi: 10.1101/2024.05.10.589920.

Excitatory Neuron-Derived Interleukin-34 Controls Cortical Developmental Microglia Function

Affiliations

Excitatory Neuron-Derived Interleukin-34 Controls Cortical Developmental Microglia Function

Benjamin A Devlin et al. bioRxiv. .

Update in

Abstract

Neuron-microglia interactions dictate the development of neuronal circuits in the brain. However, the factors that regulate these processes across development are largely unknown. Here, we find that IL34, a neuron-derived cytokine, is upregulated in early development and maintains neuroprotective, mature microglia in the anterior cingulate cortex (ACC) of mice. We show that IL34 is upregulated in the second week of postnatal life and is expressed primarily in excitatory neurons. Excitatory-neuron specific knock-out of IL34 reduced microglia number and TMEM119 expression and increased aberrant microglial phagocytosis of excitatory thalamocortical synapses in the ACC. Acute, low dose blocking of IL34 at postnatal day 15 similarly decreased TMEM119 and inappropriately increased microglial phagocytosis of synapses. Viral overexpression of IL34 induced TMEM119 expression and prevented appropriate microglial phagocytosis of synapses. These findings establish IL34 as a key regulator of neuron-microglia crosstalk in postnatal brain development, controlling both microglial maturation and synapse engulfment.


Conflict of interest statement

Declaration of Interests The authors declare no competing interests.

Figures

Figure 1.
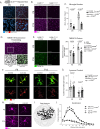
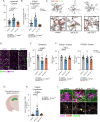
Figure 1.. IL34 expression is primarily regulated by development and neuronal subtype.
(A) Experimental timeline for WT brain collection across development and brain regions punched for qPCR analysis. (B) Quantification of IL34 and CSF1 mRNA levels in all four brain regions across six postnatal developmental timepoints. (n = 8 male and 8 female C57Bl6/j wild-type mice/age, P55 cerebellum excluded due to poor RNA quality, one-way ANOVA, data normalized to P7). (C) Quantification of IL34 protein using ELISA from tissue punches of the ACC and CBM. (n = 5 male and 5 female C57Bl6/j wild-type mice/age, two-way ANOVA age x brain region, Sidak’s post hoc test, main effect of brain region in legend). (D) Experimental timeline for early postnatal viral injections and DREADDs experiments. (E) Representative image of RNA-FISH stain including VGlut1 to distinguish excitatory neurons from inhibitory neurons. (F) Quantification of IL34 mRNA puncta in excitatory (VGlut1+) and inhibitory (Gad2+) neurons in control mice. (n = 4 mice/sex, data shown are animal averages of the expression level of all neurons of that type, unpaired t-test). Related to Figure S1.
Figure 2.
Figure 2.. Constitutive IL34 KO impacts microglia in the second postnatal week.
(A) Representative image of LacZ in the ACC of IL34LacZ/+ mice at postnatal day 8 (P8) and P15. (B-C) Representative images of Iba1 and quantification of microglia number in the ACC of P8 and P15 IL34LacZ/LacZ and IL34LacZ/+ mice. (n = 5–8 mice/sex/age/genotype, two-way ANOVA age x genotype, Sidak’s post-hoc test, main effect of genotype and interaction in legend). Scale = 100μm. (D) Method for masking the Iba1 channel to quantify TMEM119 fluorescence. (E) Representative images and quantification of TMEM119 in the ACC of P8 and P15 IL34 KO and control mice (n = 5–8 mice/sex/age/genotype, two-way ANOVA age x genotype, Sidak’s post-hoc test, main effect of genotype and interaction in legend). (F) Representative IMARIS 3D reconstructions of microglia (Iba1) and lysosomes (CD68) from ACC of P8 and P15 IL34 KO and control mice. Scale = 5μm for P8 microglia, 15μm for P15 microglia. (G) Quantification of lysosomal content (volume of CD68 / total microglia volume * 100, n = 3 mice/sex/age/genotype, 4–6 cells analyzed per mouse, individual microglia represented by gray circles, animal averages represented by black dots, two-way ANOVA age x genotype, Sidak’s post-hoc test, main effect of genotype and interaction in legend). (H-J) Representative images of individual microglia (Iba1) and quantification of ramification using sholl analysis. (n = 5–8 mice/sex/age/genotype, 6 cells analyzed per mouse, two-way ANOVA distance from soma x genotype, main effect of genotype in legend). Related to Figure S2–S4.
Figure 3.
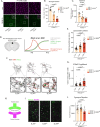
Figure 3.. Excitatory neuron-specific KO of IL34 reduces microglia number, increases phagocytosis of synaptic material, and reduces overall synapse numbers in the ACC at P15.
(A) Representative images of Iba1 and TMEM119 in the ACC of P15 VGlut2Cre IL34+/+, IL34fl/+, and IL34fl/fl mice. Scale = 100μm. (B-C) Quantification of microglia number and TMEM119 in the three groups. (n = 2–4 mice/sex/genotype, one-way ANOVA, Sidak’s post-hoc test, main effect of genotype in legend). (D) Previous findings detailing microglia-neuron interactions in the ACC during the second postnatal week. Conceptual diagram constructed based on data from Figure 4 in Block et al., 2022. (E) Quantification of total lysosomal content in the ACC of P15 VGlut2Cre IL34+/+, IL34fl/+, and IL34fl/fl mice. (n = 2–4 mice/sex/genotype, 4–6 cells analyzed per mouse, individual microglia represented by gray circles, animal averages represented by black dots, nested one-way ANOVA, Sidak’s post-hoc test, main effect of genotype in legend). (F) Representative IMARIS reconstructions and quantification of microglia synaptic engulfment from VGlut2Cre IL34+/+, IL34fl/+, and IL34fl/fl mice. (n = 2–4 mice/sex/genotype, 4–6 cells analyzed per mouse, individual microglia represented by gray circles, animal averages represented by black dots, nested one-way ANOVA, Sidak’s post-hoc test, main effect of genotype in legend). (G) Thalamocortical synapse numbers are quantified by VGlut2 and PSD95 overlap. (I-J) Representative images and quantification of Vglut2+/PSD95+ overlap. (n = 2–4 mice/sex/genotype, 3 sections imaged per animal, images represented by gray circles, animal averages represented by black dots, nested one-way ANOVA, Sidak’s post-hoc test, main effect of genotype in legend). Scale = 5μm.
Figure 4.
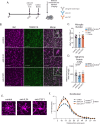
Figure 4.. Acute, low-dose IL34 inhibition at P15 mimics constitutive genetic loss of IL34 without significant cell loss.
(A) Schematic of blocking antibody injection surgeries and tissue collection. (B) Representative images of Iba1 and TMEM119 in the ACC of mice administered either control (IgG) antibody, anti-IL34, or anti-CSF1. Scale = 100μm. (C-D) Quantification of microglia numbers and TMEM119 in the three groups. (n = 3–6 mice/sex/antibody, one-way ANOVA, Sidak’s post-hoc test, main effect of antibody shown in legend). (E) Representative images of individual microglia (Iba1) and quantification of cell ramification from control, anti-IL34, and anti-CSF1 mice. (n = 5–8 mice/sex/treatment, 6 cells analyzed per mouse, two-way ANOVA distance from soma x genotype, main effect of genotype in legend). Related to Figure S7.
Figure 5.
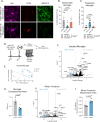
Figure 5.. Acute IL34 inhibition at P15 decreases mature, homeostatic microglia and increases phagocytic microglia.
(A) Representative images of CD68LoTMEM119Hi and CD68HiTMEM119Lo microglia. (B-C) Quantification of homeostatic and phagocytic microglia in the ACC of the three groups. (n = 3–6 mice/sex/antibody, data shown are a percentage of 12 cells measured per animal across 3 images, one-way ANOVA, Sidak’s post-hoc test, main effect of antibody in legend). (D) Schematic of bulk RNASequencing of isolated microglia and whole forebrain. (E) PCA plot of isolated microglia transcriptomes from a-gp120 control and a-IL34 treated mice. (F and H) Volcano plot showing differentially expressed genes between a-gp120 control and a-IL34 treated microglia or whole forebrain (n=2–3 mice/sex/treatment, genes shown as significant passed a threshold of padj < 0.001 and LogFC > 1). (G and I) Quantification of microglia developmental index and LPS-induced “inflammatory” index from whole transcriptome data of isolated microglia or whole forebrain using methods described in Hanamsagar et al., 2017. (n=2–3 mice/sex/treatment, unpaired t-test). Related to Figure S5 and S7.
Figure 6.
Figure 6.. IL34 Inhibition Causes Aberrant Eating of VGlut2+ Synapses.
(A-C) Quantification and representative images of lysosomal content and VGlut2 synaptic engulfment in control, anti-IL34, and anti-CSF1 treated mice. (n = 3–5 mice/sex/antibody, 4–6 cells analyzed per mouse, individual microglia represented by gray circles, animal averages represented by black dots, nested one-way ANOVA, Sidak’s post-hoc test, main effect of antibody in legend). (D-F) Representative images of VGlut2 and PSD95 and quantification of synapses in control, anti-IL34, or anti-CSF1 brains. (n = 3–5 litters/sex/antibody, 3 sections imaged per animal, 1–2 animals per litter, images represented by gray circles, litter averages represented by black dots, nested one-way ANOVA, Sidak’s post-hoc test, main effect of antibody in legend). (G) Schematic showing where hippocampal analysis was performed. (H-I) Quantification and IMARIS representative images of engulfed VGlut2 synaptic material in control, anti-IL34, and anti-CSF1 treated mice. (n = 1–3 mice/sex/antibody, 4–6 cells analyzed per mouse, individual microglia represented by gray circles, animal averages represented by black dots, nested one-way ANOVA, Sidak’s post-hoc test, main effect of antibody in legend). Related to Figure S6 and S7.
Figure 7.
Figure 7.. IL34 Viral Overexpression at P1 increases TMEM119 expression and reduces microglial engulfment of synapses.
(A) Schematic of viral injections and tissue collection. (B) IL34 ELISA data measuring IL34 protein in control and AAV-IL34 mice. (n = 4–5 mice/group, unpaired t-test). (C-E) Representative images of Iba1 and TMEM119 and quantification of microglia numbers and TMEM119 in the ACC of mice injected with either control GFP or AAV-IL34. (n = 3–5 mice/sex/virus, unpaired t test). Scale = 100μm. (F) Quantification of microglia lysosomal content and VGlut2 synaptic engulfment and IMARIS representative images in control GFP and AAV-IL34 mice. (n = 3–5 mice/sex/virus, 4–6 cells analyzed per mouse, individual microglia represented by gray circles, animal averages represented by black dots, nested t-test). (I) Representative images and quantification of Vglut2+/PSD95+ overlap in control GFP or AAV-IL34 brains. (n = 3–4 litters/sex/antibody, 3 sections imaged per animal, 1–2 animals per litter, images represented by gray circles, litter averages represented by black dots, nested t-test). (K) Quantification of microglial ramification in control GFP and AAV-IL34 mice. (n = 3–5 mice/sex/virus, 4–6 cells analyzed per mouse, two-way ANOVA distance from soma x virus, p values shown are main effect of virus).

References

    1. Paolicelli R.C., Sierra A., Stevens B., Tremblay M.-E., Aguzzi A., Ajami B., Amit I., Audinat E., Bechmann I., Bennett M., et al. (2022). Microglia states and nomenclature: A field at its crossroads. Neuron 110, 3458–3483. 10.1016/j.neuron.2022.10.020. - DOI - PMC - PubMed
    1. Matcovitch-Natan O., Winter D.R., Giladi A., Aguilar S.V., Spinrad A., Sarrazin S., Ben-Yehuda H., David E., González F.Z., Perrin P., et al. (2016). Microglia development follows a stepwise program to regulate brain homeostasis. Science 353. 10.1126/science.aad8670. - DOI - PubMed
    1. Bennett M.L., Bennett F.C., Liddelow S.A., Ajami B., Zamanian J.L., Fernhoff N.B., Mulinyawe S.B., Bohlen C.J., Adil A., Tucker A., et al. (2016). New tools for studying microglia in the mouse and human CNS. Proc. Natl. Acad. Sci. 113, E1738–E1746. 10.1073/pnas.1525528113. - DOI - PMC - PubMed
    1. Bennett F.C., Bennett M.L., Yaqoob F., Mulinyawe S.B., Grant G.A., Hayden Gephart M., Plowey E.D., and Barres B.A. (2018). A Combination of Ontogeny and CNS Environment Establishes Microglial Identity. Neuron 98, 1170–1183.e8. 10.1016/j.neuron.2018.05.014. - DOI - PMC - PubMed
    1. Nandi S., Gokhan S., Dai X.-M., Wei S., Enikolopov G., Lin H., Mehler M.F., and Stanley E.R. (2012). The CSF-1 receptor ligands IL-34 and CSF-1 exhibit distinct developmental brain expression patterns and regulate neural progenitor cell maintenance and maturation. Dev. Biol. 367, 100–113. 10.1016/j.ydbio.2012.03.026. - DOI - PMC - PubMed

Publication types

LinkOut - more resources