[Preprint]. 2024 May 11:2024.05.11.593044.
doi: 10.1101/2024.05.11.593044.

Microbiota and metabolic adaptation shape Staphylococcus aureus virulence and antimicrobial resistance during intestinal colonization

Affiliations

Microbiota and metabolic adaptation shape Staphylococcus aureus virulence and antimicrobial resistance during intestinal colonization

Chunyi Zhou et al. bioRxiv. .

Abstract

Depletion of microbiota increases susceptibility to gastrointestinal colonization and subsequent infection by opportunistic pathogens such as methicillin-resistant Staphylococcus aureus (MRSA). How the absence of gut microbiota impacts the evolution of MRSA is unknown. The present report used germ-free mice to investigate the evolutionary dynamics of MRSA in the absence of gut microbiota. Through genomic analyses and competition assays, we found that MRSA adapts to the microbiota-free gut through sequential genetic mutations and structural changes that enhance fitness. Initially, these adaptations increase carbohydrate transport; subsequently, evolutionary pathways largely diverge to enhance either arginine metabolism or cell wall biosynthesis. Increased fitness in arginine pathway mutants depended on arginine catabolic genes, especially nos and arcC, which promote microaerobic respiration and ATP generation, respectively. Thus, arginine adaptation likely improves redox balance and energy production in the oxygen-limited gut environment. Findings were supported by human gut metagenomic analyses, which suggest the influence of arginine metabolism on colonization. Surprisingly, these adaptive genetic changes often reduced MRSA's antimicrobial resistance and virulence. Furthermore, resistance mutation, typically associated with decreased virulence, also reduced colonization fitness, indicating evolutionary trade-offs among these traits. The presence of normal microbiota inhibited these adaptations, preserving MRSA's wild-type characteristics that effectively balance virulence, resistance, and colonization fitness. The results highlight the protective role of gut microbiota in preserving a balance of key MRSA traits for long-term ecological success in commensal populations, underscoring the potential consequences on MRSA's survival and fitness during and after host hospitalization and antimicrobial treatment.


Conflict of interest statement

CONFLICTS OF INTERESTS B.S. has consulted for Basilea Pharmaceutica. V.J.T. has received honoraria from Pfizer and MedImmune and is an inventor on patents and patent applications filed by New York University, which are currently under commercial license to Janssen Biotech Inc. Janssen Biotech Inc. provides research funding and other payments associated with a licensing agreement. K.C. has received research support from Pfizer, Takeda, Pacific Biosciences, Genentech, and AbbVie, consulted for or received honoraria from Vedanta, Genentech, and AbbVie, and is an inventor on US patent 10,722,600 and pro- visional patents 62/935,035 and 63/157,225. J.S. holds equity in Postbiotics Plus Research, has filed intellectual property applications related to the microbiome (reference numbers #63/299,607), and is on an advisory board and holds equity of Jona Health.

Figures
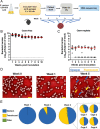
Fig. 1.
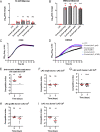
Fig. 1.. Evolution of morphologic variants in the gut of germ-free mice.
(A) Experimental design. Germ-free C57BL/6 mice housed in 4 cages were individually gavaged with 5 × 10⁸ cfu of strain LAC (BS819). (B, C) Quantification of bacteria (cfu) in stool from germ-free (B; n = 16) and conventional (germ-replete; C; n = 7) mice. Each symbol represents data from one mouse. Data are mean ± SEM. Dotted line, limit of detection. (D) Colony morphology. Representative images at week 0 (LAC wild-type), 1, and 5 (left, middle, and right panels, respectively). Blue arrows, opaque (wild-type-like) colonies; yellow arrows, translucent (variant) colonies. (E) Colony morphology over time. Morphotypes were scored by plating bacteria (n > 200 colonies) on tryptic soy agar with sheep blood from all 4 cages at each timepoint. Also shown are week 5 data from individual cages.
Fig. 2.
Fig. 2.. Parallel evolution of mutations and genetic alterations within and between cages of germ-free mice.
(A) Distribution of top mutated genes in evolved strains (see Results). Single evolved colonies (n = 201) of strain LAC (BS819) from four cages of germ-free mice were sequenced 5-weeks post-inoculation. Mutation type, opaque and translucent morphology, and presence or absence of methicillin-resistance (mecA) and ACME (arginine catabolic mobile element) are indicated. Insertion variants are in-frame with the walK coding sequence. See Table S1 and Fig. S2 for supporting information. (B-C) Primary differentiation by ptsG/glcT is for the most part followed by polymorphism of walKR or arcR/ahrC. (B) Phylogeny of evolved mutants. Maximum-likelihood trees of 51 opaque (walKR mutant) and translucent (all other) colonies obtained 5-weeks post-inoculation from cage 1 mice. Gene names are listed at the top, and mutations for each isolate are indicated on the corresponding horizontal line and column. (C) Changes in mutation composition over time. Aggregate allele frequency estimates (fraction of aligned reads) in selected genes by week, identified by deep sequencing of thousands of pooled colonies obtained from the stool of mice in all four cages.
Fig. 3.
Fig. 3.. Fitness of evolved mutants in the gut of germ-free and conventional mice.
(A-F) Competitive colonization assays (competitive index, Left) and quantification of bacteria in stool (cfu, Right) determined from the stool of colonized germ-free (A, C, and E) or conventional, germ-replete mice (B, D, and F). Strains with evolved mutations in glcB (BS1565; panels A and B), ahrC ACME (−) (W5–1-O18; panels C and D), and walk glcB (W5–9; panels E and F) were competed against patental strain LAC. LAC contained a chromosomally integrated cadmium resistance marker (SaPI1 attC::cadCA; strain VJT32.58) to distinguish the strains following plating of serial dilutions on tryptic soy agar (TSA) with or without cadmium (0.3 mM). Evolved mutants and LAC CdR were mixed 1:1 and used to inoculate each mouse. Each symbol represents data from one mouse (n = 6–12 mice). Median values (red lines) are shown, and each symbol is the competitive index (Left) or cfu (Right) from one mouse. *P < 0.05, **P < 0.01, and ns (P > 0.05) by Wilcoxon signed-rank tests. The dotted lines indicate a 1:1 ratio (equal fitness). LOD: limit of detection.
Fig. 4.
Fig. 4.. Involvement of evolved mutations with upregulation of glucose import and arginine catabolism.
(A-B) Effect of evolved mutations on transcription of glcB in the presence and absence of glucose. Total cellular RNA was extracted from the indicated evolved mutant or parental strain LAC (BS819) after aerobic growth in chemically-defined medium (CDM, 1% cas amino acids with 14 mM glucose) (A) or CDM without glucose (B), followed by reverse transcription and PCR amplification of glcB, using 16S rRNA as an internal standard. Data are mean log10(fold change) from each strain (n = 3). ns P > 0.05; * P < 0.05; ** P < 0.01; *** P < 0.001 by one sample t test comparing to 0 (log10 [LAC fold change]). Strains were evolved mutant glcB (BS1565), glcB walK (W5–9), glcB sdaA (W5–10); and glcT walK (W5–17). (C-D) Effect of evolved mutations in ahrC on growth in media lacking arginine. Growth analysis of evolved mutants ahrC glcB (W5–7), ahrC glcB ACME (−) (W5–1-O1), ahrC (W5–2-O10), ahrC ACME (−)(W5–1-O18), and parental strain LAC (BS819) in CDM with or without (CDM-R) arginine. Data represent means ± SEM from three (n = 3) biological replicates. (E-I) Effect of transposon insertions in arginine biosynthesis and catabolism genes in evolved strains. (E-I) Competition assays in germ-free mice, performed as in Fig. 3, involving (E) evolved mutant ahrC ACME (−) (W5–1-O18) containing arginine biosynthesis gene mutation argG::bursa (BS1541) or LAC argG::bursa CdR (BS1539), and (F-I) parental strain LAC CdR (VJT32.58) and arginine catabolic pathway transposon mutants arcC::bursa (BS1535), gudB::bursa (BS1409), and nos::bursa (BS1434). See Fig. S3 for bacterial burden. Each symbol represents data from one mouse (n = 9–15 mice). Wilcoxon signed-rank test: ns P > 0.05; * P < 0.05; ** P < 0.01; **** P < 0.0001. The red lines are medians.
Fig. 5.
Fig. 5.. MRSA shapes fecal metabolite concentrations.
Comparative analysis of the fecal metabolome of germ-free mice (n = 3) housed in a single cage before (week 0; W0) and after (week 1; W1) inoculation with parental strain LAC (BS819). The homogenized stool (total 3 stool pellets per week) was analyzed by HILIC UPLC mass spectrometry. (A) Metabolite profile comparison of week 0 and week 1 stool. Unsupervised clustering analysis showing significant altered metabolites (P < 0.05 from t test; n = 144). (B) Relative concentrations of metabolites associated with carbohydrate and arginine metabolism. Peak spectra intensities of the indicated metabolites from week 0 and week 1 stool samples. Data are mean ± SD. The dotted line indicates the limit of detection. Unpaired t test, * P < 0.1. (C) Log2 fold change of all metabolites (n = 1320) in stool samples from week 1 relative to week 0. Each dot represents a metabolite. Red and blue indicates metabolites that were increased or decreased, respectively.
Fig. 6.
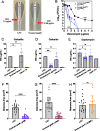
Fig. 6.. Association of evolved walKR mutations with increased autolysis, biofilm, intestinal fitness, and colony morphology.
(A) TritonX-100-stimulated autolysis of walKR mutant cells. Cells of the indicated evolved walKR mutant, parental strain LAC (BS819), and control strain LAC Δatl (VJT80.33) grown in tryptic soy broth (TSB), were suspended in PBS or PBS containing 0.1% TritonX-100. Rate of autolysis was monitored as a decrease of absorbance at 600 nm. Data represent the means ± SEM from (n = 2–3) biological replicates. (B) Biofilm formation. Biofilm formation in TSB supplemented with 0.25% w/v D-(+)-glucose medium at 37°C for evolved strain walK, glcB (W5–9) and parental strain LAC with tissue culture-treated 96-well plates. Data represent the mean ± SEM from (n = 3) biological replicates. Unpaired t test: ** P < 0.01. (C) TritonX-100-stimulated autolysis of LAC WalKH271Y cells. Cells of LAC WalKH271Y, LAC, and LAC Δatl were analysed as in A. (D) Competition assays in germ-free mice, performed as in Fig. 3, involving LAC WalKH271Y and LAC CdR (n = 10 mice). ** P < 0.01 by Wilcoxon signed-rank test. The red lines are medians. See Fig. S3 for bacterial burden. (E) TritonX-100-stimulated autolysis of a yycH mutant clinical isolate with a VISA phenotype. Cells of ancestral clinical isolate (BS1208), evolved yycH mutant (BS1210), LAC, and LAC Δatl were analysed as in A. BS1208 and BS1210 are isolates JH1 and JH6, respectively, in Mwangi et al.25 (F) Competition assays in germ-free mice, performed as in Fig. 3, involving BS1210 and BS1208 CdR (SaPI1 attC::cadCA; strain BS1709)(n = 9 mice). ** P < 0.01 by Wilcoxon signed-rank test. The red lines are medians. See Fig. S3 for bacterial burden. (G) Intracolonial phenotypic variation in a walKR mutant seen as colony sectoring. Photographs of colonies, illuminated by oblique and transmitted light, derived from control strain LAC and a translucent walK variant (W3–1C) grown on TSA. (H) Growth curves. Evolved walK glcB mutant (W5–9) and parental strain LAC cultures were grown in TSB following 1,000-fold dilution of overnight cultures. Growth of diluted cultures was monitored for 8 hours every 15 min by measuring the OD600 using a Bioscreen C.
Fig. 7.
Fig. 7.. Association of colonization adaptative mutations with antimicrobial resistance and virulence.
(A) Vancomycin resistance determined by Etest or population analysis. Minimal inhibitory concentration (MIC) of parental strain LAC (BS819) and an evolved walK mutant (W5–2-T2) by Etest. (B) population analysis of LAC, evolved WalKD552N GlcTH104Y mutant (W5–2-T6), evolved WalKInsertion GlcTH104Y mutant (W5–4-T16), and heteresistant control strain Mu3 (BS626). Data represent means from four technical replicates. (C-E) Cefoxitin and daptomycin MICs of parental strain LAC mecA::bursa (BS1168), LAC mprF::bursa (BS1328), and evolved strains with mecA, spoVG, or cls2 mutations, determined by Etest (n = 6–16 for evolved strains in each condition). See Table S5 for stain information. ns P > 0.05; * P < 0.05; ** P < 0.01 by one-way ANOVA, Dunnett’s multiple comparisons test. Data are mean ± SEM. (F-H) Association of evolved mutations and skin abscess size. Abscess size, measured 48h after s.c. infection with ~1 × 10⁷ cfu of the indicated strain, (n = 9–10 mice per group with two abscesses per mouse). Strains were evolved mutants walK glcB (W5–9), glcB sdaA (W5–10), and ahrC ACME (−) (W5–1-O18), and parental strain LAC (BS819). ns P > 0.05; **** P < 0.0001 by Mann Whitney test (F and G) or unpaired t test (H). Data are mean ± SEM.

References

    1. Antimicrobial Resistance C. 2022. Global burden of bacterial antimicrobial resistance in 2019: a systematic analysis. Lancet 399:629–655. - PMC - PubMed
    1. von Eiff C, Becker K, Machka K, Stammer H, Peters G. 2001. Nasal carriage as a source of Staphylococcus aureus bacteremia. Study Group. N Engl J Med 344:11–6. - PubMed
    1. Wertheim HF, Melles DC, Vos MC, van Leeuwen W, van Belkum A, Verbrugh HA, Nouwen JL. 2005. The role of nasal carriage in Staphylococcus aureus infections. Lancet Infect Dis 5:751–62. - PubMed
    1. Faden H, Lesse AJ, Trask J, Hill JA, Hess DJ, Dryja D, Lee YH. 2010. Importance of colonization site in the current epidemic of staphylococcal skin abscesses. Pediatrics 125:e618–24. - PubMed
    1. Kumar N, David MZ, Boyle-Vavra S, Sieth J, Daum RS. 2015. High Staphylococcus aureus colonization prevalence among patients with skin and soft tissue infections and controls in an urban emergency department. J Clin Microbiol 53:810–5. - PMC - PubMed

Publication types