

Joint transcriptomic and metabolomic analysis provides new insights into drought resistance in watermelon (Citrullus lanatus)
- PMID: 38766468
- PMCID: PMC11102048
- DOI: 10.3389/fpls.2024.1364631
Joint transcriptomic and metabolomic analysis provides new insights into drought resistance in watermelon (Citrullus lanatus)
Abstract
Introduction: Watermelon is an annual vine of the family Cucurbitaceae. Watermelon plants produce a fruit that people love and have important nutritional and economic value. With global warming and deterioration of the ecological environment, abiotic stresses, including drought, have become important factors that impact the yield and quality of watermelon plants. Previous research on watermelon drought resistance has included analyzing homologous genes based on known drought-responsive genes and pathways in other species.
Methods: However, identifying key pathways and genes involved in watermelon drought resistance through high-throughput omics methods is particularly important. In this study, RNA-seq and metabolomic analysis were performed on watermelon plants at five time points (0 h, 1 h, 6 h, 12 h and 24 h) before and after drought stress.
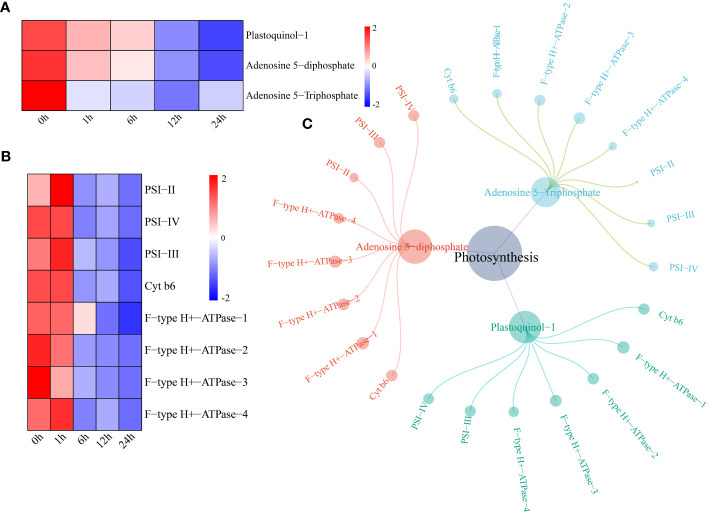
Results: Transcriptomic analysis revealed 7829 differentially expressed genes (DEGs) at the five time points. The DEGs were grouped into five clusters using the k-means clustering algorithm. The functional category for each cluster was annotated based on the Kyoto Encyclopedia of Genes and Genomes (KEGG) database; different clusters were associated with different time points after stress. A total of 949 metabolites were divided into 10 categories, with lipids and lipid-like molecules accounting for the most metabolites. Differential expression analysis revealed 22 differentially regulated metabolites (DRMs) among the five time points. Through joint analysis of RNA-seq and metabolome data, the 6-h period was identified as the critical period for watermelon drought resistance, and the starch and sucrose metabolism, plant hormone signal transduction and photosynthesis pathways were identified as important regulatory pathways involved in watermelon drought resistance. In addition, 15 candidate genes associated with watermelon drought resistance were identified through joint RNA-seq and metabolome analysis combined with weighted correlation network analysis (WGCNA). Four of these genes encode transcription factors, including bHLH (Cla97C03G068160), MYB (Cla97C01G002440), HSP (Cla97C02G033390) and GRF (Cla97C02G042620), one key gene in the ABA pathway, SnRK2-4 (Cla97C10G186750), and the GP-2 gene (Cla97C05G105810), which is involved in the starch and sucrose metabolism pathway.
Discussion: In summary, our study provides a theoretical basis for elucidating the molecular mechanisms underlying drought resistance in watermelon plants and provides new genetic resources for the study of drought resistance in this crop.
Keywords: RNA-Seq; WGCNA; drought; metabolomic; watermelon.
Copyright © 2024 Chen, Zhong, Li, Bai, Xue and Wu.
Conflict of interest statement
The authors declare that the research was conducted in the absence of any commercial or financial relationships that could be construed as a potential conflict of interest.
Figures


Similar articles
-
Transcriptomic and Metabolomic Analysis of the Effects of Exogenous Trehalose on Salt Tolerance in Watermelon (Citrullus lanatus).Cells. 2022 Jul 29;11(15):2338. doi: 10.3390/cells11152338. Cells. 2022. PMID: 35954182 Free PMC article.
-
Analysis of differentially expressed genes and pathways associated with male sterility lines in watermelon via bulked segregant RNA-seq.3 Biotech. 2020 May;10(5):222. doi: 10.1007/s13205-020-02208-2. Epub 2020 Apr 29. 3 Biotech. 2020. PMID: 32368431 Free PMC article.
-
Gene co-expression network analysis to identify critical modules and candidate genes of drought-resistance in wheat.PLoS One. 2020 Aug 31;15(8):e0236186. doi: 10.1371/journal.pone.0236186. eCollection 2020. PLoS One. 2020. PMID: 32866164 Free PMC article.
-
Integrating Physiology, Transcriptome, and Metabolome Analyses Reveals the Drought Response in Two Quinoa Cultivars with Contrasting Drought Tolerance.Int J Mol Sci. 2024 Nov 13;25(22):12188. doi: 10.3390/ijms252212188. Int J Mol Sci. 2024. PMID: 39596254 Free PMC article.
-
Identification of Differentially Expressed Genes Related to Dehydration Resistance in a Highly Drought-Tolerant Pear, Pyrus betulaefolia, as through RNA-Seq.PLoS One. 2016 Feb 22;11(2):e0149352. doi: 10.1371/journal.pone.0149352. eCollection 2016. PLoS One. 2016. Retraction in: PLoS One. 2024 May 22;19(5):e0304430. doi: 10.1371/journal.pone.0304430. PMID: 26900681 Free PMC article. Retracted.
Cited by
-
Comparative Transcriptome and Volatile Metabolome Analysis of Gossypium hirsutum Resistance to Verticillium Wilt.Genes (Basel). 2025 Jul 25;16(8):877. doi: 10.3390/genes16080877. Genes (Basel). 2025. PMID: 40869925 Free PMC article.
-
Exploring physiological and molecular dynamics of drought stress responses in plants: challenges and future directions.Front Plant Sci. 2025 Mar 24;16:1565635. doi: 10.3389/fpls.2025.1565635. eCollection 2025. Front Plant Sci. 2025. PMID: 40196426 Free PMC article. Review.
-
Metabolomic and transcriptomic analyses of drought resistance mechanisms in sorghum varieties.PeerJ. 2025 Jul 4;13:e19596. doi: 10.7717/peerj.19596. eCollection 2025. PeerJ. 2025. PMID: 40625922 Free PMC article.
References
LinkOut - more resources
Full Text Sources