. 2024 Aug 5;223(8):e202402046.
doi: 10.1083/jcb.202402046. Epub 2024 May 20.

Proteasome gene expression is controlled by coordinated functions of multiple transcription factors

Affiliations

Proteasome gene expression is controlled by coordinated functions of multiple transcription factors

Jennifer E Gilda et al. J Cell Biol. .

Abstract

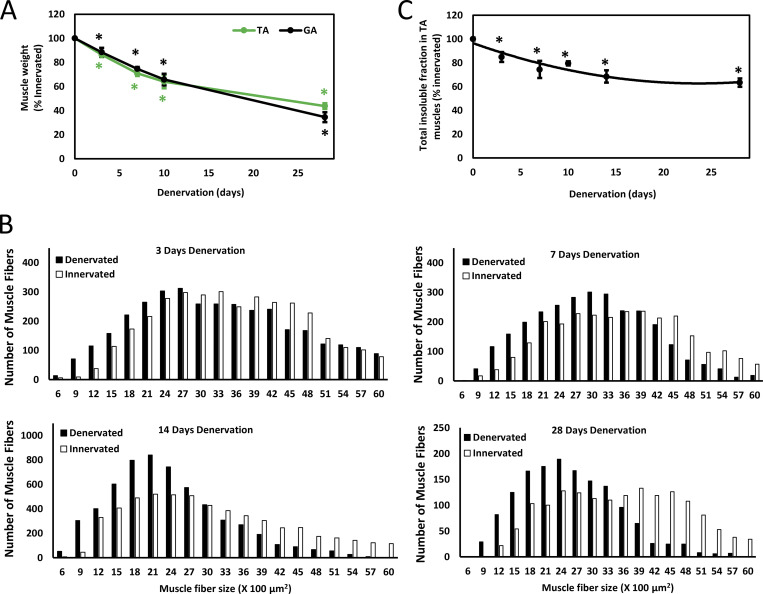
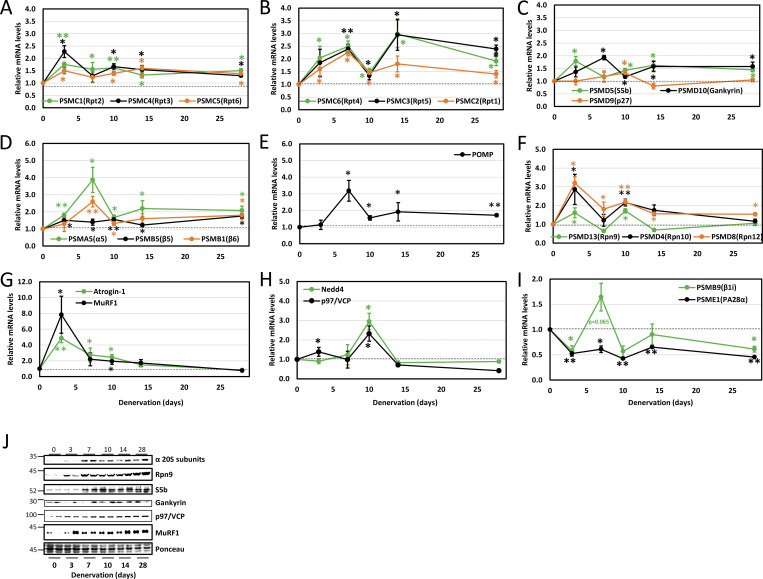
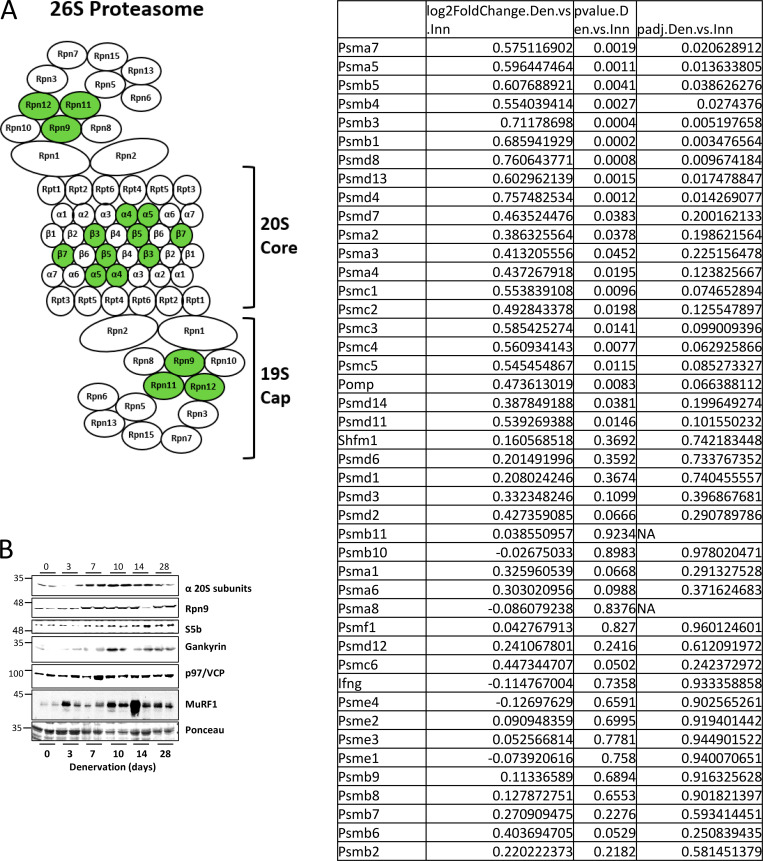
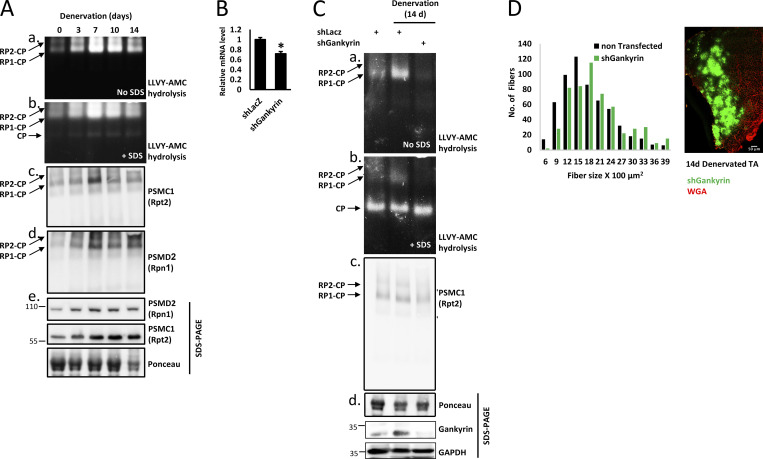
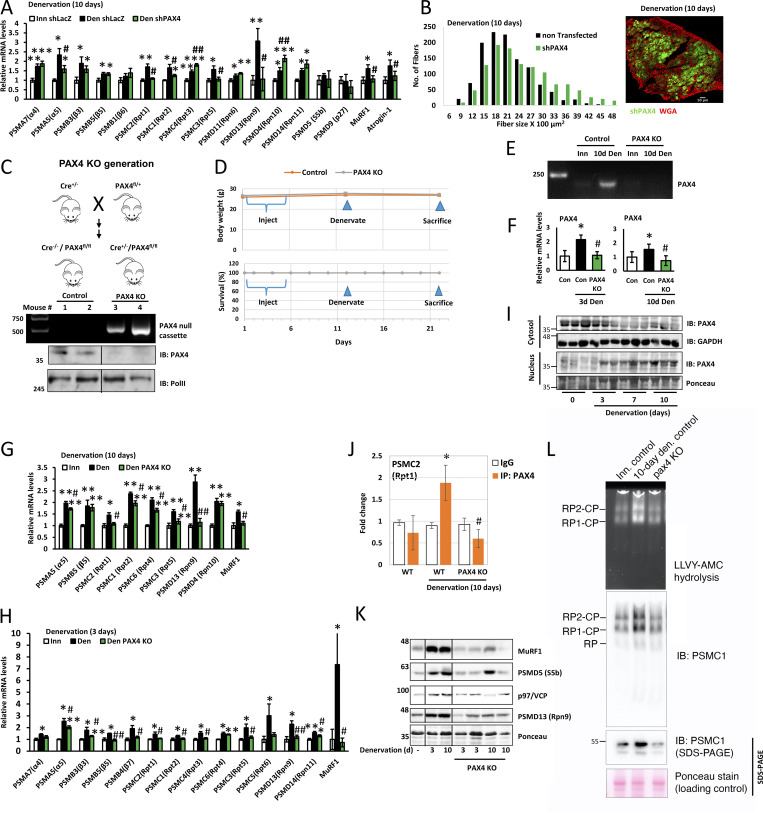
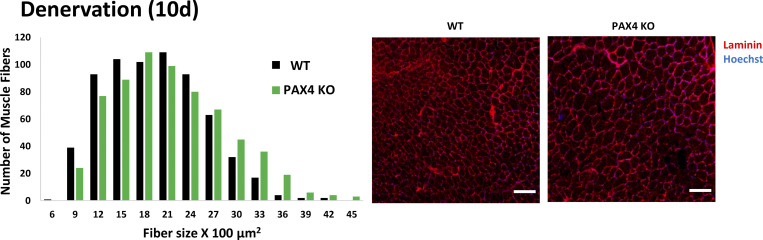
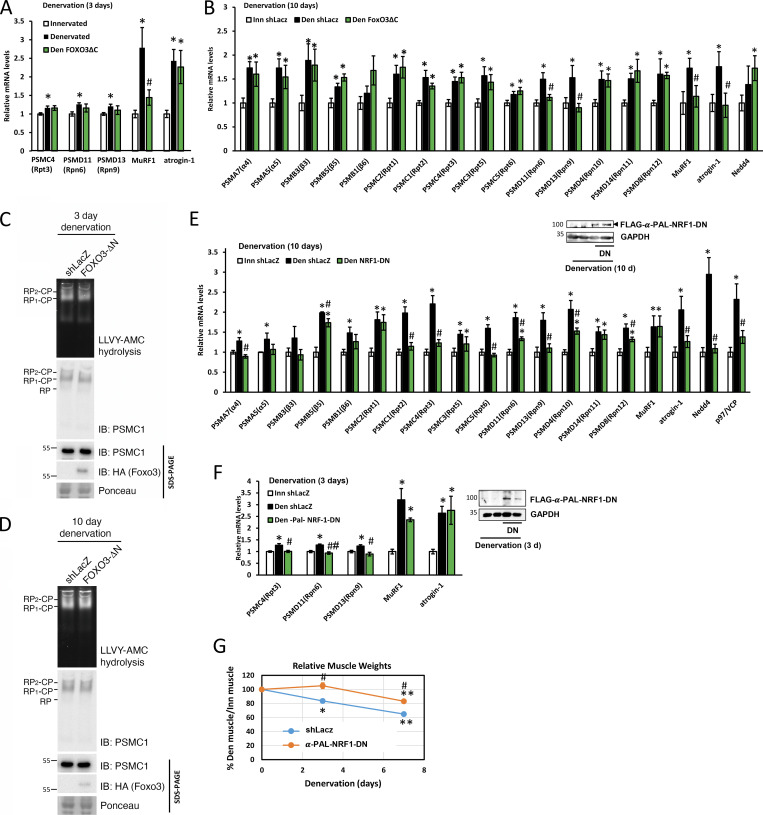
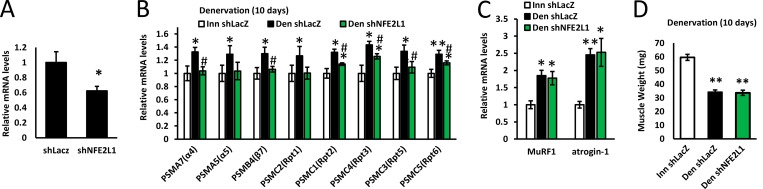
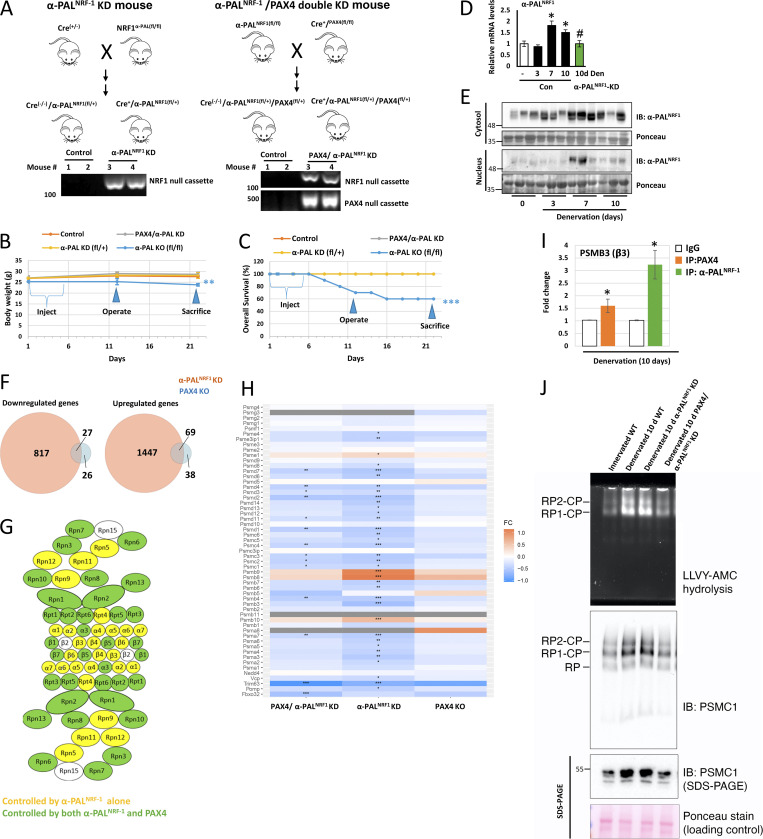
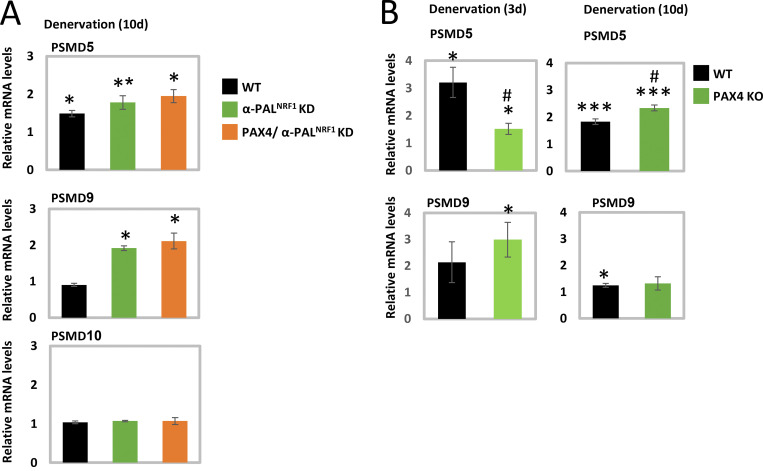
Proteasome activity is crucial for cellular integrity, but how tissues adjust proteasome content in response to catabolic stimuli is uncertain. Here, we demonstrate that transcriptional coordination by multiple transcription factors is required to increase proteasome content and activate proteolysis in catabolic states. Using denervated mouse muscle as a model system for accelerated proteolysis in vivo, we reveal that a two-phase transcriptional program activates genes encoding proteasome subunits and assembly chaperones to boost an increase in proteasome content. Initially, gene induction is necessary to maintain basal proteasome levels, and in a more delayed phase (7-10 days after denervation), it stimulates proteasome assembly to meet cellular demand for excessive proteolysis. Intriguingly, the transcription factors PAX4 and α-PALNRF-1 control the expression of proteasome among other genes in a combinatorial manner, driving cellular adaptation to muscle denervation. Consequently, PAX4 and α-PALNRF-1 represent new therapeutic targets to inhibit proteolysis in catabolic diseases (e.g., type-2 diabetes, cancer).


Conflict of interest statement

Disclosures: The authors declare no competing interests exist.

Figures

Figure 1.
Figure 1.
Time course of mouse muscle atrophy after denervation. The sciatic nerve of adult WT mice was transected, and TA and GA muscles were collected at several time points later. (A–C) Muscle weight (A), muscle fiber size (B), and total amount of insoluble fraction (C) decrease after denervation. The atrophy seen over time results primarily from the accelerated degradation of muscle proteins. (A) Mean muscle weights of denervated TA and GA muscles are presented as a percentage of innervated controls ± SEM. N = 5 mice per time point. *, P < 0.05 versus innervated by one-tailed unpaired Student’s t test. (B) Measurements of cross-sectional areas of 5,143 (3 days, n = 4 mice), 2,887 (7 days, n = 4 mice), 5,878 (14 days, n = 4 mice), 1,480 (28 days, n = 4 mice) fibers in denervated muscles and an identical number of fibers in innervated controls. Statistics in Table 1. (C) Mean total content of insoluble fraction per TA muscle at different times after denervation is depicted as the percent of innervated controls ± SEM. N = 3 mice per time point. *, P < 0.05 versus innervated by one-tailed unpaired Student’s t test.
Figure 2.
Figure 2.
Two-phase differential expression of proteasome genes in atrophying mouse muscle in vivo. (A–I) Time course of induction of selected proteasome and chaperone genes and UPS components was determined by RT-PCR analysis of mRNA preparations from TA muscles at 3, 7, 10, 14, and 28 days after denervation. Means ± SEM are presented as a ratio to innervated muscles. N = 7 mice per time point. *, P < 0.05; **P < 0.001 versus innervated by one-tailed unpaired Student’s t test. (J) Increased protein levels were confirmed for representative genes by analysis of soluble fractions from innervated and denervated muscles by SDS-PAGE and immunoblotting. Source data are available for this figure: SourceData F2.
Figure S1.
Figure S1.
Expression of most proteasome genes’ return to basal levels in muscle at 14 days after denervation. (A) To gain a broad view of transcriptional changes in the late phase of atrophy, 14-day denervated TA muscles were compared with innervated muscles by RNA-seq. Transcripts of several proteasome subunits and one proteasome chaperone were identified, and only nine subunits were significantly induced in denervated compared to innervated muscles (induced subunits shown in green). (B) Increased protein levels were confirmed for representative genes by analysis of soluble fractions from innervated and denervated muscles by SDS-PAGE and immunoblotting. Source data are available for this figure: SourceData FS1.
Figure 3.
Figure 3.
Increased proteasome assembly is a delayed response to muscle denervation. (A) Innervated and denervated muscle homogenates were analyzed by native polyacrylamide gel electrophoresis and in-gel LLVY-AMC (β5 proteasome substrate) hydrolysis. The native gel was then photographed and visualized under UV light to detect the activities of proteasome holoenzyme complexes (RP2-CP, RP1-CP); 20S activity was detected by the addition of SDS (panel b). The native gel was then subjected to immunoblotting for PSMC1(Rpt2) and PSMD2 (Rpn1) in native (panels c and d) and denaturing (panel e) gels. (B) shGankyrin downregulates gankyrin in NIH-3T3 cells. mRNA preparations from cells transfected with shLacz control or shGankyrin were analyzed by RT-PCR and specific primers to gankyrin. Means ± SEM are presented as a ratio to shLacz. N = 3 wells of cells per shRNA. *, P < 0.05 versus shLacz by one-tailed paired Student’s t test. (C) Gankyrin is required for proteasome assembly in atrophying mouse muscles. Innervated and denervated TA muscles expressing shGankyrin or scrambled shLacz (control) were analyzed by native gel and in-gel LLVY-AMC hydrolysis assay. (D) Downregulation of gankyrin in denervated muscles attenuates fiber atrophy. Measurements of cross-sectional areas of 590 fibers expressing shGankyrin (green fibers, also express GFP) and adjacent 590 non-transfected fibers. N = 5 mice. Statistics in Table 1. A representative image of electroporated muscle is shown. Fiber membrane staining (red) using wheat germ agglutinin (WGA). Scale bar: 50 μm. Source data are available for this figure: SourceData F3.
Figure 4.
Figure 4.
PAX4 induces proteasome genes in vivo. (A) Proteasome gene expression was measured by RT-PCR analysis of mRNA preparations from innervated and 10-day denervated muscles expressing shPAX4 or shLacz control. Means ± SEM are presented as a ratio to innervated. N = 5 mice per condition. *, P < 0.05, **, P < 0.005, ***, P < 0.0005 versus innervated shLacz; #, P < 0.05 and ##, P < 0.005 versus denervated shLacz by one-tailed unpaired Student’s t test. (B) PAX4 downregulation with shPAX4 reduces fiber atrophy on denervation. Measurement of cross-sectional areas of 1,178 fibers from 10-day denervated fibers expressing shPAX4 (green fibers, also express GFP) vs. 1,178 adjacent non-transfected fibers. N = 3 mice. Statistics in Table 1. Right: representative image of transfected muscle. Fiber membrane staining (red) using WGA. Scale bar: 50 μm. (C) Top: Strategy for generating PAX4 conditional KO mice. Middle: DNA was isolated from tail snippings and analyzed by PCR genotyping. Following tamoxifen injections of Cre+/−/PAX4fl/fl mice, removal of PAX4 from the genome was verified using the P1/P3 primers (Table S3). Bottom: nuclear extracts from WT and KO mice were analyzed by immunoblotting using PAX4 antibody. (D) Body weight (g) and survival (%) of PAX4 KO and WT mice are presented, following tamoxifen injections and muscle denervation. (E and F) PAX4 mRNA levels increase on denervation of WT mouse muscle but are absent in muscles from PAX4 KO mice. Mice were injected with tamoxifen and their muscles denervated. PCR (E) or RT-PCR (F) using primers for PAX4 was performed on mRNA preparations from innervated and denervated muscles. Means ± SEM are presented as a ratio to WT innervated. N = 5 mice per condition. *, P < 0.05 versus innervated in WT; #, P < 0.05 versus denervated in WT by one-tailed unpaired Student’s t test. (G and H) Proteasome gene expression was measured by RT-PCR analysis of mRNA preparations from innervated and 10 days (G) or 3 days (H) denervated muscles from WT and PAX4 KO mice. Means ± SEM are presented as ratio to WT innervated. N = 5 mice per condition. *, P < 0.05 and **P < 0.005 vs. innervated in WT; #, P < 0.05 and ##, P < 0.005 versus denervated in WT by one-tailed unpaired Student’s t test. (I) PAX4 enters the nucleus at 3 days after denervation. Cytosolic and the corresponding nuclear fractions from innervated and denervated (at 3, 7, 10 days) muscles were analyzed by SDS-PAGE and immunoblotting. (J) PAX4 binds the promoter region of PSMC2 gene. ChIP was performed on innervated and denervated (10 days) muscles from WT or PAX4 KO mice using PAX4 antibody or non-specific IgG control, and primers for the PSMC2 gene. Data are plotted as mean fold change relative to IgG control ± SEM and represents three independent experiments. N = 3 mice per condition. *, P < 0.05 versus IgG in WT; #P < 0.05 versus denervated in WT by one-tailed unpaired Student’s t test. (K) Correlative reduction in protein levels was confirmed for representative genes by analysis of soluble fractions from innervated and denervated muscles from WT or PAX4 KO mice by SDS-PAGE and immunoblotting. (L) The content of active assembled proteasomes increase in denervated muscles, but not in muscles lacking PAX4. Measurement of proteasome content by native gels and immunoblotting and proteasome peptidase activity by LLVY-AMC hydrolysis. Source data are available for this figure: SourceData F4.
Figure S2.
Figure S2.
PAX4 deficiency attenuates muscle atrophy. Measurement of cross-sectional areas of 661 fibers from 10 days denervated muscles from WT versus 661 fibers from PAX KO mice. N = 3 mice. Statistics in Table S1. Right: Representative images of muscle cross sections. Fiber membrane staining (red) using laminin antibody, and nuclei staining using Hoechst. Scale bar: 50 μm.
Figure 5.
Figure 5.
α-PALNRF-1 is required for proteasome gene induction in vivo. (A and B) Proteasome gene expression was measured by RT-PCR analysis of mRNA preparations from innervated and 3 days (A) or 10 days (B) denervated muscles expressing a dominant negative form of FOXO3 (FOXO3ΔC) or shLacz. FOXO3ΔC expression blocked the induction of two proteasome subunit genes (Rpn6 and Rpn9) at 10 days but had no effect on proteasome gene induction at 3 days. Means ± SEM are presented as a ratio to WT innervated. N = 4 mice per condition. *, P < 0.05 versus innervated shLacz; #P < 0.05 versus denervated shLacz by one-tailed unpaired Student’s t test. (C and D) Whether or not FOXO3 is inhibited, the content of active assembled proteasomes does not change in denervated muscles. Measurement of proteasome content by native gels and immunoblotting, and proteasome peptidase activity by LLVY-AMC hydrolysis. Innervated muscles and ones denervated for 3 days (C) or 10 days (D) expressing shLacz or FOXO3-DN were analyzed. (E and F) TA muscles were electroporated with a plasmid encoding α-PALNRF-1-dominant negative (α-PALNRF-1-DN) or shLacz and mRNA preparations from transfected muscles were analyzed by RT-PCR and specific primers at 10 days (E) or 3 days (F) after denervation. Means ± SEM are presented as a ratio to innervated. N = 5 mice per condition. *P < 0.05 versus innervated; #, P < 0.05 and ##, P < 0.001 versus denervated shLacz by one-tailed unpaired Student’s t test. Blots show FLAG-α-PALNRF-1-DN expression in transfected muscles using anti-flag. (G) Inhibition of α-PALNRF-1 by the overexpression of α-PALNRF-1-DN reduces atrophy of denervated muscles. Mean ± SEM weights of denervated TA muscles are depicted as percent of innervated. N = 5 mice per time point. *, P < 0.05 and **, P < 0.005 versus innervated shLacz; #, P < 0.05 versus denervated shLacz by one-tailed unpaired Student’s t test. Source data are available for this figure: SourceData F5.
Figure S3.
Figure S3.
NRF-1NFE2L1 downregulation reduces the expression of some proteasome genes in denervated muscle. (A) shNFE2L1 downregulates NFE2L1 in NIH-3T3 cells. mRNA preparations from cells transfected with shLacz control or shNFE2L1 were analyzed by RT-PCR and specific primers to NFE2L1. Means ± SEM are presented as ratio to shLacz. N = 5 wells of cells per shRNA. *, P < 0.05 versus shLacz by one-tailed paired Student’s t test. (B and C) Expression of proteasome genes (B) and UPS components (C) was measured by RT-PCR analysis of mRNA preparations from innervated and 10-day denervated muscles expressing shNFE2L1 or shLacz. Means ± SEM are presented as a ratio to innervated. N = 4 mice per condition. *, P < 0.05 and **, P < 0.005 versus innervated shLacz; #, P < 0.05 versus denervated shLacz by one-tailed unpaired Student’s t test. (D) Downregulation of NFE2L1 by shNFE2L1 does not attenuate the atrophy of denervated muscles (10 days). Graph depicts mean weights (mg) ± SEM of denervated TA muscles. N = 6 mice per condition. **, P < 0.005 versus innervated shLacz by one-tailed unpaired Student’s t test.
Figure 6.
Figure 6.
Proteasome gene expression is dependent on both PAX4 and α-PALNRF-1. (A) Strategy for generating α-PALNRF-1 and PAX4/α-PALNRF-1 double conditional KD mice. Following tamoxifen injections, removal of α-PALNRF-1 from one allele in the genome was verified using the U3/U5 primers (Table S3). (B and C) Mean body weights (g) (B) and percent survival (C) ± SEM of PAX4 KO, α-PALNRF-1 KD, PAX4/α-PALNRF-1 double conditional KD, and WT control mice are presented, following tamoxifen injections and muscle denervation. N = 10 mice per condition. **, P < 0.005 and ***, P < 0.0005 versus WT by one-tailed unpaired Student’s t test. (D) α-PALNRF-1 mRNA levels increase at 7–10 days after denervation, but not in denervated muscles from α-PALNRF-1 KD mice. Mice were injected with tamoxifen and their muscles were denervated (3, 7, or 10 days). RT-PCR using primers for α-PALNRF-1 was performed on mRNA preparations from innervated and denervated muscles. Means ± SEM are presented as a ratio to WT innervated. N = 4 mice per condition. *, P < 0.05 versus innervated in WT; #, P < 0.05 versus denervated (10 days). (E) α-PALNRF-1 accumulates in the nucleus at 7 days after denervation. Nuclear fractions from innervated and denervated (at 3, 7, and 10 days) muscles were analyzed by SDS-PAGE and immunoblotting. (F) Venn diagrams depicting the overlap between differentially expressed genes in muscles from α-PALNRF-1 KD and PAX4 KO mice following tamoxifen injections and muscle denervation. A significant overlap was detected for downregulated (P = 2.5e-29, Fisher Exact test) and upregulated (P = 3.3e-266, Fisher’s exact test) genes compared with denervated in WT. (G) Denervated muscles (10 days) were compared to innervated muscles by RNA sequencing. Presented are proteasome subunits whose induction was blocked in α-PALNRF-1 KD (yellow) and PAX4/α-PALNRF-1 double KD (green) mice, with the latter group of genes being fully contained within the first. (H) A heatmap representing the calculated fold changes for expression of proteasome genes in denervated (10 days) muscles from PAX4/α-PALNRF-1 double KD (left column), α-PALNRF-1 KD (middle column) and PAX4 KO (right column) mice versus innervated in WT. Asterisks denote significant fold changes (* Padj range 0.05–0.01, ** Padj 0.01–0.001, *** Padj < 0.001). (I) PAX4 and α-PALNRF-1 bind the promoter region of PSMB3 gene. ChIP was performed on denervated (10 days) muscles from WT mice using PAX4 or α-PALNRF-1 antibodies, or non-specific IgG control, and primers for PSMB3 gene. Data is plotted as mean fold change relative to IgG control ± SEM and represents three independent experiments. N = 3 mice per condition. *, P < 0.05 versus IgG by one-tailed unpaired Student’s t test. (J) The content of active assembled proteasomes increase in denervated (10 days) muscles, but not in muscles lacking both PAX4 and α-PALNRF-1. Measurement of proteasome content by native gels and immunoblotting, and proteasome peptidase activity by LLVY-AMC hydrolysis. Source data are available for this figure: SourceData F6.
Figure S4.
Figure S4.
PAX4 controls the expression of the proteasome assembly chaperon PSMD5 at 3 days after denervation. (A and B) mRNA preparations from denervated (3 and 10 days) muscles from WT, PAX4 KO, α-PALNRF-1 KD, and PAX4/α-PALNRF-1 KD mice were analyzed by RT-PCR. Means ± SEM are presented as a ratio to WT innervated. N = 4 mice per condition. *, P < 0.05, **, P < 0.005, and ***, P < 0.0005 versus innervated in WT; #, P < 0.05 versus denervated in WT by one-tailed unpaired Student’s t test.

Update of

Similar articles

References

    1. Anders, S., Pyl P.T., and Huber W.. 2015. HTSeq--a Python framework to work with high-throughput sequencing data. Bioinformatics. 31:166–169. 10.1093/bioinformatics/btu638 - DOI - PMC - PubMed
    1. Argadine, H.M., Hellyer N.J., Mantilla C.B., Zhan W.Z., and Sieck G.C.. 2009. The effect of denervation on protein synthesis and degradation in adult rat diaphragm muscle. J. Appl. Physiol. 107:438–444. 10.1152/japplphysiol.91247.2008 - DOI - PMC - PubMed
    1. Argilés, J.M., Campos N., Lopez-Pedrosa J.M., Rueda R., and Rodriguez-Mañas L.. 2016. Skeletal muscle regulates metabolism via interorgan crosstalk: Roles in health and disease. J. Am. Med. Dir. Assoc. 17:789–796. 10.1016/j.jamda.2016.04.019 - DOI - PubMed
    1. Aweida, D., and Cohen S.. 2021. Breakdown of filamentous myofibrils by the UPS-step by step. Biomolecules. 11:110. 10.3390/biom11010110 - DOI - PMC - PubMed
    1. Bar-Nun, S., and Glickman M.H.. 2012. Proteasomal AAA-ATPases: Structure and function. Biochim. Biophys. Acta. 1823:67–82. 10.1016/j.bbamcr.2011.07.009 - DOI - PubMed

MeSH terms

Substances

LinkOut - more resources