

Comparing penalization methods for linear models on large observational health data
- PMID: 38767857
- PMCID: PMC11187433
- DOI: 10.1093/jamia/ocae109
Comparing penalization methods for linear models on large observational health data
Abstract
Objective: This study evaluates regularization variants in logistic regression (L1, L2, ElasticNet, Adaptive L1, Adaptive ElasticNet, Broken adaptive ridge [BAR], and Iterative hard thresholding [IHT]) for discrimination and calibration performance, focusing on both internal and external validation.
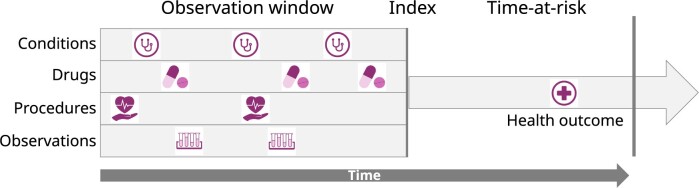
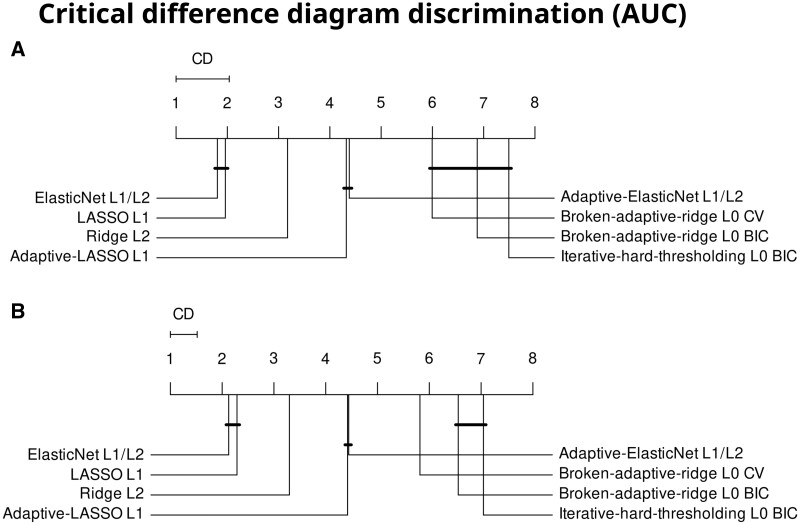
Materials and methods: We use data from 5 US claims and electronic health record databases and develop models for various outcomes in a major depressive disorder patient population. We externally validate all models in the other databases. We use a train-test split of 75%/25% and evaluate performance with discrimination and calibration. Statistical analysis for difference in performance uses Friedman's test and critical difference diagrams.
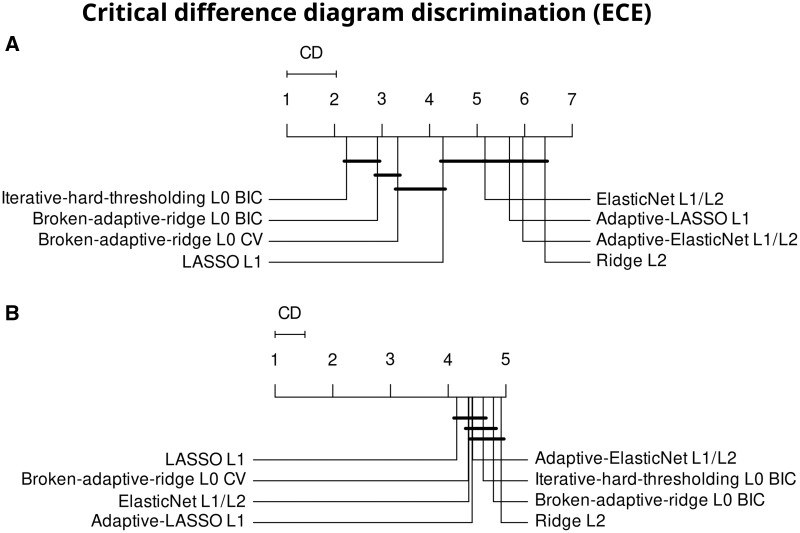
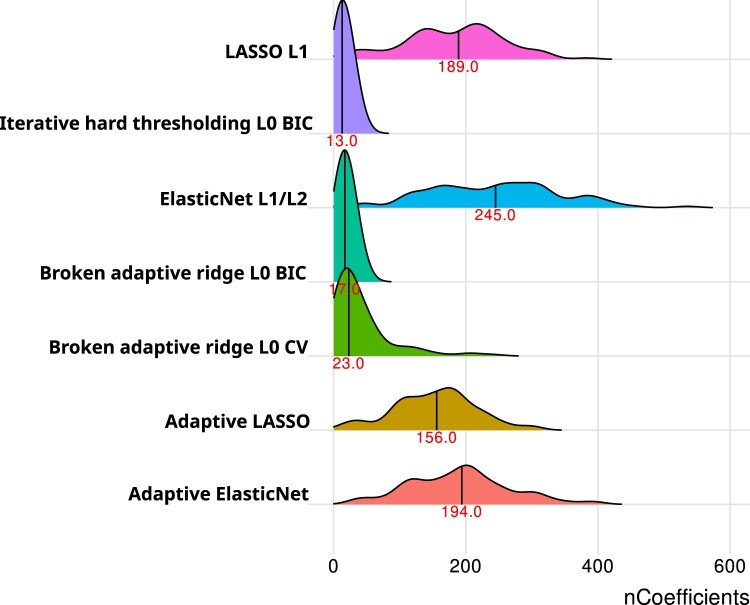
Results: Of the 840 models we develop, L1 and ElasticNet emerge as superior in both internal and external discrimination, with a notable AUC difference. BAR and IHT show the best internal calibration, without a clear external calibration leader. ElasticNet typically has larger model sizes than L1. Methods like IHT and BAR, while slightly less discriminative, significantly reduce model complexity.
Conclusion: L1 and ElasticNet offer the best discriminative performance in logistic regression for healthcare predictions, maintaining robustness across validations. For simpler, more interpretable models, L0-based methods (IHT and BAR) are advantageous, providing greater parsimony and calibration with fewer features. This study aids in selecting suitable regularization techniques for healthcare prediction models, balancing performance, complexity, and interpretability.
Keywords: calibration; discrimination; electronic health records; logistic regression; regularization.
© The Author(s) 2024. Published by Oxford University Press on behalf of the American Medical Informatics Association.
Conflict of interest statement
E.A.F. and P.R. work for a research group who received unconditional research grants from Boehringer-Ingelheim, GSK, Janssen Research & Development, Novartis, Pfizer, Yamanouchi, Servier. None of these grants result in a conflict of interest to the content of this paper. J.M.R. is an employee of Janssen R&D and shareholder of JNJ. M.A.S. receives contracts and grants from the US National Institutes of Health, the US Food & Drug Administration and Janssen Research & Development, all outside the scope of this work.
Figures
References
-
- Tibshirani R. Regression shrinkage and selection via the LASSO. J R Stat Soc B. 1996;58(1):267-288.
-
- Siontis GCM, Tzoulaki I, Castaldi PJ, et al. External validation of new risk prediction models is infrequent and reveals worse prognostic discrimination. J Clin Epidemiol. 2015;68(1):25-34. - PubMed
