. 2024 May 16;134(13):e180254.
doi: 10.1172/JCI180254.

Susceptibility to innate immune activation in genetically mediated myocarditis

Affiliations

Susceptibility to innate immune activation in genetically mediated myocarditis

Daniel F Selgrade et al. J Clin Invest. .

Abstract

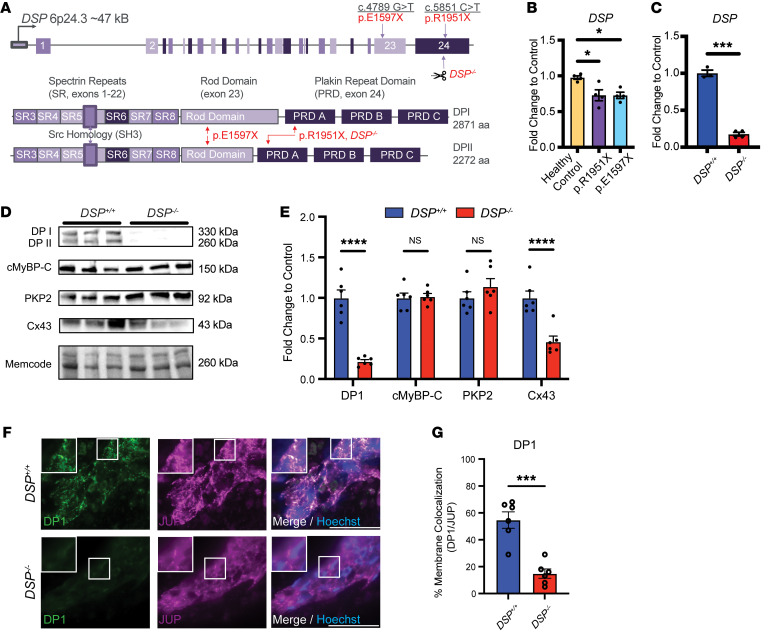
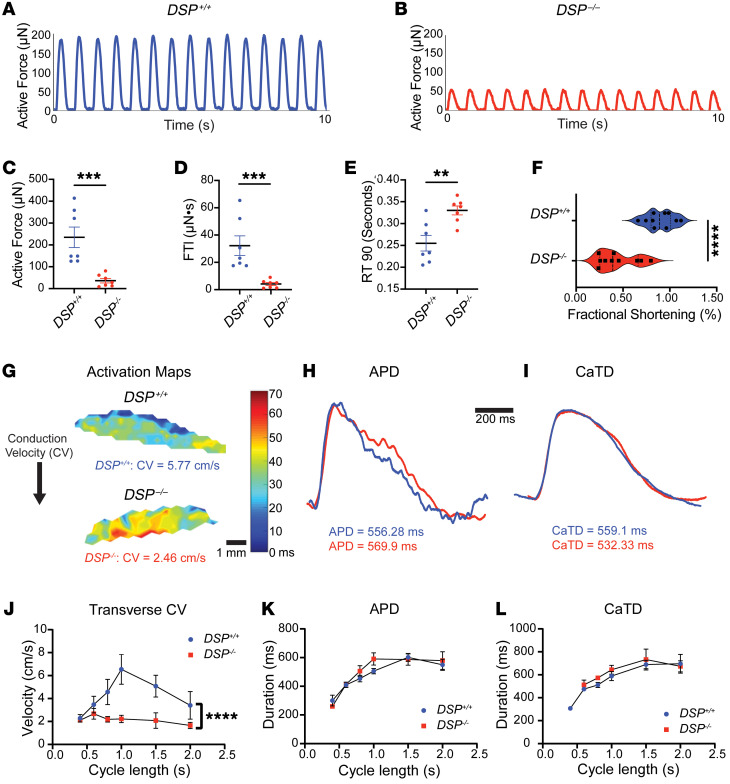
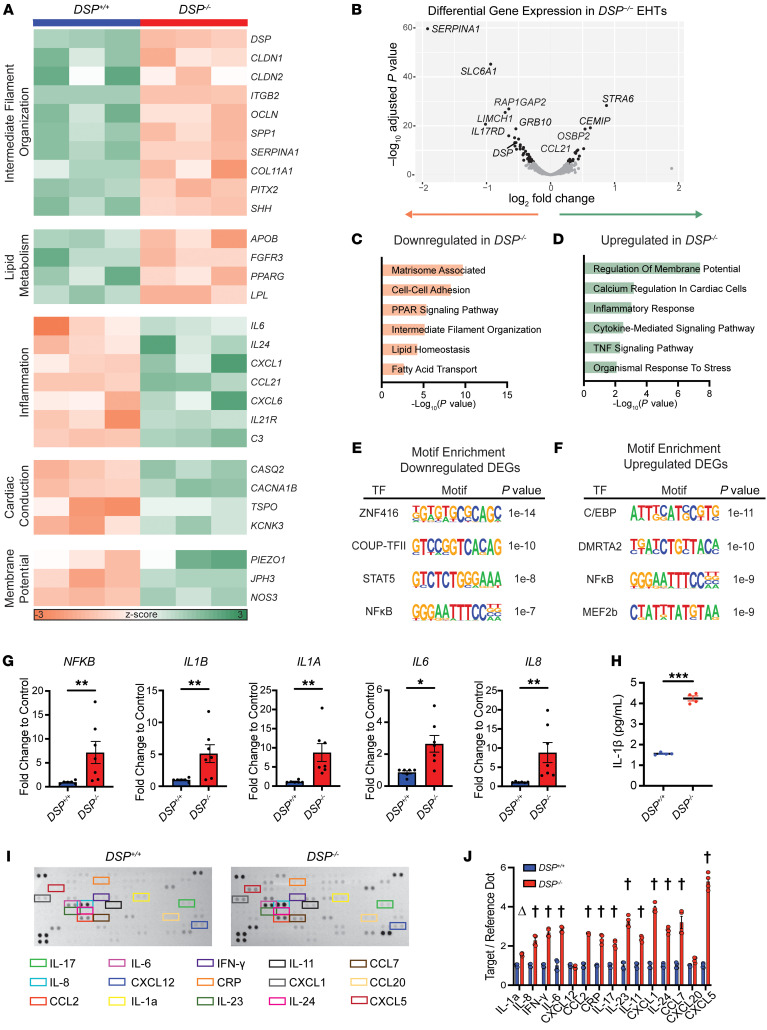
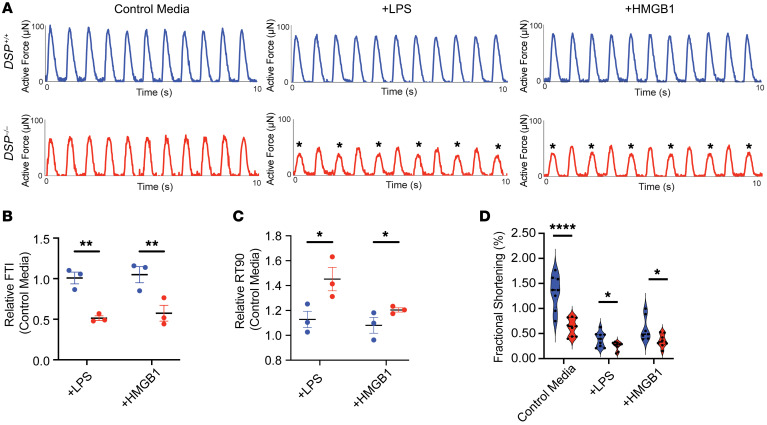
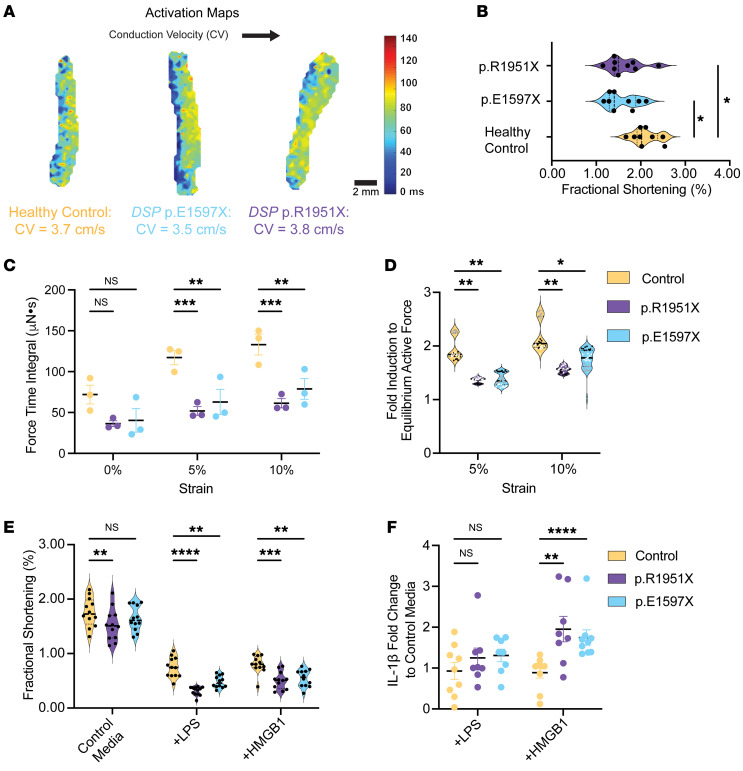
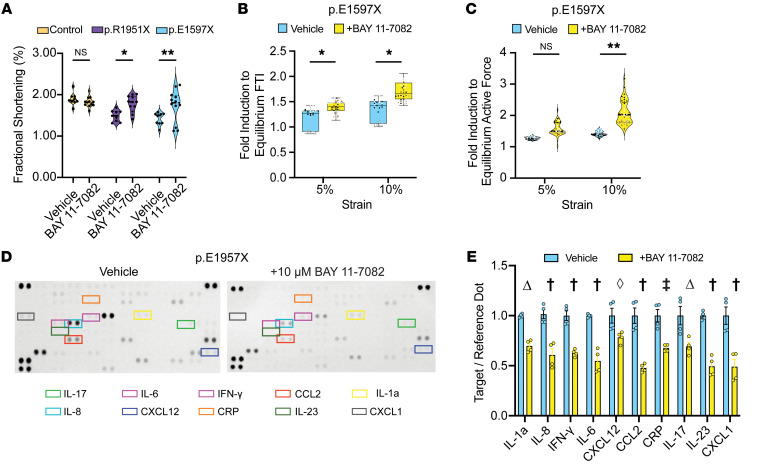
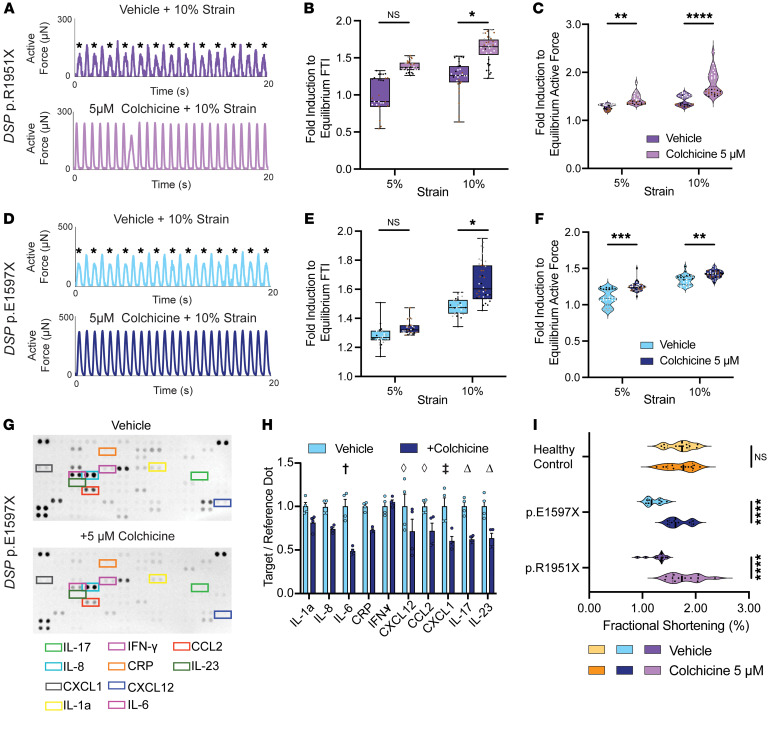
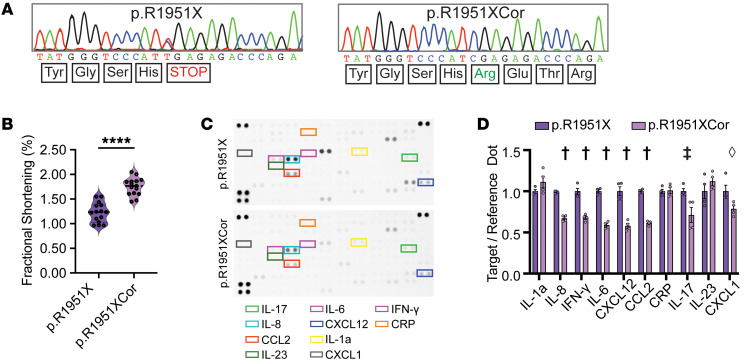
Myocarditis is clinically characterized by chest pain, arrhythmias, and heart failure, and treatment is often supportive. Mutations in DSP, a gene encoding the desmosomal protein desmoplakin, have been increasingly implicated in myocarditis. To model DSP-associated myocarditis and assess the role of innate immunity, we generated engineered heart tissues (EHTs) using human induced pluripotent stem cell-derived cardiomyocytes (hiPSC-CMs) from patients with heterozygous DSP truncating variants (DSPtvs) and a gene-edited homozygous deletion cell line (DSP-/-). At baseline, DSP-/- EHTs displayed a transcriptomic signature of innate immune activation, which was mirrored by cytokine release. Importantly, DSP-/- EHTs were hypersensitive to Toll-like receptor (TLR) stimulation, demonstrating more contractile dysfunction compared with isogenic controls. Relative to DSP-/- EHTs, heterozygous DSPtv EHTs had less functional impairment. DSPtv EHTs displayed heightened sensitivity to TLR stimulation, and when subjected to strain, DSPtv EHTs developed functional deficits, indicating reduced contractile reserve compared with healthy controls. Colchicine or NF-κB inhibitors improved strain-induced force deficits in DSPtv EHTs. Genomic correction of DSP p.R1951X using adenine base editing reduced inflammatory biomarker release from EHTs. Thus, EHTs replicate electrical and contractile phenotypes seen in human myocarditis, implicating cytokine release as a key part of the myogenic susceptibility to inflammation. The heightened innate immune activation and sensitivity are targets for clinical intervention.

Keywords: Cardiology; Cell stress; Cytokines; Genetic diseases; Inflammation.


Conflict of interest statement

Conflict of interest: EMM is a consultant for Amgen, Cytokinetics, PepGen, and Tenaya Therapeutics and is the founder of Ikaika Therapeutics. JO is currently an employee of AbbVie. ALG receives research support from Biohaven Pharmaceutical, Praxis Precision Medicines, and Neurocrine Biosciences and has served as a consultant to Amgen. KJC has consulted for Nuevocor. PWB has ownership interests in Clever Carnivore and Defined Bioscience and receives royalty payments from Stanford University.

Figures

Figure 1
Figure 1. EHTs with DSP truncating variants.
(A) The DSP locus includes 24 exons and is alternatively spliced to produce DPI and DPII. Heterozygous DSP nonsense mutations p.E1597X and p.R1951X fall within the rod domain (exon 23) and plakin repeat domain (exon 24), respectively. DSP p.E1597X was identified in a young woman presenting with classical myocarditis while the individual with DSP p.R1951X had a family history of myocarditis. Scissors mark the site of CRISPR/Cas9 guides used to generate DSP–/– homozygous hiPSCs. Homozygous DSP–/– EHTs were generated to compare severity with the patient-derived heterozygous DSP truncations. (B) DSP transcript was reduced in DSP p.R1951X and p.E1597X heterozygous patient cardiomyocytes compared with healthy control (*<0.05 by 2-way ANOVA; n = 4 per condition; data reflect 2 independent differentiations). (C) DSP mRNA was reduced in DSP–/– EHTs compared with isogenic control EHTs (***< 0.001 by 2-tailed t test with Welch’s correction; n = 3 DSP+/+ and n = 4 DSP–/–; data reflect 2 independent differentiations). (D and E) Immunoblot of DSP–/– hiPSC-CMs demonstrated substantial loss of DPI, DPII, and connexin 43 (Cx43) staining compared with isogenic controls (DSP+/+). Staining of desmosome component PKP2 and sarcomere component cMyBP-C demonstrated no significant difference between lines as quantified in E (****< 0.0001 by 2-way ANOVA; n = 6 DSP+/+ and n = 6 DSP–/–; data reflect 3 independent differentiations). (F) Representative immunofluorescence imaging of DSP+/+ and DSP–/– EHTs staining for DPI (green) and desmosome component plakoglobin (JUP, purple). Nuclei appear blue. Scale bars represent 100 μm. All insets are 100× original magnification. Insets depict intercalated disc–like structures with lower membrane localization of DPI in DSP–/– EHTs compared with control as measured by colocalization with JUP (G) (***< 0.001 by 2-tailed t test with Welch’s correction; n = 6 per condition). All data presented as mean ± SEM.
Figure 2
Figure 2. Mechanical and electrical defects in DSP–/– EHTs.
(A and B) Active force of DSP–/– and isogenic DSP+/+ control EHTs recorded at baseline. (C and D) Peak force and force time integral (FTI) were significantly reduced in DSP–/– EHTs compared with DSP+/+ EHTs. (E) The time to 90% force reduction from peak (RT 90) was prolonged in DSP–/– compared with DSP+/+ EHTs. (***< 0.001, **< 0.01 by Mann-Whitney U test; n = 7 DSP+/+ and n = 7 DSP–/–; data reflect 7 independent batches.) (F) Fractional shortening (FS) of DSP–/– EHTs was significantly reduced at baseline (****< 0.0001 by 2-tailed t test with Welch’s correction; n = 10 DSP+/+ and n = 10 DSP–/–; data reflect 3 independent batches). (G) Optical mapping of DSP+/+ and DSP–/– EHTs at cycle length of 1 second measuring transverse conduction velocity (CV) with representative action potential duration (APD) (H) and Ca2+ transient duration (CaTD) (I). (JL) Restitution curves of DSP–/– and DSP+/+ EHTs demonstrated significant reduction of CV (J) with no difference in APD (K) and CaTD (L) across cycle lengths (****< 0.0001 by nonlinear regression analysis, n = 4–6 EHTs per condition across 3 batches). All data presented as mean ± SEM.
Figure 3
Figure 3. Inflammatory signatures in gene expression and cytokine release from DSP–/– EHTs.
(AD) RNA-Seq analysis of DSP+/+ and DSP–/– EHTs identified differentially expressed genes (DEGs). (A) Heatmap of selected transcripts associated with Gene Ontology (GO) terms in DSP–/– compared with DSP+/+ EHTs. (B) Volcano plot of RNA-Seq showing significant DEGs between DSP–/– and DSP+/+ EHTs, highlighting the top transcripts by P value (gray P > 0.05, black P < 0.05). (C and D) GO term analysis shows downregulation of intermediate filament organization and lipid metabolism terms (C) and upregulation of inflammation, cardiac conduction, and membrane potential terms (D) in DSP–/– EHTs compared with control. (E and F) Motif enrichment analysis of the top 300 DEGs identified transcription factor (TF) motifs associated with downregulated DEGs (E) and upregulated DEGs (F) in DSP–/– compared with DSP+/+ EHTs. Motifs depicted represent consensus sequences to which DEGs aligned with P value for enrichment. (G) RT-qPCR demonstrated an increase in inflammatory transcripts in DSP–/– compared with DSP+/+ (**< 0.01, *< 0.05 by Mann-Whitney U test; n = 6 DSP+/+ and n = 7 DSP–/–, 3 independent batches). (H) ELISA of IL-1β in EHT media demonstrated increased IL-1β in DSP–/– compared with DSP+/+ EHT media (***< 0.0001 by 2-tailed t test with Welch’s correction; n = 4 DSP+/+ and n = 4 DSP–/–). (I) Representative cytokine arrays were incubated with EHT media. The corner signals serve as reference markers (Reference Dots). Targets displayed in colored boxes are quantified (J) (Δ< 0.01, < 0.0001 by 2-way ANOVA with n = 4 DSP+/+ and n = 4 DSP–/–; data reflect 2 independent batches). All data presented as mean ± SEM.
Figure 4
Figure 4. Innate immune activation exacerbates contractile deficits in DSP–/– EHTs.
(A) Representative forces from DSP+/+ and DSP–/– EHTs recorded following 48 hours of exposure to normal media or media containing LPS or HMGB1. In DSP–/– EHTs, LPS and HMGB1 exposure markedly impaired force production and elicited alternans (marked with asterisks). (B) Relative to control media, DSP–/– EHTs had a greater reduction in FTI after LPS and HMGB1 exposure compared with DSP+/+ EHTs after similar exposure. (C) RT90 was also more prolonged in DSP–/– EHTs after LPS and HMGB1 compared with DSP+/+ EHTs cultured under inflammatory conditions (*< 0.05, **< 0.01 by 2-way ANOVA, n = 3 DSP+/+ and n = 3 DSP–/–; data reflect 3 independent batches). (D) Exposure to LPS or HMGB1 reduced fractional shortening in DSP+/+ and DSP–/– EHTs (*< 0.01, ****< 0.0001 by 2-tailed t test with Welch’s correction; n = 8 DSP+/+ and n = 8 DSP–/–; data reflect 3 independent differentiations). Data presented as mean ± SEM. Data presented as individual recordings normalized to average baseline measurement per EHT. Significance calculated based on mean value per EHT.
Figure 5
Figure 5. Strain-induced force loss in patient-derived DSP EHT models.
(A) Optical mapping of heterozygous DSP p.E1597X and DSP p.R1951X EHTs compared with EHTs from healthy control demonstrates comparable conduction velocities, distinct from those seen in DSP–/– EHTs. (B) Fractional shortening was only minimally reduced at baseline in DSP p.E1597X and p.R1951X EHTs compared with healthy control (*< 0.05 by 2-way ANOVA, n = 9–12 EHTs per condition, data representative of 3 batches). (C and D) FTI values from DSP p.E1597X and p.R1951X EHTs showed no significant difference in FTI compared with healthy control EHTs at baseline conditions. However, when subjected to 5% or 10% strain, both p.E1597X and p.R1951X EHTs failed to augment contraction as seen with healthy control EHTs (D), consistent with the requirement for additional stressors to manifest reduced contractility and reflecting the reduced contractile reserved of DSP heterozygous EHTs (*< 0.05, **< 0.01, ***< 0.001 by 2-way ANOVA, n = 3 EHTs per condition from 3 independent batches, labeled as n1 = black dots, n2 = white dots, n3 = gray dots). (E) After LPS or HMGB1 exposure, DSPtv EHTs had more marked reduced fractional shortening compared with similarly exposed healthy control EHTs (**< 0.01, ***< 0.001, ****< 0.0001 by 2-way ANOVA, n = 12 EHTs per condition). (F) LPS stimulated greater IL-1β release into the media compared with healthy control (**< 0.01, ****< 0.0001 by Mann-Whitney U test, n = 8 EHTs per condition). Data presented as individual recordings normalized to average baseline measurement per EHT. Significance calculated based on mean value per EHT.
Figure 6
Figure 6. Improved contractile function with NF-κB inhibition in DSP EHTs.
(A) Treatment with BAY 11-7082, an NF-κB inhibitor, improved fractional shortening of DSP p.E1597X and p.R1951X EHTs with no significant effect on healthy control cells (*< 0.05, **< 0.01 by 2-way ANOVA, n = 9–12 EHTs per condition, data representative of 3 batches). (B and C) BAY 11-7082 improved strain-induced force loss in DSP p.E1597X EHTs as measured in force time integral (B) and active force (C) (*< 0.05, **< 0.01 by 2-way ANOVA, n = 3–4 EHTs per condition across 2 batches, labeled as n1 = black dots, n2 = white dots, n3 = gray dots, n4 = brown dots). Box plots show the interquartile range, median (line), and minimum and maximum (whiskers). (D and E) Cytokine arrays of p.E1597X EHT media showed a significant reduction of baseline cytokine secretion following BAY 11-7082 treatment (< 0.0001, < 0.001, Δ< 0.01, < 0.05 by 2-way ANOVA with n = 4 per condition). Data presented as individual recordings normalized to average baseline measurement per EHT. Significance calculated based on mean value per EHT.
Figure 7
Figure 7. Improved mechanical function with colchicine treatment of DSPtv EHTs.
(A) Representative force from DSP p.R1951X EHTs subjected to 10% strain with and without colchicine. Exposure to 10% strain produced marked mechanical alternans (marked with asterisks), which was corrected with colchicine treatment. (B and C) Colchicine significantly improved relative mechanical force production in DSP p.R1951X EHTs at baseline conditions and after isometric strain (*< 0.05, **< 0.01, ****< 0.0001 by 2-way ANOVA, n = 3–4 EHTs per condition, labeled as n1 = black dots, n2 = white dots, n3 = gray dots, n4 = brown dots). Box plots show the interquartile range, median (line), and minimum and maximum (whiskers). (D) DSP p.E1597X EHTs also showed marked alternans (marked with asterisks) after 10% strain, which was improved by colchicine. (E and F) Colchicine improved relative force in DSP p.E1597X EHTs at baseline and with 5% or 10% strain (*< 0.05, **< 0.01, ***< 0.001 by 2-way ANOVA, n = 3–4 EHTs per condition, labeled as n1 = black dots, n2 = white dots, n3 = gray dots, n4 = brown dots). (G and H) Cytokine arrays from p.E1597X EHT media showed a significant reduction of baseline cytokine secretion following colchicine treatment (< 0.0001, < 0.001, Δ< 0.01, < 0.05 by 2-way ANOVA with n = 4 per condition). (I) Fractional shortening of DSP p.E1597X and p.R1951X EHTs treated with 5 μM colchicine for 48 hours demonstrated improved contractility compared with vehicle control (****< 0.0001 by 2-way ANOVA, n = 9–12 EHTs per condition). Data presented as individual recordings normalized to average baseline measurement per EHT. Significance calculated based on mean value per EHT.
Figure 8
Figure 8. Base editing to correct DSP p.R1951X reduces inflammation in EHTs.
(A) Sanger sequencing of p.R1951X hiPSCs before and after base editing to correct the pathogenic DSP variant using gRNA8 and an adenine base editor (ABE). Base editing restored the reading frame, and the corrected line was termed p.R1951XCor. (B) Fractional shortening (FS) measurements of p.R1951X and p.R1951XCor EHTs showed improved contractility following genomic correction (****< 0.0001 by 2-tailed t test with Welch’s correction; n = 15 per condition). (C and D) Cytokine arrays of EHT media demonstrate significant reduction of cytokine secretion following genomic correction of DSP p.R1951X. Targets displayed in colored boxes are quantified in relation to Reference Dots (D) (< 0.0001, < 0.001, < 0.05 by 2-way ANOVA with n = 4 per condition). Data presented as mean ± SEM.

References

    1. Basso C. Myocarditis. N Engl J Med. 2022;387(16):1488–1500. doi: 10.1056/NEJMra2114478. - DOI - PubMed
    1. Ammirati E, et al. Acute myocarditis associated with desmosomal gene variants. JACC Heart Fail. 2022;10(10):714–727. doi: 10.1016/j.jchf.2022.06.013. - DOI - PubMed
    1. Bariani R, et al. Genetic background and clinical features in arrhythmogenic left ventricular cardiomyopathy: a systematic review. J Clin Med. 2022;11(15):4313. doi: 10.3390/jcm11154313. - DOI - PMC - PubMed
    1. Lota AS, et al. Genetic architecture of acute myocarditis and the overlap with inherited cardiomyopathy. Circulation. 2022;146(15):1123–1134. doi: 10.1161/CIRCULATIONAHA.121.058457. - DOI - PMC - PubMed
    1. McNally EM, Selgrade DF. Genetic testing for myocarditis. JACC Heart Fail. 2022;10(10):728–730. doi: 10.1016/j.jchf.2022.07.003. - DOI - PMC - PubMed