

Deep learning and digital pathology powers prediction of HCC development in steatotic liver disease
- PMID: 38768142
- PMCID: PMC11825480
- DOI: 10.1097/HEP.0000000000000904
Deep learning and digital pathology powers prediction of HCC development in steatotic liver disease
Abstract
Background and aims: Identifying patients with steatotic liver disease who are at a high risk of developing HCC remains challenging. We present a deep learning (DL) model to predict HCC development using hematoxylin and eosin-stained whole-slide images of biopsy-proven steatotic liver disease.
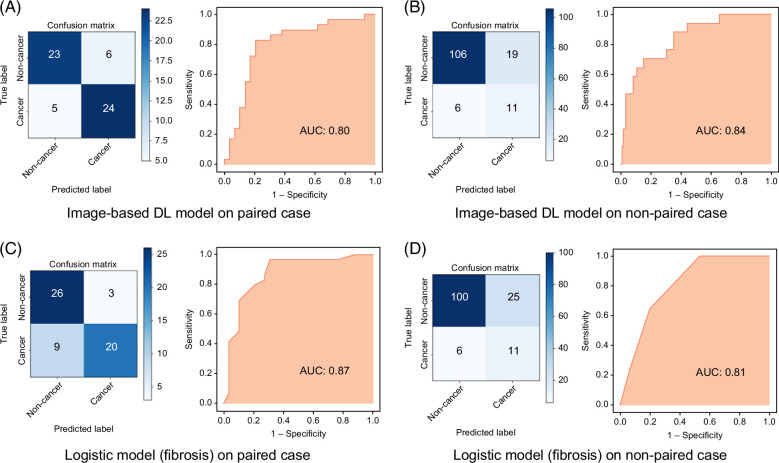
Approach and results: We included 639 patients who did not develop HCC for ≥7 years after biopsy (non-HCC class) and 46 patients who developed HCC <7 years after biopsy (HCC class). Paired cases of the HCC and non-HCC classes matched by biopsy date and institution were used for training, and the remaining nonpaired cases were used for validation. The DL model was trained using deep convolutional neural networks with 28,000 image tiles cropped from whole-slide images of the paired cases, with an accuracy of 81.0% and an AUC of 0.80 for predicting HCC development. Validation using the nonpaired cases also demonstrated a good accuracy of 82.3% and an AUC of 0.84. These results were comparable to the predictive ability of logistic regression model using fibrosis stage. Notably, the DL model also detected the cases of HCC development in patients with mild fibrosis. The saliency maps generated by the DL model highlighted various pathological features associated with HCC development, including nuclear atypia, hepatocytes with a high nuclear-cytoplasmic ratio, immune cell infiltration, fibrosis, and a lack of large fat droplets.
Conclusions: The ability of the DL model to capture subtle pathological features beyond fibrosis suggests its potential for identifying early signs of hepatocarcinogenesis in patients with steatotic liver disease.
Copyright © 2024 The Author(s). Published by Wolters Kluwer Health, Inc.
Conflict of interest statement
Yoshio Sumida is on the speakers’ bureau for Kowa, MSD, and Taisho. Hirokazu Takahashi received grants from Astellas and Sysmex. The remaining authors have no conflicts to report.
Figures


References
-
- Younossi Z, Tacke F, Arrese M, Chander Sharma B, Mostafa I, Bugianesi E, et al. Global perspectives on nonalcoholic fatty liver disease and nonalcoholic steatohepatitis. Hepatology. 2019;69:2672–2682. - PubMed
-
- Cotter TG, Rinella M. Nonalcoholic fatty liver disease 2020: The state of the disease. Gastroenterology. 2020;158:1851–1864. - PubMed
-
- Younossi ZM. Non-alcoholic fatty liver disease—A global public health perspective. J Hepatol. 2019;70:531–544. - PubMed
-
- Browning JD, Szczepaniak LS, Dobbins R, Nuremberg P, Horton JD, Cohen JC, et al. Prevalence of hepatic steatosis in an urban population in the United States: Impact of ethnicity. Hepatology. 2004;40:1387–1395. - PubMed
MeSH terms
LinkOut - more resources
Full Text Sources
Medical
