. 2024 May 28;121(22):e2402732121.
doi: 10.1073/pnas.2402732121. Epub 2024 May 20.

Ketamine can produce oscillatory dynamics by engaging mechanisms dependent on the kinetics of NMDA receptors

Affiliations

Ketamine can produce oscillatory dynamics by engaging mechanisms dependent on the kinetics of NMDA receptors

Elie Adam et al. Proc Natl Acad Sci U S A. .

Abstract

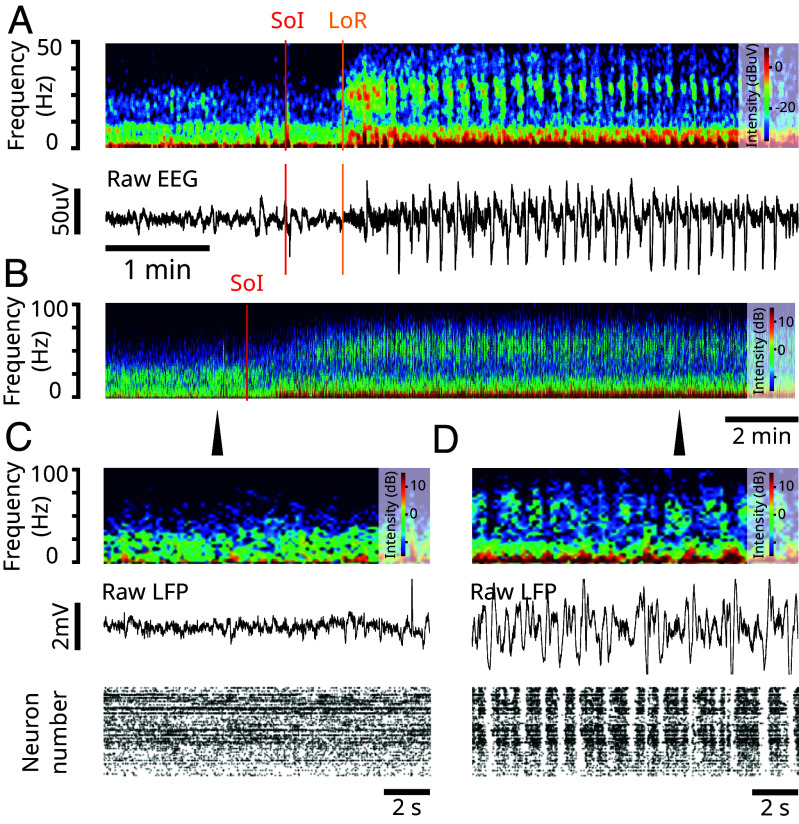
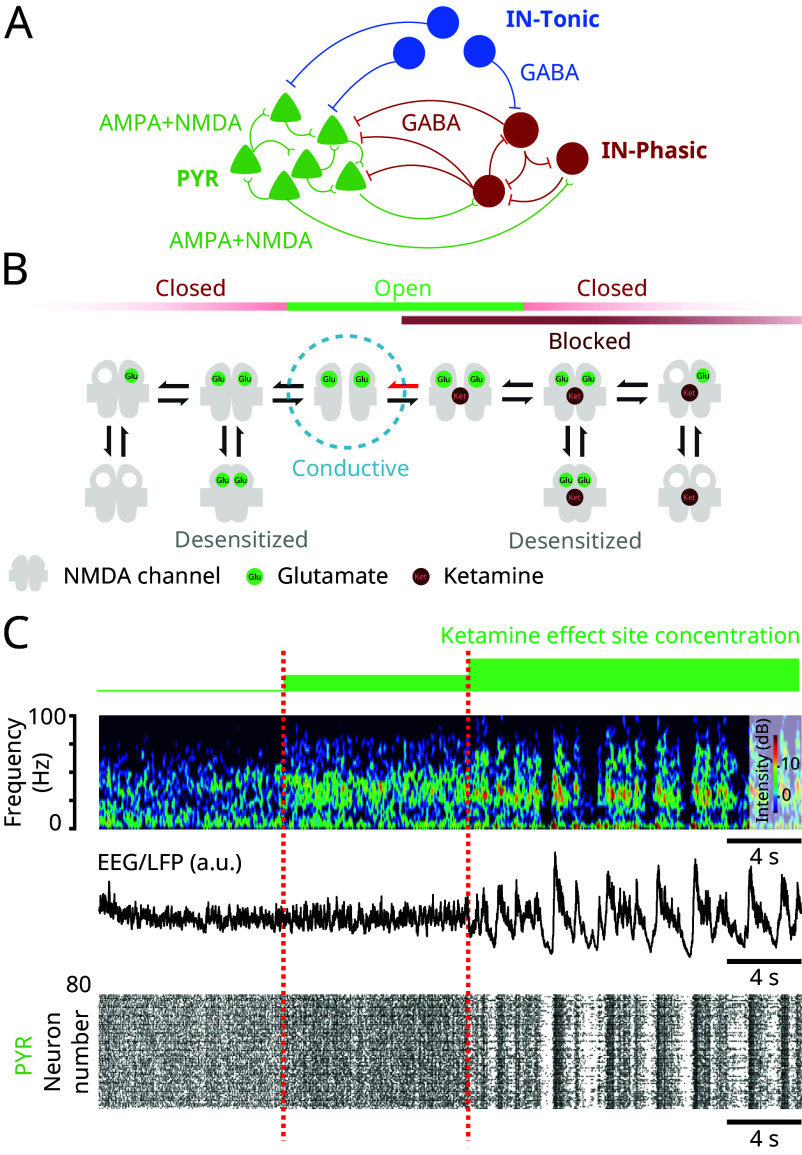
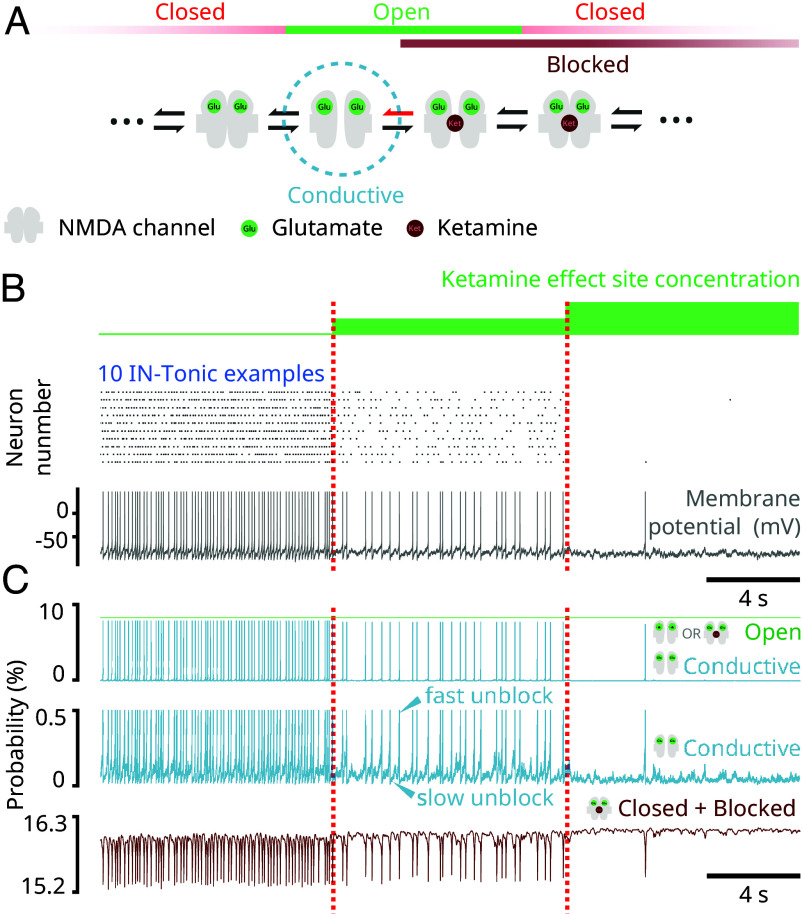
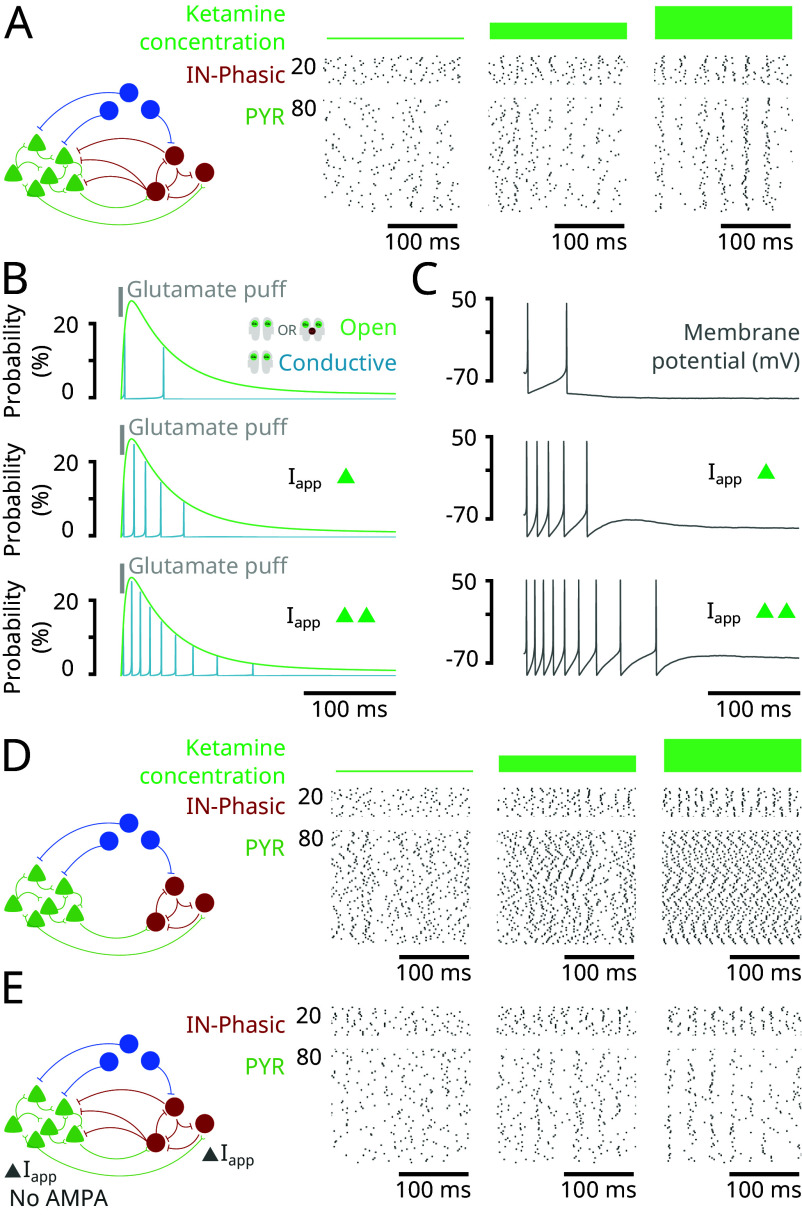
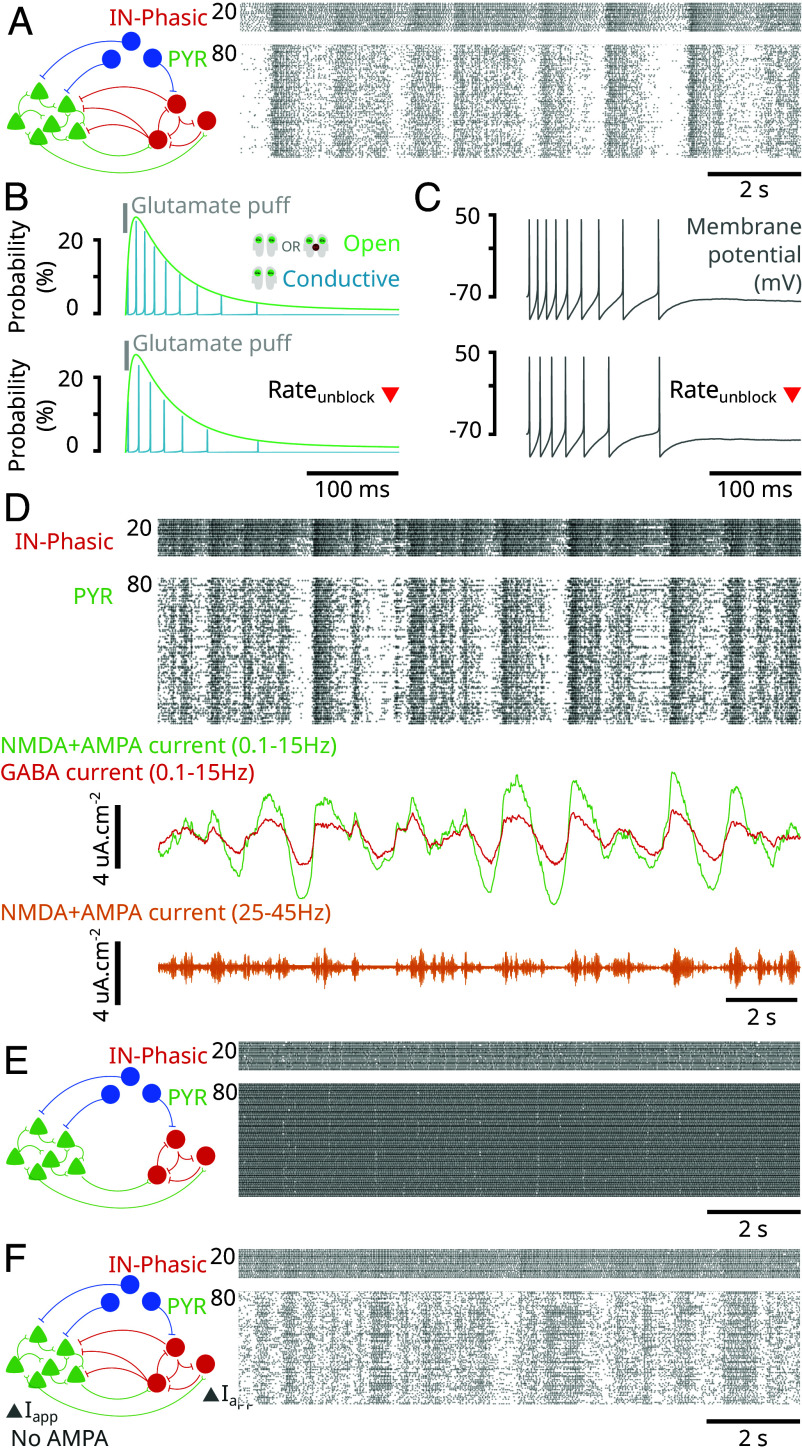
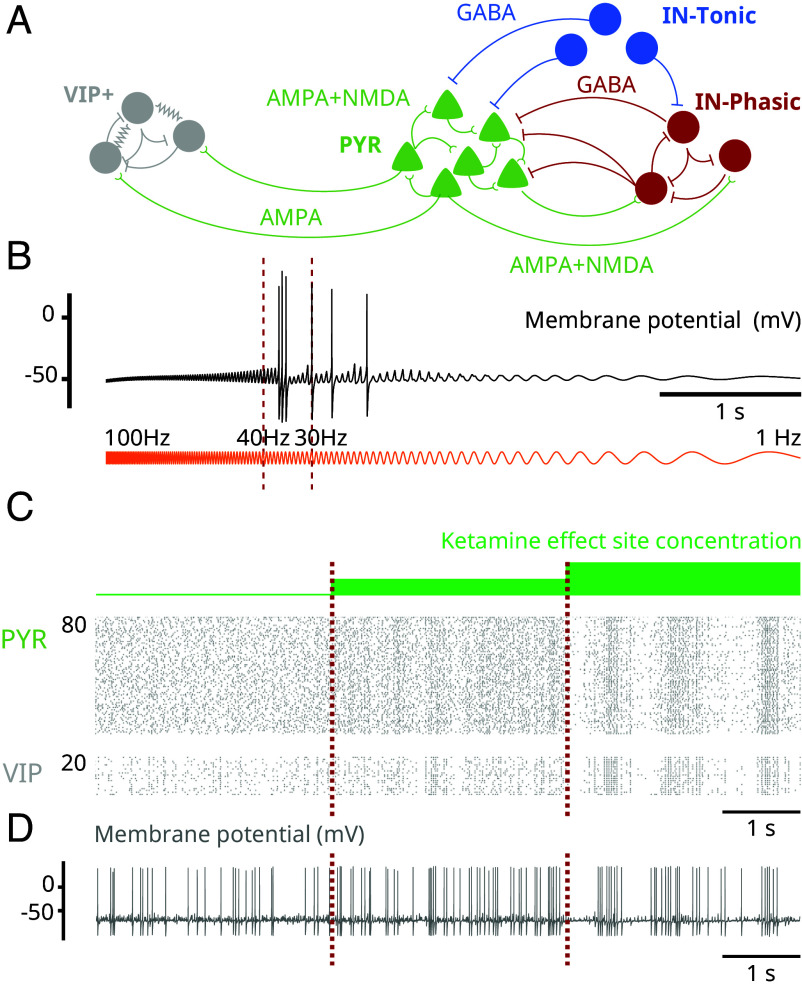
Ketamine is an N-methyl-D-aspartate (NMDA)-receptor antagonist that produces sedation, analgesia, and dissociation at low doses and profound unconsciousness with antinociception at high doses. At high and low doses, ketamine can generate gamma oscillations (>25 Hz) in the electroencephalogram (EEG). The gamma oscillations are interrupted by slow-delta oscillations (0.1 to 4 Hz) at high doses. Ketamine's primary molecular targets and its oscillatory dynamics have been characterized. However, how the actions of ketamine at the subcellular level give rise to the oscillatory dynamics observed at the network level remains unknown. By developing a biophysical model of cortical circuits, we demonstrate how NMDA-receptor antagonism by ketamine can produce the oscillatory dynamics observed in human EEG recordings and nonhuman primate local field potential recordings. We have identified how impaired NMDA-receptor kinetics can cause disinhibition in neuronal circuits and how a disinhibited interaction between NMDA-receptor-mediated excitation and GABA-receptor-mediated inhibition can produce gamma oscillations at high and low doses, and slow-delta oscillations at high doses. Our work uncovers general mechanisms for generating oscillatory brain dynamics that differs from ones previously reported and provides important insights into ketamine's mechanisms of action as an anesthetic and as a therapy for treatment-resistant depression.

Keywords: NMDA-receptor antagonism; antidepressant effect; biophysical mechanisms; gamma oscillations; slow-delta oscillations.


Conflict of interest statement

Competing interests statement:E.N.B. holds patents on anesthetic state monitoring and control. E.N.B. holds founding interest in PASCALL, a start-up developing physiological monitoring systems; receives royalties from intellectual property through Massachusetts General Hospital licensed to Masimo. The interests of E.N.B. were reviewed and are managed by Massachusetts General Hospital and Mass General Brigham in accordance with their conflict of interest policies.

Figures

Fig. 1.
Fig. 1.
Ketamine produces gamma oscillations and up/down-states in humans and nonhuman primates. (Experimental data). (A) (Top) Spectrogram of frontal EEG of a volunteer subject administered a bolus of ketamine. SoI (red) denotes the start of infusion. LoR (orange) denotes the loss of response. (Bottom) Corresponding raw EEG. The red and orange lines denote the SoI and LoR, respectively. (B) Spectrogram of LFP recording from a nonhuman primate administered a ketamine bolus. SoI (red) denotes the start of infusion. (C) Close-up at the time-point indicated by the arrow in (B). (Top) Raster plot of spiking activity before ketamine administration. (Middle) LFP trace before ketamine administration. (Bottom) Spectrogram of LFP before ketamine administration. (D) Close-up at the time-point indicated by the arrow in (B). Same as (C) but after administering a bolus of ketamine.
Fig. 2.
Fig. 2.
NMDAR antagonism in a biophysical model reproduces the oscillatory dynamics under ketamine (Model simulations). (A) Schematic of the biophysical network model. (B) Schematic of the 10-state model of NMDAR kinetics. NMDAR antagonism under ketamine was modeled as a decrease in the probability of NMDAR channels unblocking (red arrow). (C) (Top) Spectrogram of an EEG/LFP generated from a simulation of the biophysical model, under different effect site concentrations of ketamine. (Middle) Corresponding EEG/LFP trace. (Bottom) Corresponding raster plot of spiking activity.
Fig. 3.
Fig. 3.
NMDAR antagonism can shut down activity of neurons with subthreshold background excitation (Model simulations). (A) Schematic showing parts of the 10-state model of NMDAR kinetics. The red arrow represents the probability of unblocking, which was decreased. (B) (Top) Raster plot of IN-Tonic activity at different ketamine effect site concentrations. Only 10 representative examples were selected. (Bottom) Membrane potential of a representative example IN-Tonic neurons. (C) (Top) Representative example from a neuron showing the probability of an NMDAR channel being conductive (blue) and being open (blocked or unblocked; green) at different ketamine effect site concentrations. (Middle) Scaled trace (blue) showing the probability of being conductive at different ketamine effect site concentrations. The slow ramp-up of probability indicates a slow-unblock (upper arrow) and a fast sudden-jump in probability indicates a fast-unblock (lower arrow). (Bottom) Representative example from the same neuron at top showing the probability of the NMDAR channel being closed and blocked with 2 bound glutamate (brown).
Fig. 4.
Fig. 4.
NMDAR antagonism generates gamma oscillations through an NMDAR-dependent mechanism (Model simulations). (A) (Left) Schematic of the network in Fig. 2. (Right) Closed-up at the raster plot of spiking activity from the simulation in Fig. 2 at different ketamine effect site concentrations. (B) Probability for an NMDAR channel of an isolated neuron to be conductive (blue) and open (blocked or unblocked; green) following an initial puff of glutamate (gray), under different levels of background excitation (Iapp). (C) Membrane potentials (gray) corresponding to the conditions in (B). (D) (Left) Schematic of the network where GABA input to PYR neurons was removed. (Right) Raster plots of spiking activity for IN-Phasic and PYR neurons under the conditions in (Left), at different ketamine effect site concentrations. (E) (Left) Schematic of the network where AMPA receptors are removed from the network (while NMDA receptors are kept) and background current (Iapp) is adjusted to rectify the loss of excitation. (Right) Raster plots of spiking activity for IN-Phasic and PYR neurons under the conditions in (Left), at different ketamine effect site concentrations.
Fig. 5.
Fig. 5.
NMDAR antagonism generates up- and down-states through an NMDAR-dependent mechanism (Model simulations). (A) (Left) Schematic of the network in Fig. 2. (Right) Close-up at the raster plot of spiking activity for PYR and IN-Phasic neurons from the simulation in Fig. 2, at high ketamine effect site concentration. (B) (Top) Probability for an NMDAR channel of an isolated neuron to be conductive (blue) and open (blocked or unblocked; green) following a puff of glutamate (gray), under high background excitation (disinhibited) at the baseline rate of unblocking for NMDAR channels. (Bottom) Same as (Top) but using the high-dose rate of unblocking. (C) (Top and Bottom) Membrane potentials (gray) corresponding to the conditions in (B). (D) (Top) Raster plot of spiking activity from Fig. 2. (Middle) Filtered excitatory (green) and inhibitory (red) currents input into PYR neurons. (Bottom) Gamma oscillations in the EEG/LFP obtained through band-pass filtering. (E) (Left) Schematic of the network where GABA input to PYR neurons was removed (Right) Raster plots of spiking activity for IN-Phasic and PYR neurons under the conditions in (Left), at high ketamine effect site concentration. (F) (Left) Schematic of the network where AMPA receptors are removed (while NMDA receptors are kept) and background current (Iapp) is adjusted to rectify the loss of excitation. (Right) Raster plots of spiking activity for IN-Phasic and PYR neurons under the conditions in (Left), at high ketamine effect site concentration.
Fig. 6.
Fig. 6.
NMDAR antagonism can engage VIP+ neurons through gamma resonance (Model simulations). (A) Schematic of the augmented network including VIP+ neurons. (B) Membrane potential (black) of a representative VIP+ neuron in the network, where each receives a ZAP current (orange) as input instead of AMPA input from PYR neurons. The ZAP current sweeps from 100 to 1 Hz and has constant amplitude throughout. (C) Raster plots showing PYR and VIP+ neuron spiking activity at different effect site concentrations. (D) Membrane potential of a representative VIP+ neuron at different effect site concentrations.

Update of

References

    1. Akeju O., et al. , Electroencephalogram signatures of ketamine anesthesia-induced unconsciousness. Clin. Neurophysiol. 127, 2414–2422 (2016). - PMC - PubMed
    1. Purdon P. L., Sampson A., Pavone K. J., Brown E. N., Clinical electroencephalography for anesthesiologists: Part I: Background and basic signatures. Anesthesiology 123, 937–960 (2015). - PMC - PubMed
    1. Vesuna S., et al. , Deep posteromedial cortical rhythm in dissociation. Nature 586, 87–94 (2020). - PMC - PubMed
    1. Moghaddam B., Ketamine (MIT Press, 2021).
    1. Zanos P., Gould T., Mechanisms of ketamine action as an antidepressant. Mol. Psychiatry 23, 801–811 (2018). - PMC - PubMed

MeSH terms

LinkOut - more resources