. 2024 May 28;121(22):e2314166121.
doi: 10.1073/pnas.2314166121. Epub 2024 May 20.

Inhibition of mRNA nuclear export promotes SARS-CoV-2 pathogenesis

Affiliations

Inhibition of mRNA nuclear export promotes SARS-CoV-2 pathogenesis

Menghan Mei et al. Proc Natl Acad Sci U S A. .

Abstract

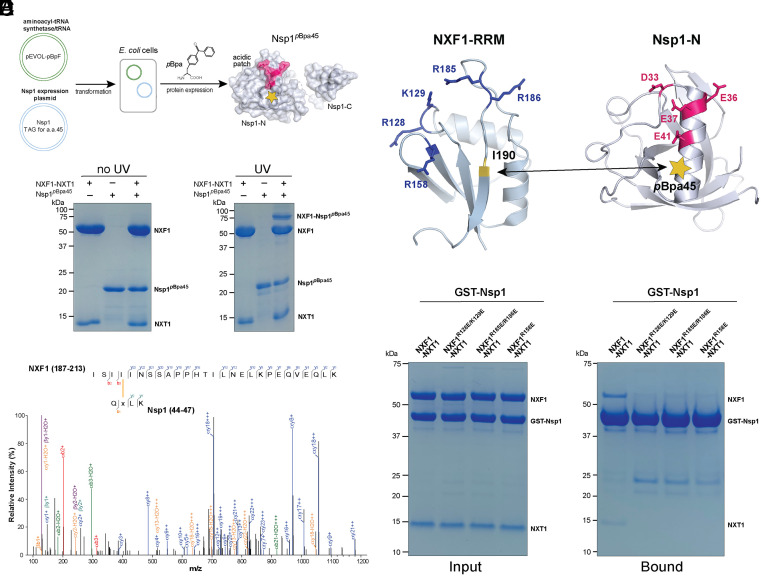
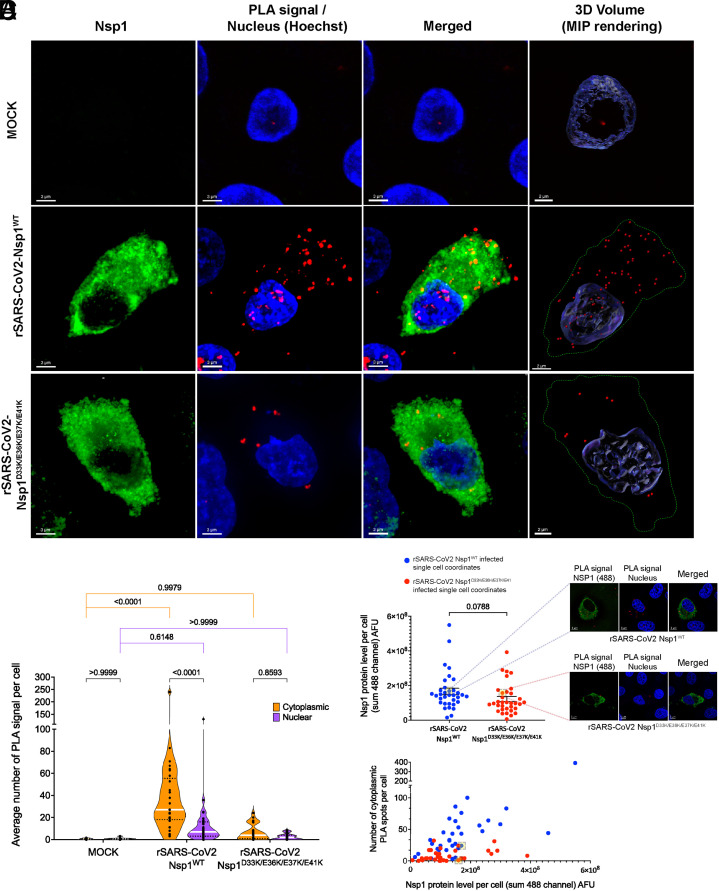
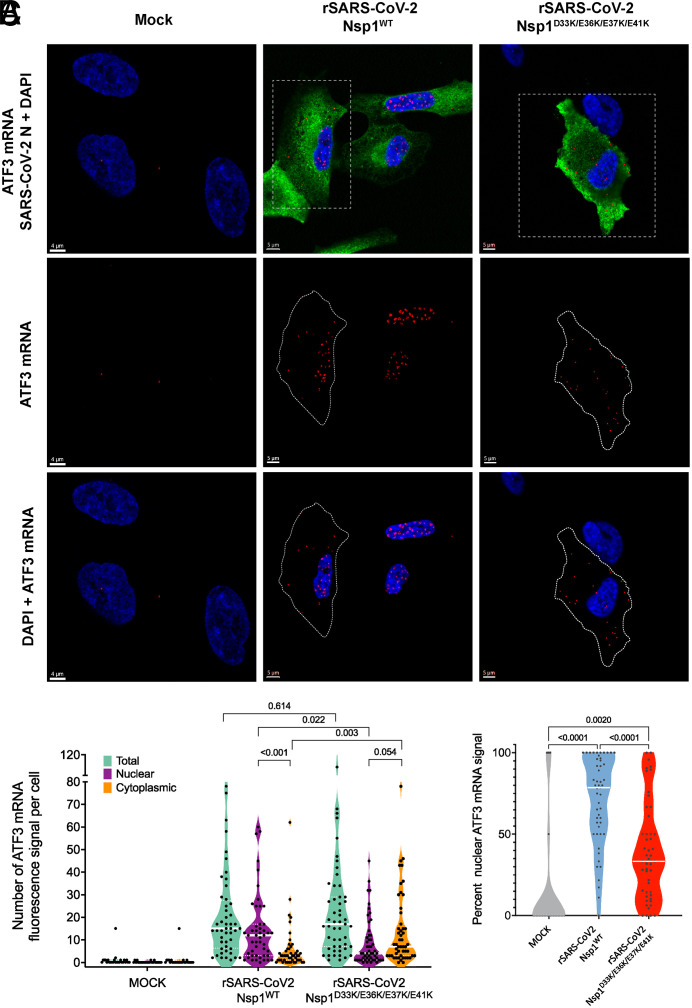
The nonstructural protein 1 (Nsp1) of SARS-CoV-2 (Severe Acute Respiratory Syndrome Coronavirus 2) is a virulence factor that targets multiple cellular pathways to inhibit host gene expression and antiviral response. However, the underlying mechanisms of the various Nsp1-mediated functions and their contributions to SARS-CoV-2 virulence remain unclear. Among the targets of Nsp1 is the mRNA (messenger ribonucleic acid) export receptor NXF1-NXT1, which mediates nuclear export of mRNAs from the nucleus to the cytoplasm. Based on Nsp1 crystal structure, we generated mutants on Nsp1 surfaces and identified an acidic N-terminal patch that is critical for interaction with NXF1-NXT1. Photoactivatable Nsp1 probe reveals the RNA Recognition Motif (RRM) domain of NXF1 as an Nsp1 N-terminal binding site. By mutating the Nsp1 N-terminal acidic patch, we identified a separation-of-function mutant of Nsp1 that retains its translation inhibitory function but substantially loses its interaction with NXF1 and reverts Nsp1-mediated mRNA export inhibition. We then generated a recombinant (r)SARS-CoV-2 mutant on the Nsp1 N-terminal acidic patch and found that this surface is key to promote NXF1 binding and inhibition of host mRNA nuclear export, viral replication, and pathogenicity in vivo. Thus, these findings provide a mechanistic understanding of Nsp1-mediated mRNA export inhibition and establish the importance of this pathway in the virulence of SARS-CoV-2.

Keywords: NXF1; Nsp1; SARS-CoV-2; mRNA export; nuclear transport.


Conflict of interest statement

Competing interests statement:A.G.-S. has consulting agreements for the following companies involving cash and/or stock: Castlevax, Amovir, Vivaldi Biosciences, Contrafect, 7Hills Pharma, Avimex, Pagoda, Accurius, Esperovax, Farmak, Applied Biological Laboratories, Pharmamar, CureLab Oncology, CureLab Veterinary, Synairgen, Paratus, and Pfizer, outside of the reported work. A.G.-S. has been an invited speaker in meeting events organized by Seqirus, Janssen, Abbott, and Astrazeneca. A.G.-S. is inventor on patents and patent applications on the use of antivirals and vaccines for the treatment and prevention of virus infections and cancer, owned by the Icahn School of Medicine at Mount Sinai, New York.

Figures

Fig. 1.
Fig. 1.
An acidic patch on the Nsp1 N-terminal domain plays a key role in NXF1-NXT1 binding. (A) Schematic representation of SARS-CoV-2 Nsp1 and human NXF1-NXT1. (B) Both the N-terminal and C-terminal domains of Nsp1 are involved in NXF1-NXT1 binding. In vitro GST pull-down assays were performed with purified GST-tagged Nsp1 variants and NXF1-NXT1. (C) Mutations of an acidic patch on Nsp1-N significantly reduced NXF1-NXT1 binding. (D) Cartoon representation of Nsp1-N (PDB ID 7K7P) highlighting the acidic patch on Nsp1-N.
Fig. 2.
Fig. 2.
Photoactivatable Nsp1 probe identifies the RRM domain of NXF1 as an Nsp1-N binding site. (A) Schematics for incorporation of the photoactivatable nonnatural amino acid pBpa into Nsp1. (B) UV treatment of Nsp1pBPa45 in the presence of NXF1-NXT1 generated a new band consistent with the size of crosslinked Nsp1pBPa45-NXF1 complex on SDS-PAGE gel. (C) Tandem mass spectrum for a peptide crosslinked to I190 of the NXF1-RRM domain. (D) Cartoon representation of NXF1-RRM and Nsp1-N. Positively charged residues (blue) are enriched on the surface of NXF1-RRM forming a basic patch. The yellow star denotes the position of the incorporated pBpa at residue 45. The crosslinking site between Nsp1pBPa45 and NXF1-NXT1 is labeled. (E) Mutations of the basic patch residues on NXF1-RRM reduced Nsp1 interaction. In vitro GST pull-down assays were performed with GST-tagged Nsp1 and NXF1-NXT1 variants.
Fig. 3.
Fig. 3.
Nsp1 N-terminal mutant D33K/E36K/E37K/E41K can no longer inhibit nuclear export of cellular poly(A) RNA. (A) Vero cells were non-transfected or transfected with wild-type3xFLAGNsp1. Nsp1 expression was detected with antibody against the 3xFlag peptide (green) and the intracellular distribution of poly(A) RNA was detected by RNA-FISH using oligo-d(T) probes (red). The same cells were also stained with Hoechst 33258 to visualize nuclei (blue). (Scale bar: 10 µm). Images in the second row correspond to a high magnification of the area surrounded by dotted lines. (Scale bar: 3 µm). (B) Vero cells were non-transfected or transfected with mutant 3xFLAGNsp1D33K/E36K/E37K/E41K. Cells were processed as in (A). (Scale bar: 10 µm.) Second row images correspond to a high magnification of the area surrounded by dotted lines. (Scale bar: 3 µm). Scatter plot representations of absolute fluorescence intensity (arbitrary fluorescence units, AFU) of poly(A) RNA in whole cell (total) (C), nucleus (D), and cytoplasm (E) are shown. Each dot represents a cell. The dashed lines represent quartiles, and the white line represents median value. (F and G) Relative fluorescence intensity of whole cell (total) cellular poly(A) RNA was quantified in individual cells (F) or nuclear to cytoplasmic ratios (N/C) of absolute poly(A) RNA signal (G). Data represent three independent experiments. Control, n = 54 cells; Nsp1-transfected cells, n = 60 cells; Nsp1D33K/E36K/E37K/E41K transfected cells n = 53 cells. Image quantification shows the fluorescence intensity of poly(A) RNA from rendered images. Statistical analysis was performed using one‐way ANOVA with a Tukey post test and P values are depicted in the figure. (H) Scatter plot representations of single cell absolute 488 fluorescence intensity of Nsp1WT or Nsp1D33K/E36K/E37K/E41K expressed in Vero cells with an overall median 488 fluorescence intensity of 2.40 × 10⁹ and 4.66 × 10⁹, respectively. The black lines represent SEM. Statistical analysis was performed using the two-tailed t test and P value is depicted in the figure. (I) Scatter plot showing two dimensions of single infected cells N/C ratios of poly(A) RNA signal versus Nsp1 protein levels (AFU). Clusters of Nsp1WT or Nsp1D33K/E36K/E37K/E41K transfected cells are circled by red or blue dashed lines, respectively. A cell (red) expressing low level of Nsp1WT (2.22 × 10⁹ AFU) and high N/C ratio of poly(A) RNA (N/C = 7.83) is compared to another cell (blue) expressing high levels of Nsp1D33K/E36K/E37K/E41K (14.4 × 10⁹ AFU) and low N/C ratio of poly(A) RNA (N/C = 1.12).
Fig. 4.
Fig. 4.
SARS-CoV-2 Nsp1D33K/E36K/E37K/E41K maintains the ability to inhibit translation. (A) HEK293T cells were transfected with pCl-neo vector or the indicated pCl-neo SARS-CoV-2 Nsp1 expressing plasmids. Firefly luciferase (Fluc) mRNA was transfected 24 h after DNA transfection. Cells were lysed 10 h after mRNA transfection and luciferase activity was measured. Normalized Nsp1 wildtype or mutant luciferase values were compared to empty vector using a one-way ANOVA with multiple comparisons using Tukey’s correction; P values are shown. Cell lysates from the translation assay above were analyzed by western blot to detect Nsp1 (IB: Flag). Tubulin was used as loading control. (B) Cell-free in vitro translation assay in rabbit reticulocytes was performed with a capped Fluc reporter mRNA in the presence of GST, Nsp1WT, or Nsp1D33K/E36K/E37K/E41K proteins (1 μM). Control reactions were performed in the absence of Nsp1 (Ctrl) with and without capped Fluc mRNA, as well as in the presence of GST (1 μM). To determine statistical significance, one-way ANOVA with multiple comparisons using Dunnett’s correction was performed; p-values are shown. Coomassie-stained SDS-PAGE of GST, Nsp1WT, and Nsp1D33K/E36K/E37K/E41K proteins at equal molar amount. (C) Nascent protein synthesis was monitored using Click-iT HPG Alexa 594 in A549 cells transfected with plasmids encoding Nsp1WT, Nsp1D33K/E36K/E37K/E41K, or Nsp1K164A/H165A. Cells were pulse-labeled with 0.5 mM HPG for 30 min and chased for 30 min followed by Click-iT™ HPG Alexa Fluor™ 594 protein synthesis assay. Nsp1 expression was detected with antibody against the 3xFlag peptide (green) and Hoechst 33258 was used to visualize nuclei (blue). Transfected cells are marked by dotted lines. Inset images in the second column are high-contrast overexposed representation of the corresponding Click-IT HPG Alexa 954 images of Nsp1WT or Nsp1D33K/E36K/E37K/E41K transfected cells to show the low levels of translation activity in these Nsp1 transfected cells. (Scale bar: 10 μm). (D) Relative fluorescence intensity of nascent cellular protein synthesis. Single-cell values are shown as open-circle. Bar graphs represent mean values ± SD. (E) Absolute fluorescence intensity (arbitrary fluorescence units, AFU) of global proteins synthesis. Each dot shows single-cell measurements. Bar graphs represent mean values ± SD. (F) Absolute cytoplasmic poly(A) RNA fluorescence intensity shown in Fig. 3F. Each dot represents single-cell quantification. Bar graphs represent mean values ± SD. Data represent three independent experiments. Control, n = 50 cells; Nsp1WT transfected cells, n = 50 cells; Nsp1D33K/E36K/E37K/E41K transfected cells, n = 50 cells; Nsp1K164A/H165A transfected cells n = 39 cells.
Fig. 5.
Fig. 5.
Nsp1-NXF1 interaction is mostly cytoplasmic in rSARS-CoV2WT infected cells and is decreased in rSARS-CoV2D33K/E36K/E37K/E41K infected cells. (A) A549-ACE2 cells were mock infected or infected with rSARS-CoV2WT or rSARS-CoV2D33K/E36K/E37K/E41K. After 12 h, cells were subjected to PLA to detect the interaction between Nsp1 and NXF1 proteins in situ. The interaction by PLA is detected by fluorescent probes (red dots; λem = 624 nm, TRITC filter). Immunofluorescence staining of Nsp1 is shown in green. Hoechst staining labels the nuclei (blue). (Scale bar: 3 μm). The panels on the Right are three-dimensional projections of chromatin merged surface with the PLA signals detecting the NXF1–Nsp1 complexes. Cell boundaries are marked by green-dotted lines. (Scale bar: 2 μm). (B) Quantification of PLA signals per cell from 34 cells. The dashed lines represent quartiles and the white line represents median value. Data are representative of three independent experiments. Mean cytoplasmic/nuclear PLA dots per cell are mock: 0.4956/0.8169; rSARS-CoV-2WT: 41.29/13.78; rSARS-CoV-2D33K/E36K/E37K/E41K: 6.655/2.466. Statistical analysis was performed using one‐way ANOVA with a Tukey post test and P values are depicted in the figure. (C) Scatter plot representations of single cell absolute 488 fluorescence intensity of Nsp1 protein levels in infected cells. The black lines represent SEM. Single infected cells expressing similar levels of Nsp1 protein (Nsp1WT= 1.68 × 10⁸ and Nsp1D33K/E36K/E37K/E41K= 1.57 × 10⁸) are shown in the yellow-filled gray brackets with dashed lines projecting on the right to depict their corresponding PLA images (24 PLA dots for rSARS-CoV-2 Nsp1WT infected cell and 1 PLA dot for rSARS-CoV-2 Nsp1D33K/E36K/E37K/E41K infected cell). Statistical analysis was performed using the two-tailed t test and P value is depicted in the figure. (D) Scatter plot shows two-dimensional analysis of individual cells—cytoplasmic PLA spots versus Nsp1 protein level—from rSARS-CoV-2 Nsp1WT or rSARS-CoV-2 Nsp1D33K/E36K/E37K/E41K infected cells. Cells in the yellow-filled gray brackets are the same cells selected in (C).
Fig. 6.
Fig. 6.
SARS-CoV-2 Nsp1D33K/E36K/E37K/E41K is unable to inhibit cellular mRNA export. A549-ACE2 cells were infected with rSARS-CoV-2 Nsp1WT or rSARS-CoV-2 Nsp1D33K/E36K/E37K/E41K at MOI 0.25 for 24 h. Cells were subjected to the ViewRNA Cell Plus Assay to detect specific cellular mRNAs, as depicted in the figure, and immunofluorescence microscopy to detect viral N protein. (A) ATF3 mRNA is detected in red, viral N protein is shown in green, and nuclei are stained in blue with DAPI. The dotted square shows a selected cell that is highlighted in the Middle and Bottom panels. Images and quantification of other mRNAs are shown in SI Appendix, Fig. S3. (B) Scatter plot representations of single cell ATF3 mRNA fluorescence signal in whole cells (total), or in the nucleus, or in the cytoplasm of mock, rSARS-CoV-2 Nsp1WT, or rSARS-CoV-2 Nsp1D33K/E36K/E37K/E41K-infected cells. Each dot represents a cell. The dashed lines represent quartiles and the white line represents median value. (C) The calculated percent nuclear ATF3 mRNA signal is presented as a scattered plot for each individual cell (mock n= 25 cells; wild-type virus n= 51 cells; mutant virus n= 51 cells). Each dot represents a cell and the median value is depicted in the white line. Statistical analysis was performed using one-way ANOVA with a Tukey post test and P values are depicted in the figure.
Fig. 7.
Fig. 7.
rSARS-CoV-2 Nsp1D33K/E36K/E37K/E41K is attenuated in A549-ACE2 cells. (A) Growth curves of rSARS-CoV-2 Nsp1WT and rSARS-CoV-2 Nsp1D33K/E36K/E37K/E41K in A549-ACE2 cells infected at an MOI of 0.1 for 12, 24, 36, and 48 hpi. Titers were quantified by plaque assay (n = 3). The dashed line indicates the limit of detection for plaque assay (50 PFU/mL). Values were log transformed and compared using multiple unpaired t tests; P values are shown. (B) A549-ACE2 cells were mock-infected or infected at an MOI of 0.1 and samples were collected at 12, 24, 36, and 48 hpi. Cell lysates were analyzed by Western blot to assess SARS-CoV-2 N and Nsp1 expression. GAPDH was used as loading control. (C) A549-ACE2 cells were mock-infected or infected with the indicated viruses at an MOI of 0.1 for 12, 24, 36, and 48 h. Cells were subjected to immunofluorescence microscopy to detect SARS-CoV-2 N protein (green). Nuclei were stained with DAPI (blue). (Scale bar: 300 μm).
Fig. 8.
Fig. 8.
rSARS-CoV-2 Nsp1D33K/E36K/E37K/E41K infected K18-hACE2 mice show less severe lung histopathology. (A) Schematic of in vivo experimental design where K18-hACE2 mice were mock-infected (n = 7 at 4 dpi and n = 4 at 7 dpi) or infected with 1 × 10⁴ PFU of rSARS-CoV-2 Nsp1WT (n = 7 at 4 dpi and n = 4 at 7 dpi) or rSARS-CoV-2 Nsp1D33K/E36K/E37K/E41K (n = 5 at 4 dpi and n = 4 at 7 dpi). (B) Weight loss curve depicting body weights for mock-infected or infected with rSARS-CoV-2 Nsp1WT or rSARS-CoV-2 Nsp1D33K/E36K/E37K/E41K for the duration of the experiment as a percentage of initial bodyweight. Weight loss data are shown as mean ± SEM. (C) Lung viral titers for mock-infected and infected animals at the indicated dpi. (D) Nasal turbinate viral titers for mock-infected and infected animals at the indicated dpi. Dashed lines in (C) and (D) indicate the limit of detection for plaque assay (50 PFU/mL). Values were log transformed and compared using two-way ANOVA with Tukey’s correction; P values are shown. (E) Representative images of lung H&E staining for all three groups of animals at the indicated dpi. All images were acquired at 200× total magnification. Mock inoculated lungs were within normal limits, while both infected lung samples displayed variable perivascular (blue hashed ovals), peribronchiolar (black hashed ovals), and interstitial mononuclear infiltrates (orange arrowheads). Endothelial hypertrophy was also observed in both infected cohorts. (Scale bars in histology slides = 100 μm).

Comment in

References

    1. Finkel Y., et al. , SARS-CoV-2 uses a multipronged strategy to impede host protein synthesis. Nature 594, 240–245 (2021). - PubMed
    1. Thoms M., et al. , Structural basis for translational shutdown and immune evasion by the Nsp1 protein of SARS-CoV-2. Science 369, 1249–1255 (2020). - PMC - PubMed
    1. Zhang K., et al. , Nsp1 protein of SARS-CoV-2 disrupts the mRNA export machinery to inhibit host gene expression. Sci. Adv. 7, eabe7386 (2021). - PMC - PubMed
    1. Vora S. M., et al. , Targeting stem-loop 1 of the SARS-CoV-2 5’ UTR to suppress viral translation and Nsp1 evasion. Proc. Natl. Acad. Sci. U. S. A. 119, e2117198119 (2022). - PMC - PubMed
    1. Yuan S., et al. , Nonstructural protein 1 of SARS-CoV-2 is a potent pathogenicity factor redirecting host protein synthesis machinery toward viral RNA. Mol. Cell 80, 1055–1066.e1056 (2020). - PMC - PubMed

MeSH terms