. 2024 Jul;631(8019):170-178.
doi: 10.1038/s41586-024-07526-6. Epub 2024 May 20.

In vitro reconstitution of epigenetic reprogramming in the human germ line

Affiliations

In vitro reconstitution of epigenetic reprogramming in the human germ line

Yusuke Murase et al. Nature. 2024 Jul.

Abstract

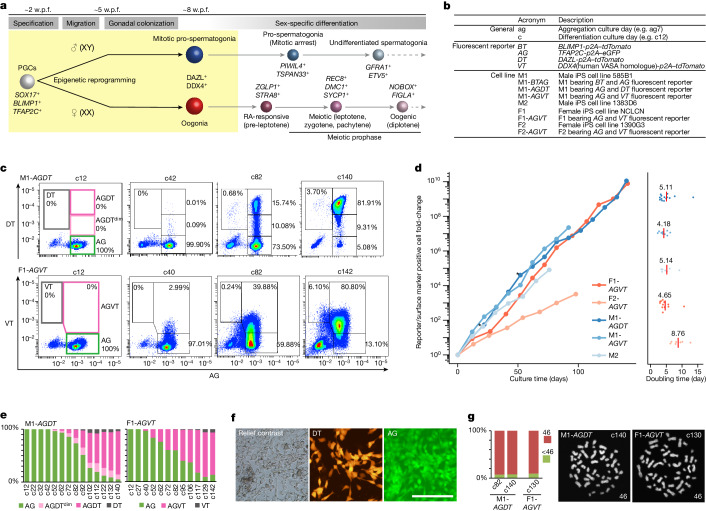
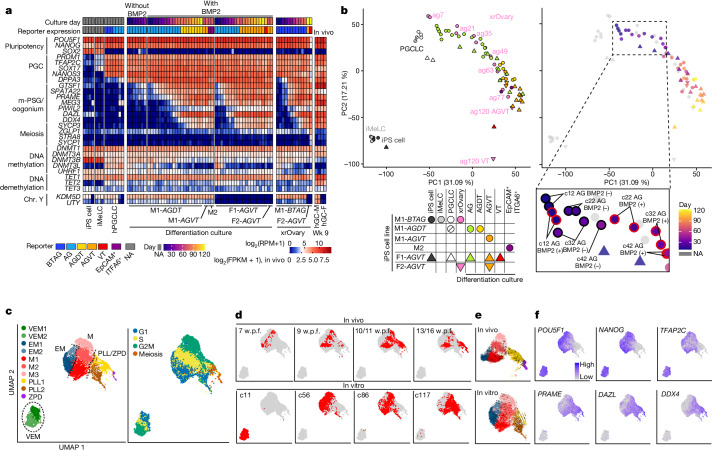
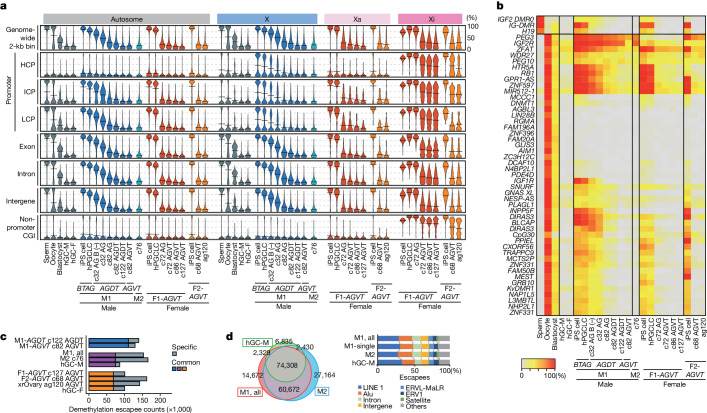
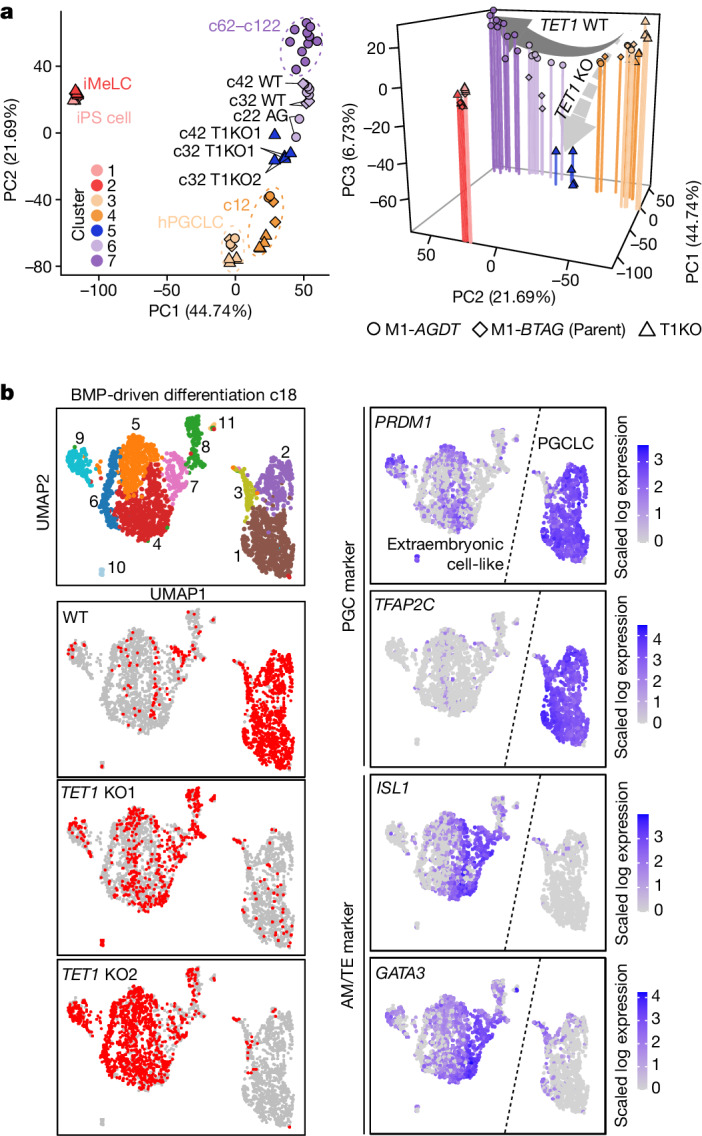
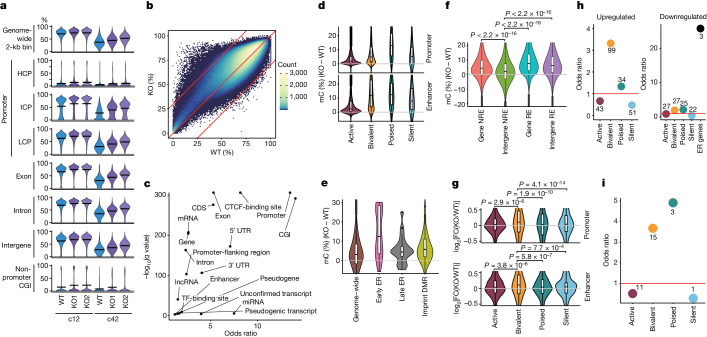
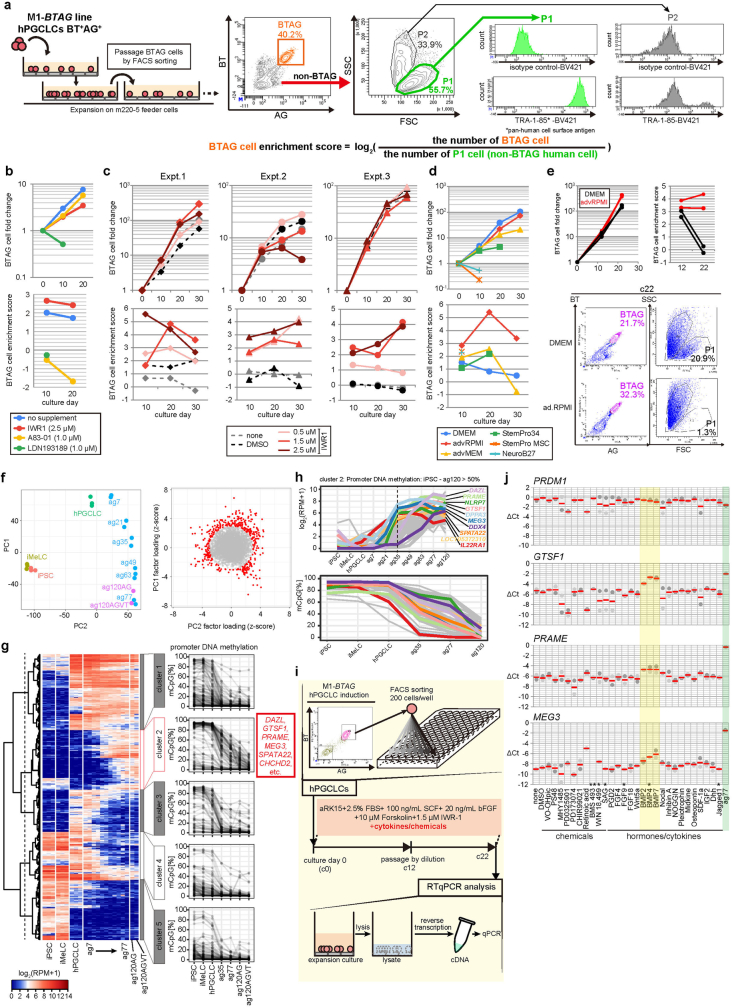
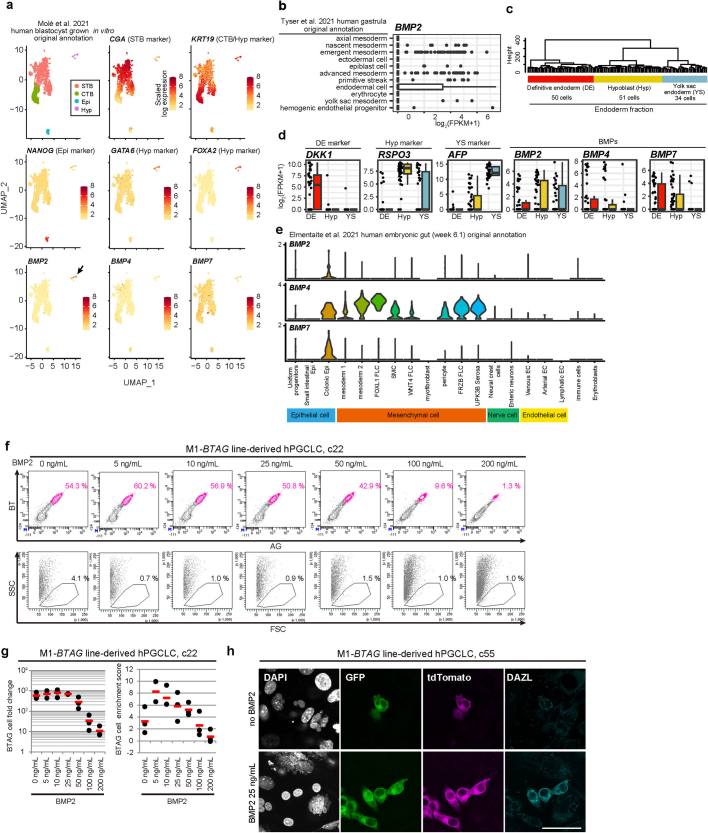
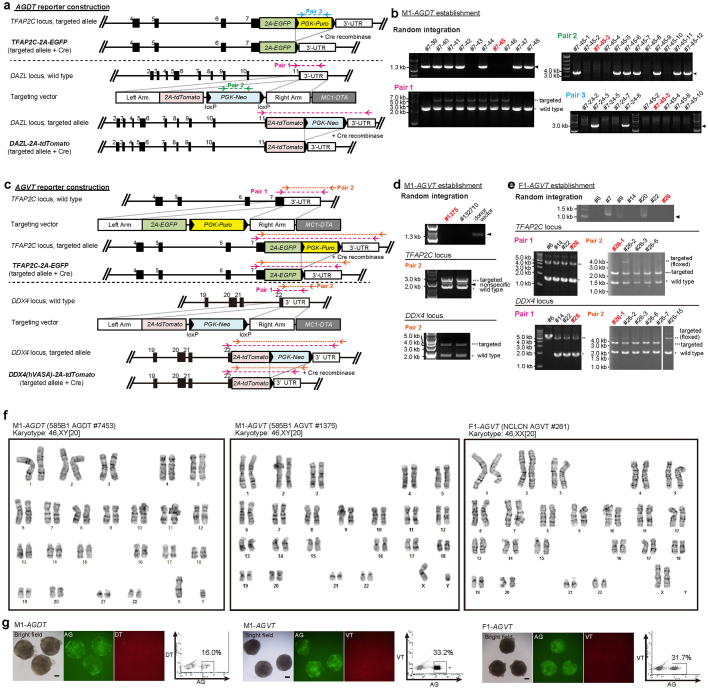
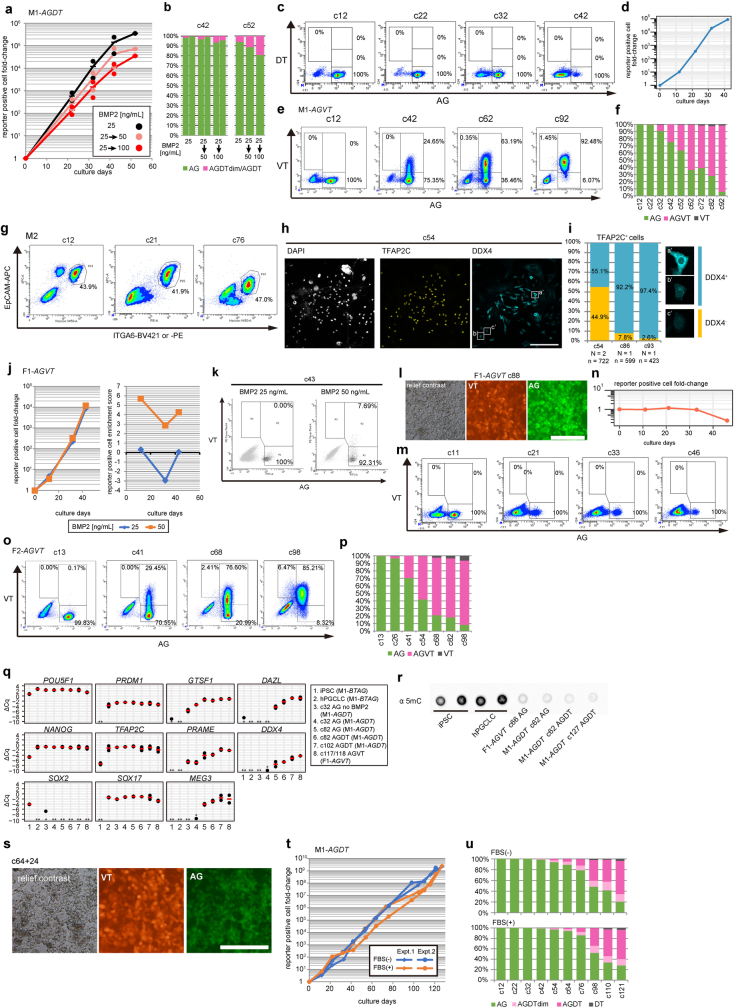
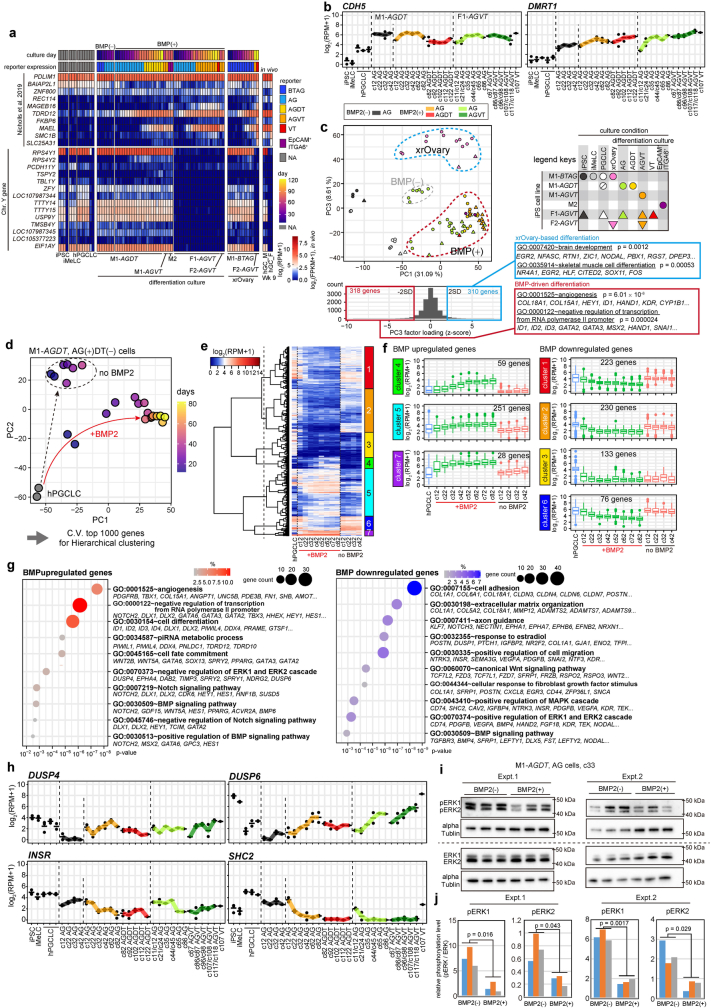
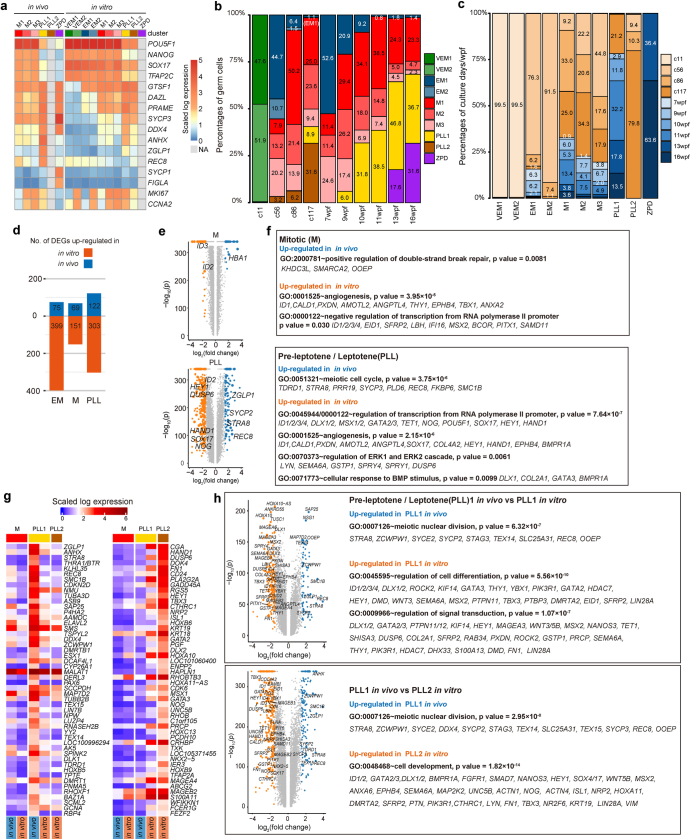
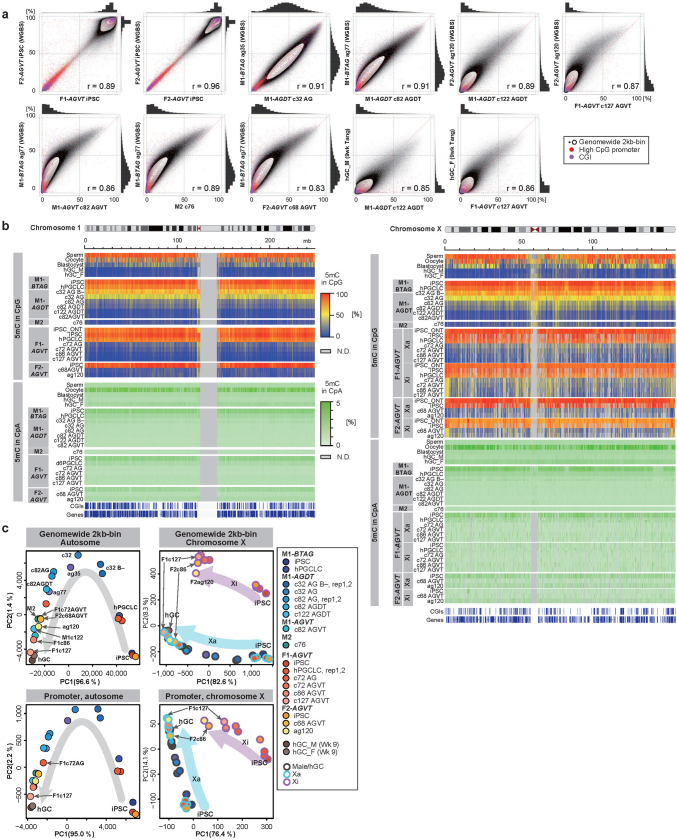
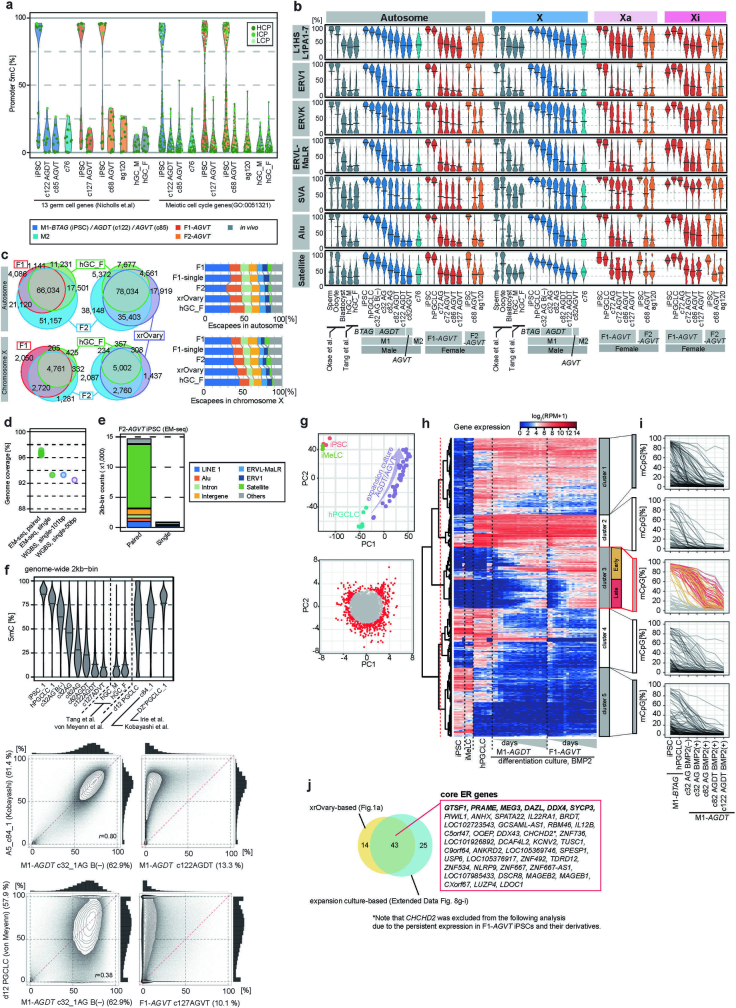
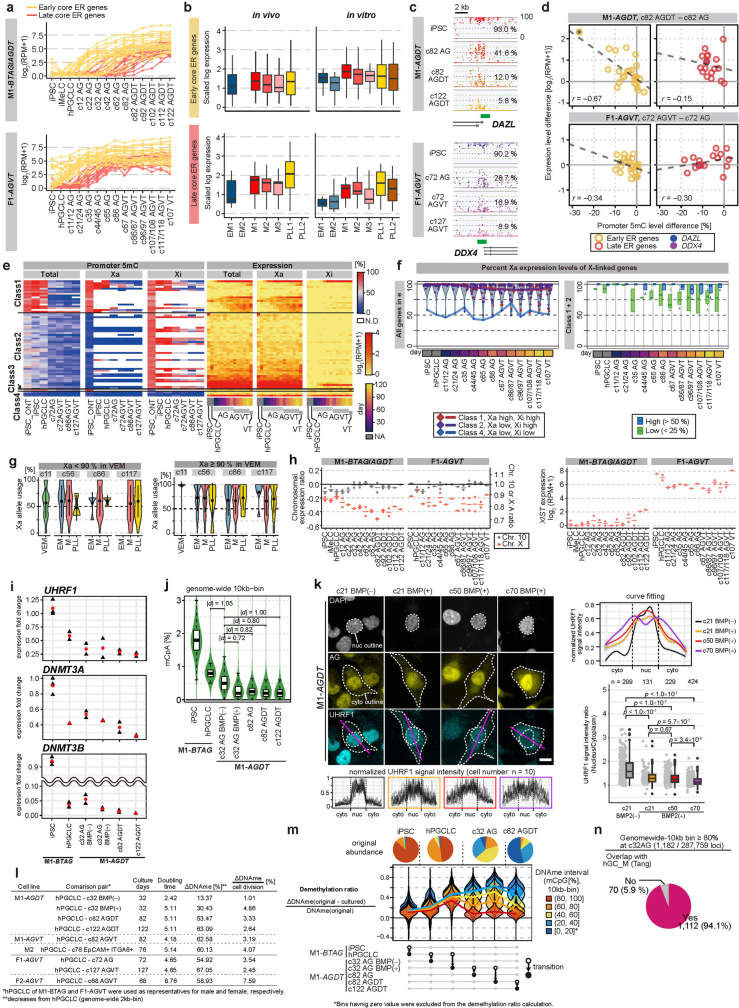
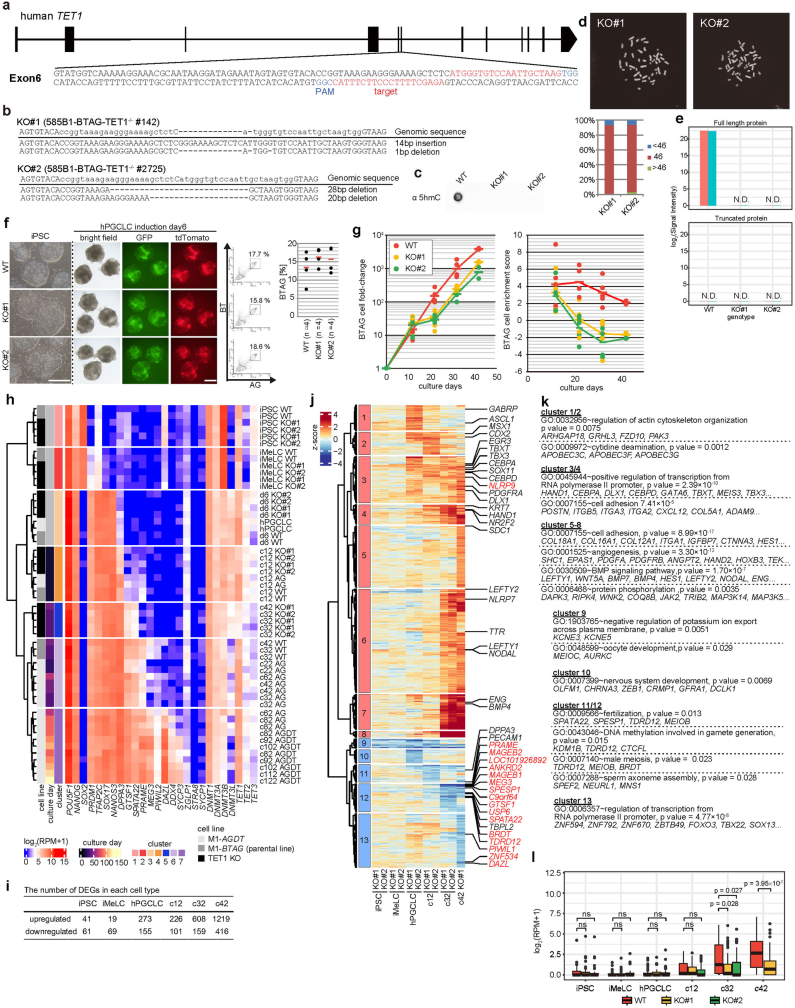
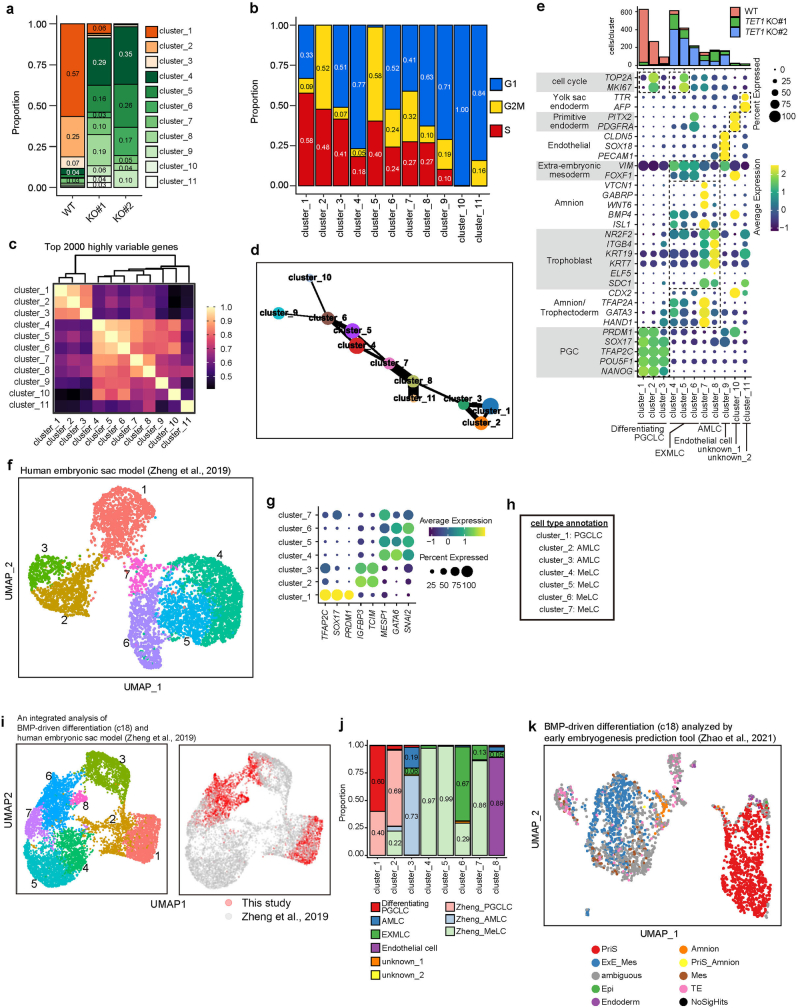
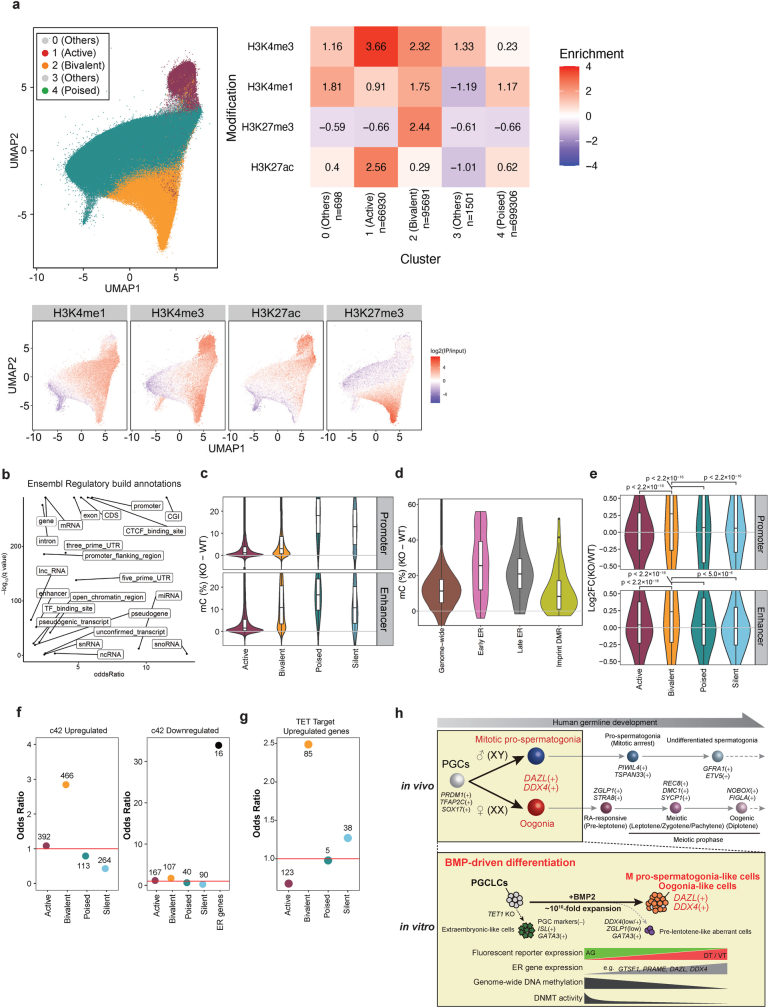
Epigenetic reprogramming resets parental epigenetic memories and differentiates primordial germ cells (PGCs) into mitotic pro-spermatogonia or oogonia. This process ensures sexually dimorphic germ cell development for totipotency1. In vitro reconstitution of epigenetic reprogramming in humans remains a fundamental challenge. Here we establish a strategy for inducing epigenetic reprogramming and differentiation of pluripotent stem-cell-derived human PGC-like cells (hPGCLCs) into mitotic pro-spermatogonia or oogonia, coupled with their extensive amplification (about >1010-fold). Bone morphogenetic protein (BMP) signalling is a key driver of these processes. BMP-driven hPGCLC differentiation involves attenuation of the MAPK (ERK) pathway and both de novo and maintenance DNA methyltransferase activities, which probably promote replication-coupled, passive DNA demethylation. hPGCLCs deficient in TET1, an active DNA demethylase abundant in human germ cells2,3, differentiate into extraembryonic cells, including amnion, with de-repression of key genes that bear bivalent promoters. These cells fail to fully activate genes vital for spermatogenesis and oogenesis, and their promoters remain methylated. Our study provides a framework for epigenetic reprogramming in humans and an important advance in human biology. Through the generation of abundant mitotic pro-spermatogonia and oogonia-like cells, our results also represent a milestone for human in vitro gametogenesis research and its potential translation into reproductive medicine.


Conflict of interest statement

M.S., Y.M. and R.Y., together with Kyoto University, have filed a provisional patent application (2023-133928) covering the propagation and differentiation of germ cells induced from human PS cells. All other authors declare no competing interests.

Figures

Fig. 1
Fig. 1. BMP signalling promotes hPGCLC differentiation.
a, Schematic of human germ cell development. Differentiation stages, key markers and stages covered by this study (yellow) are shown. b, Summary of the acronyms used in this study. c, Flow cytometric analysis of the expression of AG and DT or VT during BMP-driven M1-AGDT or F1-AGVT hPGCLC differentiation on the indicated culture days. Percentages of the cells in each gate are shown. The data represent four(M1-AGDT) and eight (F1-AGVT) biological replicates. d, Growth curve (left) and doubling time (right) of hPGCLC-derived cells induced from the indicated human iPS cell lines. The number of hPGCLC-derived cells was calculated as the sum of reporter+ cells or EpCAM+ITGA6+ cells (for M2). For the doubling time, each dot represents a doubling time for one passage interval and the red bar represents the average of all passage intervals. Asterisk indicates cells passaged by flow cytometry. Colour coding is as indicated. The data represent four (M1-AGDT), two (M1-AGVT), two (M2), eight (F1-AGVT) and two (F2-AGVT) biological replicates. e, Proportion of cells with the indicated reporter expression during BMP-driven M1-AGDT or F1-AGVT hPGCLC differentiation on the indicated culture days. The data represent four (M1-AGDT) and eight (F1-AGVT) biological replicates. f, Relief contrast and fluorescence (DT and AG) images of M1-AGDT hPGCLC-derived cells at c72. The images represent four biological replicates. Scale bar, 200 μm. g, Karyotype (left; percentage of cells with 46 or other chromosome numbers; right: chromosome spreads) of M1-AGDT and F1-AGVT hPGCLC-derived cells at the indicated culture days (one biological replicate at each time point). Source Data
Fig. 2
Fig. 2. Transcriptome dynamics during BMP-driven hPGCLC differentiation.
a, Heatmap showing the expression levels of the indicated genes in the indicated cell types (see Supplementary Table 2 for full sample information). Colour coding is as indicated. FPKM, fragments per kilobase million; NA, not applicable; RPM, reads per million. b, PCA of transcriptomes during hPGCLC induction and BMP-driven or xrOvary-based hPGCLC differentiation. The left and right panels are colour coded with reporter expression and culture days, respectively, as indicated. The dotted area in the chart on the right is magnified to clarify the difference of transcriptome progression between cultures with BMP2 (BMP2 (+)) and without BMP2 (BMP2 (−)). c, Uniform manifold approximation and projection (UMAP) and Louvain clustering of scRNA-seq data of female germ cells at 7−16 w.p.f. in vivo, and F1-AGVT hPGCLC-derived cells at c11, c56, c86 and c117 in vitro. Cell-type (left) and cell cycle (right) annotations are shown. VEM, very early mitotic; EM, early mitotic; M, mitotic; PLL, preleptotene and leptotene; ZPD, zygotene, pachytene and diplotene. df, UMAP plots as in c, with the annotation of in vivo and in vitro samples (d), with potential developmental trajectories of in vivo and in vitro cell types analysed by RNA velocity (e), and with expression levels of the indicated genes (f). Colour coding is as indicated. Source Data
Fig. 3
Fig. 3. DNA methylome reprogramming during BMP-driven hPGCLC differentiation.
a, Violin plots of the average 5mC levels on the indicated genomic loci in the indicated cell types (see Supplementary Table 2 for full sample information). Bars represent the average values. The DNA methylome data for human spermatozoa, oocytes and blastocytes are from ref. and those for human male germ cells (hGC-M) and female germ cells (hGC-F) at 9 w.p.f. are from ref. . B (–) indicates hPGCLC culture without BMP2. HCP, high CpG promoter; ICP, intermediate CpG promoter; LCP, low CpG promoter. b, Heatmap of the 5mC levels of the imprint DMRs in the indicated samples. Colour coding is as indicated. c, Escapee numbers common or specific between or in M1-AGDT c122 cells and M1-AGVT c82 cells (top), among or in the union of M1-AGDT c122 and M1-AGVT c82 cells, M2 c76 cells, and in vivo male germ cells at 9 w.p.f. (middle), and among or in F1-AGVT c127 cells, F2-AGVT c68 cells, ag120 cells and in vivo female germ cells at 9 w.p.f. (bottom). Colour coding is as indicated. d, Venn diagram showing the relationships of the DNA demethylation escapees among the indicated samples, and composition of the escapees in the indicated samples. Colour coding is as indicated. Source Data
Fig. 4
Fig. 4. TET1 protects hPGCLCs from differentiation into extraembryonic cells.
a, PCA (left: PC1 and PC2; right: PC1, PC2 and PC3) of the transcriptomes of BMP-driven wild-type (WT) cell and TET1 KO (T1KO) hPGCLC differentiation (see Supplementary Table 2 for full sample information and Extended Data Fig. 10h for cluster information). Colour coding is as indicated. b, UMAP and Louvain clustering of scRNA-seq data of wild-type and TET1 KO hPGCLC culture at c18 (left column, top), with the annotation of the genotype (left column) or with the expression levels of the indicated genes (right column). Colour code is as indicated. Source Data
Fig. 5
Fig. 5. TET1 KO cells hypermethylate regulatory elements and de-repress bivalent genes.
a, Violin plots of the average 5mC levels on the indicated genomic loci in wild-type and TET1 KO hPGCLC-derived cells at c12 and c42. Bars represent the average values. b, Scatter plot of 5mC levels across all 2-kb bins in wild-type and TET1 KO hPGCLC-derived cells at c12. The numbers of bins with higher 5mC levels (≥30%) in wild-type (n = 10,920) and TET1 KO (n = 238) hPGCLC-derived cells are indicated. For the KO lines, the average values of KO1 and KO2 were used. c, Odds ratio and q value of the enrichment of the 2-kb bins with higher 5mC levels in wild-type cells than TET1 KO cells at c12 in the Ensembl Regulatory Build annotations. dg, Violin plots for the 5mC level (%) (df) and the expression level (log2 fold change) (g) differences between wild-type and TET1 KO hPGCLC-derived cells at c12 on the indicated elements. Promoters, enhancers (non-promoter open sites) and their labels are based on the data for day 4 hPGCLCs (Extended Data Fig. 12a). Silent promoters are promoters that did not overlap with open sites; silent enhancers are enhancers categorized neither into active, bivalent or poised. In f, all open sites during hPGCLC induction were defined as regulatory elements (REs). NRE, non-RE regions. Intergenic NREs are defined as the ‘background’ genome. The upper hinges, lower hinges and middle lines indicate 75 percentiles, 25 percentiles and median values, respectively. The whiskers were drawn in length equal to the inter-quartile range multiplied by 1.5. Data beyond the upper and lower whiskers are shown as dots. Numbers of each element are as follows: d, 11,256, 5,014, 4,249 and 17,401 for active, bivalent, poised and silent promoters, respectively; 3,085, 11,654, 111,315, and 275 for active, bivalent, poised, silent enhancers, respectively; in e, 1,392,085, 37, 20 and 50 for genome-wide, early ER gene, late ER gene and imprint DMR, respectively; in f, 647,564, 770,128, 220,403 and 209,585 for genic NRE, intergenic NRE, genic RE and intergenic RE, respectively; in g, 8,562, 1,991, 695 and 2,219 for active, bivalent, poised and silent promoters, respectively; 1,682, 1,560, 6,964 and 101 for active, bivalent, poised and silent enhancers, respectively. P values calculated using two-sided Wilcoxon rank-sum test (f) or two-sided t-test adjusted by Bonferroni correction (g). h, Odds ratio of the enrichment of genes with indicated promoters and ER genes (for downregulated genes) in genes upregulated (left) or downregulated (right) in TET1 KO hPGCLC-derived cells at c12. Number of each gene class is indicated. i, Odds ratio of the c12 upregulated genes bound by TET in human ES cells in each category of promoters. The odds ratio was calculated relative to the background ratio of all genes bound by TET in each respective promoter category. Number of each gene class is indicated. Source Data
Extended Data Fig. 1
Extended Data Fig. 1. Exploration of the signaling for hPGCLC differentiation.
a, Scheme for hPGCLC expansion culture (left) and flow cytometric plot for BTAG expression of the hPGCLC culture and for forward and side scatter (FSC and SSC) of the non-BTAG cells (middle). The P1 cells in the middle panel are TRA-1-85+ (a human-specific antigen), i.e., de-differentiated hPGCLC-derived cells, whereas a majority of the P2 cells are TRA-1-85, i.e., m220 feeders (right). Accordingly, the enrichment score is defined as log2 (the number of BT+AG+ cells/the number of cells in the P1 gate) (right). hPGCLCs were cultured as in. See Fig. 1a for the summary of acronyms used in this study. bd, hPGCLC expansion and the enrichment score of the hPGCLC culture with IWR1, A83-01, and LDN193189 at culture day (c) 10 and 20 (b), with different doses of IWR1 at c10, 20, and 30 (c), and with different basal media (d). The passages were performed using flow cytometry. The color coding is as indicated. hPGCLCs were cultured as in with or without indicated chemicals. 1 biological replicate for (b) and (d), and 3 biological replicates for (c). e, hPGCLC expansion and the enrichment score of the hPGCLC culture with IWR1 (1.5 μm) in DMEM or advanced RPMI at c12 and 22 (top), and FACS plots for BTAG expression and FSC/SSC of the non-BTAG cells of the hPGCLC culture with IWR1 (1.5 μm) in DMEM or advanced RPMI at c22 (bottom). The passages were performed with dilution. The color coding is as indicated. Note that there were nearly no de-differentiated cells in the P1 gate in the culture with advanced RPMI. The data show (top)/represent (bottom) 2 biological replicates. f, Principal component analysis (PCA) of transcriptomes of key cell types during hPGCLC induction and hPGCLC differentiation in xrOvaries (top) and the identification of genes making significant contributions [radius of standard deviations (SDs) ≥ 3] to scaled PC1 and PC2 loadings (bottom). Genes expressed in at least one sample [log2(RPM + 1) ≥ 4] were used for PCA. g, (left) Unsupervised hierarchical clustering (UHC) of the genes selected in (f) based on their expression dynamics, and (right) promoter methylation dynamics of the genes in the five clusters in (left) during hPGCLC induction and hPGCLC differentiation in xrOvaries. Among the cluster 2 genes, those showing promoter 5mC-level reduction from human iPS cells (hiPSCs) to oogonia-like cells by ≥ 50% are defined as epigenetic reprogramming-activated genes (ER genes). h, Expression (top) and promoter methylation (bottom) dynamics of epigenetic reprogramming-activated genes (ER genes) during hPGCLC differentiation in xrOvaries. Top eight ER genes in the expression level at ag35, and DAZL and DDX4 are annotated. i, Scheme for the screening of cytokines/chemicals that induce ER gene up-regulation. j, Expression of PRDM1, GTSF1, PRAME, and MEG3 measured by qRT-PCR at culture day (c) 22 with the indicated cytokines/chemicals. For each gene, ∆Ct from the average Ct values of two housekeeping genes, RPLP0 and PPIA (set as 0), were calculated and plotted for 2 biological replicates. Mean values are shown as a red bar. *, **: Not detected or ∆Ct <−10 in one or two replicates, respectively. ag77: expression values in hPGCLC-derived cell at ag77 in xrOvaries. Source Data
Extended Data Fig. 2
Extended Data Fig. 2. BMP signaling and hPGCLC differentiation.
a, Expression of key lineage markers and BMP ligands in single cells of cultured human embryos (~E11) visualized by Uniform manifold approximation and projection (UMAP) and Louvain clustering. Color coding is as indicated. STB: syncytiotrophoblast; CTB: cytotrophoblast; Epi: epiblast; Hyp: hypoblast. b, Expression of BMP2 in various cell types in a gastrulating human embryo at ~E16. c, d, Unsupervised hierarchical clustering (UHC) (c) and cell-type annotation (c, d) based on key marker expression of endoderm cells in a gastrulating human embryo at ~E16 in (b) and expression of BMP ligands in each cell type (d). Numbers of the cells in each cluster are: n = 50 for DE; n = 51 for Hyp; n = 34 for YS. In (b, d), the upper hinges, lower hinges, and middle lines indicate 75 percentiles, 25 percentiles, and median values, respectively. The whiskers are drawn in length equal to the inter-quartile range (IQR) multiplied by 1.5. Data beyond the upper/lower whiskers are shown as dots. e, Expression of BMP ligands in cells composing human embryonic gut at week 6.1. Note that BMP ligands are expressed at a high level in colonic (i.e., hindgut) epithelium and mucosal mesoderm. FLC: fibroblasts; SMC: smooth muscle cells. f, g, Representative FACS plots for BTAG expression (f, top) and for FSC/SSC fluorescence of the BTAG cells (f, bottom), and hPGCLC fold-change (g, left) and the enrichment scores (g, right) of the hPGCLC culture with various concentrations of BMP2 with IWR1 (1.5 μM) in advanced RPMI at c22. The data represent (f)/show (g) 2 (BMP2 5 ng/mL) and 3 (BMP2 0, 10−200 ng/mL) biological replicates. The passages were performed with dilution. Note that there were nearly no de-differentiated cells in the P1 gate under all conditions. h, Immunofluorescence (IF) analysis of the expression of GFP (TFAP2C-EGFP: AG), tdTomato (BLIMP1-tdTomato: BT), and DAZL in hPGCLC-derived cells cultured without (top) or with (bottom) BMP2 (25 ng/ml) at c55. ~19% (5/26) of BT+AG+ cells were DAZL+ in the culture with BMP2, whereas no DAZL+ cells were found in the culture without BMP2 (1 biological replicate). Bar, 50 μm. Source Data
Extended Data Fig. 3
Extended Data Fig. 3. Generation of fluorescent reporters for hPGCLC differentiation.
a, (top) Schematic illustrations of the human TFAP2C locus with knock-in of the 2A-EGFP and PGK-Puro cassette and the same locus with the excision of PGK-Puro by Cre-recombinase. (bottom) Schematic illustrations of the human DAZL locus, the DAZL targeting vector for knocking in the 2A-tdTomato and PGK-Neo cassette, the knocked-in locus, and the knocked-in locus with the excision of PGK-Neo by Cre-recombinase. Positions of the primer pairs for the screening by PCR of the genotypes are shown. Black boxes indicate the exons. b, Screening by PCR of the targeted alleles for DAZL-2A-tdTomato (DT) and TFAP2C-2A-EGFP (AG), and of random integration of the targeting vectors. Targeted: bands for the targeted allele; wild-type: bands for the wild-type allele; arrowheads: random integration of the targeting vectors. The 585B1-AGDT #7453 line (M1-AGDT) was selected for subsequent experiments. c, (top) Schematic illustrations of the human TFAP2C locus, the TFAP2C-targeting vector for knocking in the 2A-EGFP and PGK-Puro cassette, the knocked-in locus, and the knocked-in locus with the excision of PGK-Puro by Cre-recombinase. (bottom) Schematic illustrations of the human DDX4 (human VASA homolog) locus, the DDX4 targeting vector for knocking in the 2A-tdTomato and PGK-Neo cassette, the knocked-in locus, and the knocked-in locus with the excision of PGK-Puro by Cre-recombinase. Positions of the primer pairs for the screening by PCR of the genotypes are shown. Black boxes indicate the exons. d, e, Screening by PCR of the targeted alleles for TFAP2C-2A-EGFP (AG) and DDX4 (human VASA homolog)-2A-tdTomato (VT), and of random integration of the targeting vectors. Targeted: bands for the targeted allele; wild-type: bands for the wild-type allele; arrowheads: random integration of the targeting vectors. The 585B1-AGVT #1375 line (M1-AGVT) (d) and the NCLCN-AGVT #26-1 line (F1-AGVT) (e) were selected for subsequent experiments. f, Representative result for the G-band analysis of M1-AGDT, M1-AGVT, and F1-AGVT bearing normal karyotypes (46, XY or 46, XX). For each line, 20 cells in 1 biological replicate were analyzed, and all showed normal karyotypes. g, Bright-field and fluorescence [AG and DT or VT] images and flow cytometric plots for AGDT or AGVT expression of the iMeLC aggregates induced for hPGCLCs for 6 days from the M1-AGDT (left), M1-AGVT (middle), and F1-AGVT (right) lines. Bar, 200 μm. The images represent 4 (M1-AGDT), 2 (M1-AGVT), and 8 (F1-AGVT) biological replicates.
Extended Data Fig. 4
Extended Data Fig. 4. BMP signaling promotes hPGCLC differentiation.
a, b, Growth curve (a) and proportion of cells with the indicated fluorescence-marker expression at c42 and c52 (b) during BMP-driven M1-AGDT hPGCLC differentiation with varying concentrations of BMP2 as indicated (2 biological replicates). c, d, Flow cytometric plots for AGDT expression at the indicated culture days (c) and growth curve (d) of M1-AGDT hPGCLC-derived cells cultured without BMP2 (2 biological replicates). e, f, Flow cytometric plots for AGVT expression (e) and proportion of cells with the indicated fluorescence-marker expression (f) at the indicated culture days during BMP-driven M1-AGVT hPGCLC differentiation (2 biological replicates). gi, Flow cytometric plots for EpCAM and ITGA6 expression (g), IF analysis of TFAP2C and DDX4 expression (h), and proportion of DDX4+ cells (i) at the indicated culture days during BMP-driven M2 hPGCLC differentiation (2 biological replicates). In (i), the numbers of experiments (N) and of cells analyzed (n), and typical images for the positivity of DDX4 staining are shown. Bar, 200 μm. j, k, Growth curve and enrichment scores (j) and flow cytometric plots for AGVT expression at c43 (k) during BMP-driven F1-AGVT hPGCLC differentiation with 25 ng/ml or 50 ng/ml of BMP2 (1 biological replicate). l, Relief contrast and fluorescence (VT and AG) images of F1-AGVT hPGCLC-derived cells at c88 (8 biological replicates). Bar, 200 μm. m, n, Flow cytometric plots for AGVT expression at the indicated culture days (m) and growth curve (n) of F1-AGVT hPGCLC-derived cells cultured without BMP2 (1 biological replicate). o, p, Flow cytometric plots for AGVT expression (o) and proportion of cells with the indicated fluorescence-marker expression (p) at the indicated culture days during BMP-driven F2-AGVT hPGCLC differentiation (2 biological replicates). q, Expression of the indicated genes in the indicated cells measured by qRT-PCR (2 biological replicates). Quantification was as in Extended Data Fig. 1j. r, Dot blot analysis of the genomic 5mC level in the indicated cells (2 biological replicates for hiPSCs and hPGCLCs, and 1 biological replicate the other cells). s, Relief contrast and fluorescence (VT and AG) images of F1-AGVT hPGCLC-derived cells frozen at c64 and thawed and cultured for an additional 24 days (1 biological replicate). Bar, 200 μm. t, u, Growth curve (t) and proportion of cells with the indicated fluorescence-marker expression (u) during BMP-driven M1-AGDT hPGCLC differentiation with or without FBS (2 biological replicates). Source Data
Extended Data Fig. 5
Extended Data Fig. 5. Identification of distinctive transcriptional processes driven by BMP signaling.
a, Heatmap showing the expression levels of 13 previously reported genes that show up-regulation in gonadal germ cells (DAZL and DDX4 are excluded) (top), and the unique genes on the Y chromosome (bottom) in the indicated cell types (see Supplementary Table 2 for full sample information). Color coding is as indicated. NA: not applicable. b, Expression dynamics of CDH5 and DMRT1, the genes used as markers for human germ cells from the migration stage onward, during hPGCLC induction and BMP-driven hPGCLC differentiation. The average (bar) and replicate (circles) values are shown (see Supplementary Table 2 for full sample information). The data for iPSCs, iMeLCs were with M1-BTAG, and the data for hPGCLCs were with the M1-BTAG, M1-AGDT, and F1-AGVT lines. Color coding is as indicated. c, PC1−PC3 plane of the PCA of transcriptomes during hPGCLC induction and BMP-driven and xrOvary-based hPGCLC differentiation in Fig. 3b (left, top), and the GO enrichments with p values of genes contributing to the negative [standard deviation (SD) < − 2: BMP-up-regulated genes] and positive [SD > 2: xrOvary-up-regulated genes] scores of PC3 (left, bottom; right). Color coding is as indicated. d, PCA of M1-AGDT hPGCLC-derived AD+DT cells cultured with or without BMP2. The color coding is as indicated. Genes expressed in at least one sample [log2(RPM + 1) ≥ 4] were used for PCA. e, UHC of highly variable genes (top 1,000 genes with high coefficient of variance) in (d) based on their expression dynamics. f, Box plots of the expression dynamics of the 7 gene clusters in (e) during hPGCLC culture with or without BMP2. The 7 gene clusters are classified into those showing progressive up- (clusters 4, 5, 7) or down- (clusters 1, 2, 3, 6) regulation during BMP-driven hPGCLC differentiation. Numbers of genes in each cluster are: n = 223 for cluster 1; n = 230 for cluster 2; n = 133 for cluster 3; n = 59 for cluster 4; n = 251 for cluster 5; n = 76 for cluster 6; n = 28 for cluster 7. The upper hinges, lower hinges, and middle lines indicate 75 percentiles, 25 percentiles, and median values, respectively. The whiskers are drawn in length equal to the inter-quartile range (IQR) multiplied by 1.5. Data beyond the upper/lower whiskers are shown as dots. g, Gene ontology (GO) enrichments and representative genes in up- (clusters 4, 5, 7) (left) and down- (clusters 1, 2, 3, 6) (right) regulated genes. p-values are provided by Fisher’s exact test. The color coding is as indicated. h, Expression dynamics of DUSP4 and DUSP6 (GO:0070373~negative regulation of ERK1 and ERK2 cascade), and INSR and SHC2 (GO:0043410~positive regulation of MAPK cascade) during hPGCLC induction and BMP-driven hPGCLC differentiation. The average (bar) and replicate (circles) values are shown (see Supplementary Table 2 for full sample information). The data for iPSCs, iMeLCs were with M1-BTAG, and the data for hPGCLCs were with the M1-BTAG, M1-AGDT, and F1-AGVT lines. i, Western blot analysis of the levels of phosphorylated or total ERK1 and 2 in M1-AGDT hPGCLC-derived cells at c33 cultured with or without BMP2. 3 independent cultures were analyzed for 2 biological replicates. αTUBLIN were used for the loading control. For the gel source data, see Supplementary Figure 3. pERK: phosphorylated ERK. j, Quantification of pERK1 and 2 levels normalized by αTUBLIN in M1-AGDT hPGCLC-derived cells at c33 cultured with or without BMP2 in (h). The average fold-differences of the Western blot signals for pERK1 and pERK2 were ~4.5-fold and ~2.9-fold (Expt. 1) and ~4.3-fold and ~3.9-fold (Expt. 2), respectively. p values with two-sided Welch’s t-test are shown. Data from 2 independent experiments with 3 biological replicates were shown in (i) and (j). Source Data
Extended Data Fig. 6
Extended Data Fig. 6. scRNA-seq analysis of BMP-driven female hPGCLC differentiation.
a, Heatmap showing the expression levels of key genes in oogonia/fetal oocytes in vivo (left) and F1-AGVT hPGCLC-derived cells in vitro (right) classified into 10 clusters in Fig. 3c. The actual expression levels [log2(normalized read counts+1)] are provided in Source Data Extended Data Fig. 6. The color coding is as indicated. b, c, Proportion of the 10 clusters in Fig. 3c in the indicated samples (b) and of the indicated samples in each cluster (c). The actual percentages of major clusters (b)/culture days/weeks post-fertilization (wpf) (c) are shown within the histogram. The full information is provided in Source Data Extended Data Fig. 6. The color coding is as indicated. df, The numbers of differentially expressed genes (DEGs) between in vivo and in vitro cell types in the EM, M, and PLL clusters (d), volcano plots for the comparisons in the M and PLL clusters (e), and the GO enrichments with p values of DEGs in the M and PLL clusters (f). In (e, f), p-values are provided by Fisher’s exact test. g, Heatmap showing the expression levels of PLL1 (left) or PLL2 (right) signature genes (top 50 genes highly expressed in PLL1 or 2 relative to all other clusters) in the indicated samples. The color coding is as indicated. h, GO enrichments with p values of DEGs between PLL1 in vivo and in vitro cells (top) and between PLL1 in vivo and PLL2 in vitro cells (bottom). p-values are provided by Fisher’s exact test. Source Data
Extended Data Fig. 7
Extended Data Fig. 7. DNA methylome reprogramming during BMP-driven hPGCLC differentiation.
a, Scatter-plot comparisons (contour representation) of the 5mC levels (genome-wide 2-kb bins), combined with histogram representation (top and right of the scatter plots), between the indicated cell types. Note that genome-wide 5mC profiles of F1 and F2-AGVT hiPSCs measured by EM-seq are highly similar to those of F2-AGVT hiPSCs measured by whole genome bisulfite sequence (WGBS). b, Heatmap of the 5mC [CpG (top) or CpA (bottom)] levels on chromosome 1 (left) and chromosome X (right) in the indicated samples. For chromosome X (right), data were generated using the reads overlapping with allelic SNPs. mb, megabases. The color coding is as indicated. N.D.: bins without enough CpGs (4) with read depth ≥4 in CpG or bins without enough mC + C calls (≥10) in CpA. c, PCA of the indicated samples using the 5mC levels on the autosome-wide (left) or Xa- and Xi-wide (right) 2-kb bins (top) and promoters (bottom). The color coding is as indicated.
Extended Data Fig. 8
Extended Data Fig. 8. DNA methylome reprogramming and identification of core ER genes during BMP-driven hPGCLC differentiation.
a, Violin plots of the promoter 5mC-level dynamics of 13 previously reported genes that show up-regulation in gonadal germ cells (left) and genes included in the GO term “meiotic cell cycle” (GO: 0051321) in the indicated cells during BMP-driven hPGCLC differentiation and in in vivo germ cells. All relevant promoters are classified into H/I/LCP (high/intermediate/low CpG promoter) and plotted. b, Violin plots of the average 5mC levels on the indicated repeat elements in the indicated cell types (see Supplementary Table 2 for full sample information). Bars represent the average values. The DNA methylome data for human spermatozoa, oocytes, and blastocytes are from and those for human male and female germ cells at 9 wpf are from. c, Venn diagram showing the relationships of the DNA demethylation escapees among the indicated samples, and composition of the escapees in the indicated samples (d: male samples; e; female samples, with autosomes and X chromosomes separately indicated). Color coding is as indicated. d, Genome coverage (%) by EM-seq with paired-end sequencing (this study), EM-seq with computationally simulated single-end sequencing, whole genome bisulfite sequence (WGBS) with single-end 101 bp sequencing, and WGBS with single-end 50 bp sequencing. e, Annotation of differentially covered regions between paired-end and single-end sequencing in (d). Color coding is as indicated. f, (top) Violin plots of the average 5mC levels (genome-wide 2 kb bins) in the indicated cell types. Bars represent the average values. (bottom) Scatter-plot comparisons (contour representation) of the 5mC levels (genome-wide 2-kb bins), combined with histogram representation (top and right of the scatter plots), between the indicated cell types. Note that DAZL+ PGCLCs by Irie et al. are highly methylated (~76%) and that hPGCLCs by von Meyenn et al. and cultured hPGCLCs by Kobayashi et al. remain methylated (the average 5mC levels of 57.9% and 61.4%, respectively) and show a methylome similar to that in M1-AGDT hPGCLC-derived cells at c32 cultured without BMP2 (AG B−). g, PCA of transcriptomes of key cell types during hPGCLC induction and BMP-driven hPGCLC differentiation (top) and the identification of the genes with significant contributions [radius of standard deviations (SDs) ≥ 3] to scaled PC1 and PC2 loadings (bottom). Genes expressed in at least one sample [log2(RPM + 1) ≥ 4] were used for PCA. h, i, UHC of the genes selected in (g) based on their expression dynamics (h), and promoter methylation dynamics of the genes in the five clusters in (h) (i) during hPGCLC induction and BMP-driven hPGCLC differentiation. Among the cluster 3 genes, those showing promoter 5mC-level reduction from hiPSCs to oogonia-like cells by ≥ 50% are defined as epigenetic reprogramming-activated genes (ER genes), which are classified into early and late ER genes based on their expression dynamics. j, Venn diagram showing the overlap of ER genes defined for xrOvaried-based (Extended Data Fig. 1f–h) and BMP-driven (Extended Data Fig. 8g−i) hPGCLC differentiation. Source Data
Extended Data Fig. 9
Extended Data Fig. 9. ER gene regulation and XCR.
a, Expression dynamics of core ER genes (early: yellow; late: red) (Extended Data Fig. 8f–i) during BMP-driven M1-AGDT (top) and F1-AGVT (bottom) hPGCLC differentiation. b, Box plots showing the expression of core ER genes (n = 42) in in vitro and in vivo EM, M, and PLL cells in Fig. 3c. The upper hinges, lower hinges, and middle lines indicate 75 percentiles, 25 percentiles, and median values, respectively. The whiskers are drawn in length equal to the inter-quartile range (IQR) multiplied by 1.5. Data beyond the upper/lower whiskers are not shown. c, 5mC-level tracks of DAZL (top) and DDX4 (bottom) loci in the indicated cell types. Green bars represent the promoters [+400 bp and −900 bp of the transcription start sites (TSSs)], and their 5mC levels are indicated. d, Scatter-plot representations of the relationship between promoter-5mC-level differences and expression-level differences for early (yellow, left) and late (red, right) ER genes between c82 AG+DT and DT+ cells (top) and between c72 AG+VT and VT+ cells (bottom). Regression lines are indicated. e, Heatmap of the promoter 5mC (left) and expression (right) level dynamics of the X-linked genes during BMP-driven F1-AGVT hPGCLC differentiation. The Xa and Xi allelic data were generated using the reads overlapping allelic SNPs. The genes were classified according to their promoter 5mC levels on the Xa and Xi alleles in hiPSCs: class 1 genes with high (≥ 50%) 5mC on both Xa and Xi (16 genes), class 2 genes with low (<50%) 5mC on Xa and high 5mC on Xi (40 genes), a class 3 gene with high 5mC on Xa and low 5mC on Xi (XIST), and class 4 genes with low 5mC on both Xa and Xi (3 genes) (Supplementary Table 8). The color coding is as indicated. N.D., promoters with insufficient read depths. Note that there were no informative single nucleotide polymorphisms (SNPs) that discriminate XIST expression from parental alleles with the 3-prime RNA-seq analysis. f, Expression dynamics from the Xa and Xi alleles during BMP-driven F1-AGVT hPGCLC differentiation. (left) Proportions of the expression from the Xa allele in the three gene classes in (e) are plotted, with individual values plotted as diamonds and their averages shown as colored lines. The distributions of the Xa ratio of all genes are shown as violin plots. Data points at 100% are dispersed within the range of 5% for better visualization. Raw data are available in (Supplementary Table 8). (right) Proportions of the expression from the Xa allele of the class 1 and 2 genes are box-plotted, with genes retaining high (≥ 50%) and low (≤ 25%) 5mC levels in c117/118 AG+VT+ cells colored blue and green, respectively. g, Xa allele usage of genes expressed similarly from Xa and Xi in VEM cells at c11 (% Xa usage <90%; 8 genes) (top) or those expressed predominantly from Xa in VEM cells at c11 (% Xa usage ≥ 90%; 34 genes) (bottom) in the indicated cell types. Xa: active X chromosome. VEM, M, and PLL are defined in Fig. 3c. h, Dynamics of the X chromosome:autosome ratio (X:A ratio) of gene-expression levels (top) and XIST expression (bottom) during BMP-driven M1-AGDT (left) and F1-AGVT (right) hPGCLC differentiation, based on the bulk RNA-seq data. The ratios of the 75%-tile expression values of the genes from the chromosome X or chromosome 10, relative to those of all genes are plotted in the log2 (left) or linear (right) scale. i, Absolute expression-level fold-changes of UHRF1, DNMT3A, and DNMT3B during BMP-driven hPGCLC specification and differentiation. The data in Fig. 3a are used and the value in one replicate in hiPSCs is set as one. 3 biological replicates for hiPSCs and 2 biological replicates for the other cells. The red circles present the average. j, Violin plots for the methylated CpA levels (genome-wide 10-kb bin, n = 290,409) in the indicated cell types. Absolute values of effect sizes (Cohen’s d-values) are as follows: 1.05 for hPGCLC, 0.72 for c32 AG BMP (+), 0.82 for c82 AG, 0.80 for c82 AGDT, 1.00 for c122. The upper hinges, lower hinges, and middle lines indicate 75 percentiles, 25 percentiles, and median values, respectively. The whiskers are drawn in length equal to the inter-quartile range (IQR) multiplied by 1.5. Data beyond the upper/lower whiskers are not shown. k, IF analysis of the expression and subcellular localization of UHRF1 co-stained with GFP (TFAP2C-EGFP: AG) and DAPI in the indicated cell types (left, top) (1 replicate for each culture), and normalized UHRF1 signal intensities across the nucleus and cytoplasm (magenta lines) of randomly chosen 10 cells (left, bottom) and their curve fitting representation by Generalized additive model with grey error bands indicating 95% confidence intervals (right, top). The outlines of the nucleus (nuc) and cytoplasm (cyto) were determined based on the visual inspection of the DAPI and AG signals (dotted lines), respectively. In (left, top), AG appeared to be enriched in the nucleus, but the reason was unclear. (right, bottom) Quantification of the nuclear/cytoplasmic ratio of UHRF1 by an automated image analysis was shown in. The numbers of cells measured in each sample (n) were indicated. p values provided by Tukey-Kramer test are as follows: <1.0 × 10−7 for comparison using c21 BMP2 (−), 0.67 for c21 BMP2 (+) vs c50 BMP2 (+), 5.7 × 10−7 for c21 BMP2 (+) vs c70 BMP2 (+), 3.4×10⁻⁶ for c50 BMP2 (+) vs c70 BMP2 (+). The upper hinges, lower hinges, and middle lines indicate 75 percentiles, 25 percentiles, and median values, respectively. The whiskers are drawn in length equal to the inter-quartile range (IQR) multiplied by 1.5. Data beyond the upper/lower whiskers are shown as dots. Bar, 10 μm. l, Doubling times, 5mC demethylation levels, and 5mC demethylation rates per cell division in the indicated culture periods. m, 5mC demethylation ratios of genomic bins bearing different 5mC levels in the originated cell types during the indicated cell-type transitions. Pie charts indicate the proportion of each bin in the originated cell types. The color coding is as indicated. n, A pie chart showing overlap of the bins bearing ≥ 80% 5mC levels in c32 cells cultured with BMP2 with the DNA demethylation escapees in human germ cells in vivo. Source Data
Extended Data Fig. 10
Extended Data Fig. 10. Generation of TET1 knockout hiPSCs and analysis of BMP-driven TET1-knockout hPGCLC differentiation.
a, Scheme of the human TET1 locus, with the illustration of PAM (protospacer adjacent motif) and guide RNA sequences in the exon 6. Black boxes indicate the exons. b, Sequences of the targeted loci in two TET1 knockout (KO) cell lines [TET1 KO#1 and # 2 (M1-BTAG TET1−/− #142 and #2725)]. c, Dot-blot analysis of genomic 5hmC levels in wild-type and TET1 KO hiPSCs (1 replicate for each line). d, Karyotype of TET1 KO#1 and #2 hiPSCs (top: chromosome spreads; bottom: percentage of cells with 46 or other chromosome numbers) (1 biological replicate for each line). Bar, 10 μm. e, Mass spectrometric analysis [log2(signal intensities)] for TET1 and its truncated protein potentially derived from the TET1 KO allele in wild-type and TET1 KO cells. Peptides from the full-length (top), but not the truncated (bottom), TET1 were detected from the wild-type cells (red and blue bars), whereas neither form was detected from the TET1 KO cells (2 biological replicates). f, Induction of hPGCLCs from wild-type (M1-BTAG) and TET1 KO#1 and #2 hiPSCs. Photomicrographs of hiPSCs and iMeLC aggregates induced for hPGCLCs for 6 days (bright-field and fluorescence images for AG and BT) (left), their flow cytometric plots for AG and BT expression (middle), and percentages of BT+AG+ cells (right) from each genotype are shown (4 biological replicates). Bar, 500 μm. g, Growth curves of BT+AG+ cells and enrichment scores during BMP-driven (~c12: 25 ng/ml; c12~: 100 ng/ml) wild-type and TET1 KO#1 and #2 hPGCLC differentiation. 5 and 2 biological replicates for c12−c32 and for c42, respectively. The color coding is as indicated. h, UHC of the transcriptomes during hPGCLC induction and BMP-driven hPGCLC differentiation from wild-type and TET1 KO hiPSCs, with the expression levels of key genes indicated. The color coding is as indicated. ik, The numbers of the differentially expressed genes (DEGs) [log2(RPM + 1) ≥ 3, fold change ≥ 2] between wild-type and TET1 KO cells (up- or down-regulated in TET1 KO cells) (i), UHC of the DEGs (j), and the GO enrichments and representative genes in the indicated DEG clusters (k). DEGs were defined using average expression values of biological replicates. The DEG numbers were unions of two comparisons (i.e., wild-type vs KO#1 and vs KO#2). Core ER genes were highlighted in red in (j). l, Box plots for the expression dynamics of ER genes (n = 42) during hPGCLC induction and BMP-driven hPGCLC differentiation from wild-type and TET1 KO hiPSCs. p-values of Two-sided Dunnet’s test (except c42) or paired two-sided t-test (c42) were shown. The upper hinges, lower hinges, and middle lines indicate 75 percentiles, 25 percentiles, and median values, respectively. The whiskers are drawn in length equal to the inter-quartile range (IQR) multiplied by 1.5. Data beyond the upper/lower whiskers are not shown. Source Data
Extended Data Fig. 11
Extended Data Fig. 11. TET1 protects hPGCLCs from differentiation into extraembryonic cells.
a, b, Proportion of wild-type and TET1 KO cells (a) and cell-cycle phases (b) in the 11 clusters in Fig. 4b. The actual proportions of major clusters (a)/cell-cycle phases (b) are shown within the histogram. The full information is provided in Source Data Extended Data Fig. 11. The color coding is as indicated. c, Correlations among clusters in Fig. 4b based on expression of the top 2,000 highly variable genes (HVGs). Spearman’s rank correlation coefficient was calculated for analysis. UHC of the clusters is indicated on the heatmap. d, Partition-based graph abstraction (PAGA) analysis of the relationships of the clusters in Fig. 4b. e, Genotype composition (top) and expression profiles of key lineage markers and cell-type annotation (bottom) of each cluster. AMLC: amnion-like cells; EXMLC: extra-embryonic mesoderm-like cells. Color coding is as indicated. f − h, UMAP plots and Louvain clustering of scRNA-seq data of a PSC-based model of early human post-implantation development (f), the expression of key lineage markers in the 7 clusters in (f) (g), and the annotation of the 7 clusters based on their gene expression (h). AMLC: amnion-like cells; MeLC: mesoderm-like cells. The color coding is as indicated. i, (left) Integrated UMAP plots and Louvain clustering of scRNA-seq data in Fig. 4b with those of (f). (right) Distributions of data in this study and the study of Zheng et al. j, Cell-type composition of each cluster. Annotations are based on Zheng et al. and the results in panel (h). The actual proportions of major cell types are shown within the histogram. The full information is provided in Source Data Fig. 5. k, Prediction of the cell types of the clusters in Fig. 4b using the prediction tool by Zhao et al. The color coding is as indicated. PriS: primitive streak; ExE_Mes: extra-embryonic mesoderm; Epi: epiblast; PriS_Amnion; primitive streak_amnion; Mes: mesoderm; TE: trophectoderm; NoSigHts: no significant hits. Source Data
Extended Data Fig. 12
Extended Data Fig. 12. TET1 KO cells hyper-methylate regulatory elements and de-repress bivalent genes.
a, Two dimensional UMAP embedding of all open sites (ATAC-seq peaks) during hPGCLC induction based on epigenetic signals of relevant cell types using public data, with labels derived from semi-supervised HDBSCAN (hierarchical density-based spatial clustering of applications with noise). The open sites were colored according to the labels (top, left) or signal intensities of relevant histone modifications (bottom). The averaged signal intensities of relevant histone modifications in each label (cluster) are shown (top, left). b, Odds ratio and q-value of the enrichment of the 2-kb bins with higher 5mC levels in TET1 KO cells compared to wild-type cells at c42 in the Ensembl Regulatory Build annotations. ce, Violin plots for the 5mC-level (%) (c, d) and the expression-level (log2 fold-change) (e) differences between wild-type and TET1 KO hPGCLC-derived cells at c42 on the indicated elements. Annotations and the numbers of each element are same as Fig. 5d,e,g. In (e), p-values of each comparison are as follows: <2.2 × 10−16 for active promoter, poised promoter, silent promoter, active enhancer, and poised enhancer, p = 5.0 × 10−6 for silent enhancer (two-sided t-test adjusted by Bonferroni correction). Promoters, enhancers (non-promoter open sites), and their labels are based on the data for d4 hPGCLCs. Silent promoters: promoters that did not overlap with open sites; silent enhancers: enhancers categorized neither into active, bivalent, nor poised. In (ce), the upper hinges, lower hinges, and middle lines indicate 75 percentiles, 25 percentiles, and median values, respectively. The whiskers are drawn in length equal to the inter-quartile range (IQR) multiplied by 1.5. Data beyond the upper/lower whiskers are shown as dots. f, Odds ratio of the enrichment of genes with indicated promoters defined in d4 hPGCLCs and ER genes (for down-regulated genes) in genes up- (left) or down- (right) regulated in TET1 KO hPGCLC-derived cells at c42. Number of each gene class is indicated. g, Odds ratio of the c42 up-regulated genes bound by TET in hESCs in each category of promoters. The odds ratio was calculated relative to the background ratio of all genes bound by TET in each respective promoter category. Number of each gene class is indicated. h, A summery scheme of the present work. Source Data

Comment in

References

    1. Tang WW, Kobayashi T, Irie N, Dietmann S, Surani MA. Specification and epigenetic programming of the human germ line. Nat. Rev. Genet. 2016;17:585–600. - PubMed
    1. Tahiliani M, et al. Conversion of 5-methylcytosine to 5-hydroxymethylcytosine in mammalian DNA by MLL partner TET1. Science. 2009;324:930–935. - PMC - PubMed
    1. Tang WW, et al. A unique gene regulatory network resets the human germline epigenome for development. Cell. 2015;161:1453–1467. - PMC - PubMed
    1. Hertig AT, et al. A thirteen-day human ovum studied histochemically. Am. J. Obstet. Gynecol. 1958;76:1025–1040. - PubMed
    1. Sasaki K, et al. The germ cell fate of cynomolgus monkeys is specified in the nascent amnion. Dev. Cell. 2016;39:169–185. - PubMed

MeSH terms

Substances