. 2024 Jun;630(8018):831-835.
doi: 10.1038/s41586-024-07395-z. Epub 2024 May 20.

A warm Neptune's methane reveals core mass and vigorous atmospheric mixing

Affiliations

A warm Neptune's methane reveals core mass and vigorous atmospheric mixing

David K Sing et al. Nature. 2024 Jun.

Abstract

Observations of transiting gas giant exoplanets have revealed a pervasive depletion of methane1-4, which has only recently been identified atmospherically5,6. The depletion is thought to be maintained by disequilibrium processes such as photochemistry or mixing from a hotter interior7-9. However, the interiors are largely unconstrained along with the vertical mixing strength and only upper limits on the CH4 depletion have been available. The warm Neptune WASP-107b stands out among exoplanets with an unusually low density, reported low core mass10, and temperatures amenable to CH4, though previous observations have yet to find the molecule2,4. Here we present a JWST-NIRSpec transmission spectrum of WASP-107b that shows features from both SO2 and CH4 along with H2O, CO2, and CO. We detect methane with 4.2σ significance at an abundance of 1.0 ± 0.5 ppm, which is depleted by 3 orders of magnitude relative to equilibrium expectations. Our results are highly constraining for the atmosphere and interior, which indicate the envelope has a super-solar metallicity of 43 ± 8 × solar, a hot interior with an intrinsic temperature of Tint = 460 ± 40 K, and vigorous vertical mixing which depletes CH4 with a diffusion coefficient of Kzz = 1011.6±0.1 cm2 s-1. Photochemistry has a negligible effect on the CH4 abundance but is needed to account for the SO2. We infer a core mass of 11.5 - 3.6 + 3.0 M , which is much higher than previous upper limits10, releasing a tension with core-accretion models11.


Conflict of interest statement

The authors declare no competing interests.

Figures

Fig. 1
Fig. 1. The light curve of WASP-107b observed by JWST-NIRSpec G395H.
a, The normalized wavelength-integrated white-light curves for the two detectors are shown, with the NRS1 (2.70–3.71 μm) and NRS2 (3.83–5.16 μm) detectors offset for clarity. A best-fit limb-darkened transit model is overplotted (blue). See Extended Data Fig. 2 for further details. b, The model residuals that achieve near-photon limited precisions. Source Data
Fig. 2
Fig. 2. WASP-107b transmission spectral measurements.
JWST-NIRSpec transmission spectrum and the 1σ uncertainties. The best-fit ATMO model is also plotted, and the individual contributions for each molecular species are shown. Source Data
Fig. 3
Fig. 3. Model interpretation.
ATMO non-equilibrium chemistry model with vertical mixing and photochemistry. The best-fit non-equilibrium chemistry model (solid lines) and the abundance profiles in equilibrium (dot-dashed lines) are shown. The retrieved JWST abundances are shown (data points) with the model grid indicating that the planet has hot interior temperatures (Tint = 458 ± 38 K), a super-solar metallicity (Z/Z = 43 ± 8) with vigorous vertical mixing (Kzz = 1011.6±0.1 cm2 s−1). Source Data
Extended Data Fig. 1
Extended Data Fig. 1. FIREFLy transit light curve spectrophotometry.
Shown is the relative flux as a function of wavelength and time for NIRSpec detectors (a) NRS1 and (b) NRS2.
Extended Data Fig. 2
Extended Data Fig. 2. Stellar spot-crossing.
Shown is the residual white-light curve photometry from NRS1 when fitting for the non-spotted data (black dots). The suspected occulted spot (red crosses) is shown, with a Gaussian smoothed filter overplotted (blue line).
Extended Data Fig. 3
Extended Data Fig. 3. Limb-Darkening.
Shown are the resulting stellar limb-darkening coefficients q1 (a) and q2 (b) derived from the transit light curves using a quadratic law. The limb-darkening coefficients derived from a stellar model are also shown, along with the models with an offset derived from the difference between the data and model.
Extended Data Fig. 4
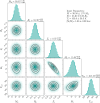
Extended Data Fig. 4. WASP-107 b retrieval posteriors.
Shown is the distribution for the ATMO free-retrieval. VMR refers to the Volume Mixing Ratio of the molecular species. 1, 1.5, and 2-σ equivalent contours are shown. The 1D histograms show the marginalized parameter median value and 1-σ range (red).
Extended Data Fig. 5
Extended Data Fig. 5. Equilibrium chemistry estimation.
Shown is a posterior distribution of metallicity, temperature, pressure and C/O equilibrium chemistry values that are simultaneously compatible with the retrieved abundances of H2O, CO, CO2.
Extended Data Fig. 6
Extended Data Fig. 6. Pressure-Temperature Profiles.
Shown are P-T profiles in radiative-convective equilibrium with Tint values ranging from 100 to 500 K (grey). The T-P with the best-fit Tint is shown (blue), with a shaded region showing where the model is dominated by convection. The quench pressures for CO2 and CH4 are also depicted along with Mg-Si condensation curves (dashed, dot dashed lines). The equilibrium CH4=CO equal-abundance curve is also shown (dotted line), with the CH4 abundance dropping at increased temperatures. The brightness temperatures measured from Spitzer secondary eclipse observations are shown from ref. . The corresponding pressures and ranges are derived from the best-fit model contribution function, with the y-axis range encapsulating 80% of the total emitted flux. The Spitzer brightness temperatures are consistent with the best-fitting Tint = 460K T-P profile.
Extended Data Fig. 7
Extended Data Fig. 7. WASP-107b forward non-equilibrium chemistry model grid results.
(a) Shown are the best-fitting chemical abundances (within 1-σ) from the non-equilibrium chemistry models along with the retrieved values from the JWST transmission spectrum (datapoints). (b) The corner plot depicts the forward model grid points (red squares) along with the constraints in atmospheric metallicity (Z/Z), intrinsic temperature (Tint), and eddy diffusion coefficient (Kzz).
Extended Data Fig. 8
Extended Data Fig. 8. Interior structure modeling constraints.
A corner plot of the posterior mass (MJ), radius (RJ), envelope metallicity (unitless), core mass (M), and intrinsic temperature (K). The model inputs (from observations) are shown in the upper-right, and the priors were weakly-informative. The overall bulk metallicity is set by M, R, and Tint, and can be seen as an arc in Ze-Mc space. Our atmospheric constraint restricts us to a section of this arc; without it, the two parameters would be fully degenerate, running from Mc = 0 on one side to Ze = 0 on the other, though the effect on Zp would be much more limited. The intrinsic temperature is significantly higher than unheated evolution models would produce, and is thus evidence of tidal heating (see text).

References

    1. Stevenson KB, et al. Possible thermochemical disequilibrium in the atmosphere of the exoplanet GJ 436b. Nature. 2010;464:1161–1164. - PubMed
    1. Kreidberg L, Line MR, Thorngren D, Morley CV, Stevenson KB. Water, high-altitude condensates, and possible methane depletion in the atmosphere of the warm super-Neptune WASP-107b. Astrophys. J. Lett. 2018;858:L6.
    1. Fu G, et al. Water and an escaping helium tail detected in the hazy and methane-depleted atmosphere of HAT-P-18b from JWST NIRISS/SOSS. Astrophys. J. Lett. 2022;940:L35.
    1. Dyrek A, et al. SO2, silicate clouds, but no CH4 detected in a warm Neptune. Nature. 2024;625:51–54. - PubMed
    1. Bell TJ, et al. Methane throughout the atmosphere of the warm exoplanet WASP-80b. Nature. 2023;623:709–712. - PubMed