. 2024 Jul;631(8021):583-592.
doi: 10.1038/s41586-024-07556-0. Epub 2024 May 20.

A deep catalogue of protein-coding variation in 983,578 individuals

Collaborators, Affiliations

A deep catalogue of protein-coding variation in 983,578 individuals

Kathie Y Sun et al. Nature. 2024 Jul.

Erratum in

  • Author Correction: A deep catalogue of protein-coding variation in 983,578 individuals.
    Sun KY, Bai X, Chen S, Bao S, Zhang C, Kapoor M, Backman J, Joseph T, Maxwell E, Mitra G, Gorovits A, Mansfield A, Boutkov B, Gokhale S, Habegger L, Marcketta A, Locke AE, Ganel L, Hawes A, Kessler MD, Sharma D, Staples J, Bovijn J, Gelfman S, Di Gioia A, Rajagopal VM, Lopez A, Varela JR, Alegre-Díaz J, Berumen J, Tapia-Conyer R, Kuri-Morales P, Torres J, Emberson J, Collins R; Regeneron Genetics Center; RGC-ME Cohort Partners; Cantor M, Thornton T, Kang HM, Overton JD, Shuldiner AR, Cremona ML, Nafde M, Baras A, Abecasis G, Marchini J, Reid JG, Salerno W, Balasubramanian S. Sun KY, et al. Nature. 2025 Jan;637(8047):E26. doi: 10.1038/s41586-024-08571-x. Nature. 2025. PMID: 39779867 Free PMC article. No abstract available.

Abstract

Rare coding variants that substantially affect function provide insights into the biology of a gene1-3. However, ascertaining the frequency of such variants requires large sample sizes4-8. Here we present a catalogue of human protein-coding variation, derived from exome sequencing of 983,578 individuals across diverse populations. In total, 23% of the Regeneron Genetics Center Million Exome (RGC-ME) data come from individuals of African, East Asian, Indigenous American, Middle Eastern and South Asian ancestry. The catalogue includes more than 10.4 million missense and 1.1 million predicted loss-of-function (pLOF) variants. We identify individuals with rare biallelic pLOF variants in 4,848 genes, 1,751 of which have not been previously reported. From precise quantitative estimates of selection against heterozygous loss of function (LOF), we identify 3,988 LOF-intolerant genes, including 86 that were previously assessed as tolerant and 1,153 that lack established disease annotation. We also define regions of missense depletion at high resolution. Notably, 1,482 genes have regions that are depleted of missense variants despite being tolerant of pLOF variants. Finally, we estimate that 3% of individuals have a clinically actionable genetic variant, and that 11,773 variants reported in ClinVar with unknown significance are likely to be deleterious cryptic splice sites. To facilitate variant interpretation and genetics-informed precision medicine, we make this resource of coding variation from the RGC-ME dataset publicly accessible through a variant allele frequency browser.


Conflict of interest statement

K.Y.S., X.B., S.C., S. Bao, C.Z., M.K., J. Backman, T.J., E.M., G.M., A.G., A. Mansfield, B.B., S.G., L.H., A. Marcketta, A.E.L., L.G., A.H., M.D.K., D.S., J.S., J. Bovijn, S.G., A.D.G., V.M.R., A.L., J.R.V., M.C., T.T., J.D.O., A.R.S., M.L.C., M.N., A.B., G.A., J.M., J.G.R., W.S. and S. Balasubramanian are current employees and/or stockholders of Regeneron Genetics Center or Regeneron Pharmaceuticals. H.M.K. was a former employee of Regeneron Genetics Center.

Figures
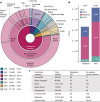
Fig. 1
Fig. 1. Variant survey and population counts in the RGC-ME dataset.
a, Summed proportional ancestry (sum of weighted ancestry probabilities) at continental, sub-continental and regional levels for 821,979 unrelated samples (Supplementary Table 1b). All subsequent variant counts and surveys have been performed in the unrelated analysis set. UNK, unknown. b, Count of variants unique to RGC-ME (that is, variants not in gnomAD v.3.1.2 genomes, gnomAD v.2.1.1 exomes and TOPMed Freeze 8), broken down by singletons and variant functional category. M, million. c, Variant counts in different functional categories, proportion of singletons and per-individual median values. All counts were based on variants in the canonical transcript. pLOF includes frameshift, essential splice donor and acceptor (excluding splice sites in UTRs) and stop-gained variants.
Fig. 2
Fig. 2. Estimates of gene-level constraint, representing shet, from the RGC-ME dataset.
a, Mean shet probability density for 16,710 canonical transcripts with 95% CIs calculated with 10,000 bootstrapped samples from the means of individual genes. b, Odds ratios (points) and 95% CIs (short horizontal lines; computed using standard error) for genes with shet cut-off > 0.073 (deemed highly constrained genes) to be included in each gene category listed on the y axis compared with genes below the cut-off. Genes defined as ‘human knockouts’ are those with carriers of rare, biallelic pLOF variants observed in the RGC-ME dataset. A total of 16,710 canonical transcripts were included in each category, which contained at minimum 234 ‘true’ genes (that category being haploinsufficient genes). HGMD, Human Gene Mutation Database.
Fig. 3
Fig. 3. Missense regional constraint captured by MTR.
a, Odds ratio (OR) (points) and 95% CIs (error bars, two-sided Fisher’s exact test) of ClinVar pathogenic versus benign variants in MTR ranking regions across the whole exome. Comparisons include MTR calculated using the 822K unrelated samples from the RGC-ME dataset on 31-codon (blue) and 21-codon (pink) windows, and MTR calculated using a random subset of 225,000 samples from the larger 822K samples using a 31-amino-acid sliding window (yellow). MTR values include variants for which the FDR is less than 0.1. A total of 21,047 benign ClinVar variants and 12,872 pathogenic ClinVar variants (two stars or more (CV2+)) were included. b, MTR ranking distribution of different protein functional regions and variant groups (in order: DNA-binding sites (n = 2,787), ClinVar pathogenic sites (n = 10,673), active sites (n = 2,787), transmembrane region (n = 2,787), localized to extracellular (n = 25,665), localized to cytoplasm (n = 32,994) and ClinVar benign sites (n = 20,739)). Box plot shows median and 25–75% interquartile range. The whisker minima and maxima represent the smallest and largest data points within 1.5× the interquartile range from the lower quartile and upper quartile, respectively. Every functional category was significantly more constrained than the category to its right with two-sided Wilcoxon rank-sum test (least significant p-value = 2 × 10⁻⁴, Bonferroni correction). c, Distribution of the proportion of genes located in exome-wide top-15-percentile MTR regions against the heterozygous selection coefficient, shet. Genes with a significant proportion in the most constrained 15-percentile MTR region are coloured in pink and yellow (P < 0.05, Bonferroni-corrected, one-sided binomial tests with π0 = 0.15), stratified by LOF constraint (shet = 0.073). Pink dots highlight genes that are tolerant of LOF, but have some regions depleted of missense variation. Blue lines indicate the density of genes with shet scores from 0 to 1 (right margin) and genes with a proportion of MTR in the top 15 percentile exome wide (above plot). d, MTR track of an oncogene, KRAS, a missense-specific constrained gene, along with the domain structure of the protein. The blue MTR-constrained region is defined by top-15-percentile exome-wide MTR rank. The N-terminal region containing amino acids 1–80 is depleted of missense variation, even though KRAS is tolerant of heterozygous LOF variation (shet = 0.002).
Fig. 4
Fig. 4. Rare biallelic pLOF variants and ‘human knockouts’ in the RGC-ME dataset.
a, Distribution of the number of individuals per pKO on the log10 scale. Carriers of homozygous pLOFs and compound heterozygous variants were included in this analysis. b, Breakdown of the number of unique pKO genes observed in the RGC-ME dataset by ancestry. Both sets of rare biallelic variants—homozygous pLOFs and compound heterozygous—were included in this analysis. See Extended Data Table 1a for a breakdown by ancestry of each type. c, Projected accrual of pKO genes using homozygous pLOF variant data at hypothetical cohort sizes for each ancestry in 983,578 related individuals. Curves reflect the accrual of the expected number of genes with at least one, at least five and at least ten carriers, respectively, of a rare, homozygous pLOF. Asterisk denotes the inclusion of cohorts with a high rate of consanguinity.
Fig. 5
Fig. 5. Identification of deleterious variants that are predicted to affect splicing.
a, MAPS across different functional categories. Error bars show standard deviation around the mean proportion of singletons (points). The yellow dashed line represents the SpliceAI and MMSplice score threshold for variants that have a MAPS score equal to that of 5/5 missense variants (predicted deleterious by five algorithms). Variants with a SpliceAI score ≥ 0.35 or a MMSplice score ≥ 0.97 are predicted deleterious SAVs. Noncoding variants refers to intronic, downstream (variant located 5′ of a gene), upstream (variant located 3′ of a gene) and 5′ and 3′ UTR variants captured by exome sequencing. Coding variants are inclusive of canonical splice sites, splice region and UTR splice sites. All variants that passed quality control and were observed in unrelated individuals in the RGC-ME dataset were included in this analysis (n = 34,512,842 variants). b, Enrichment of ClinVar pathogenic variants (two stars or more) in predicted SAVs compared with corresponding variant sets filtered by either LOFTEE, 5/5 missense deleteriousness models or CADD. Points represent odds ratios and bars depict 95% CIs (two-sided Fisher’s exact test, no multiple testing correction). ‘All variants’ include 313,390 coding and noncoding variants, and ‘splice sites’ include essential and UTR splice sites; counts of variants included in each calculation are provided in the table. HC, high-confidence. c, Empirical validation of MAPS-predicted deleterious SAVs (intersection set): enrichment of predicted deleterious SAVs in experimentally validated SDVs compared with non-SDVs. Points represent odds ratios and bars depict 95% CIs (two-sided Fisher’s exact test, no multiple testing correction). A total of n = 36,636 variants, of which 346 SAVs are validated SDVs, are included.
Extended Data Fig. 1
Extended Data Fig. 1. Mutation saturation survey in RGC-ME data.
Counts are based on variant-transcript pairs. *Methylation level: mean methylation values across tissues of >0.65, 0.2–0.65, <0.2 correspond to methylation level of 2, 1, 0, respectively. CpG sites with methylation level of 2 are highly methylated, sites with methylation level 0 or 1 are grouped as lowly methylated sites. Variants are subset to target exome regions. Only variants that passed QC are included in the number of all possible variants.
Extended Data Fig. 2
Extended Data Fig. 2. Box plots summarizing counts of variants observed in each unrelated sample in the RGC-ME dataset.
The lower bound, centre and upper bound of each box plot represents the 25, 50, and 75 percentiles of the distributions of counts. Points represent outliers, and whisker minima and maxima represent the smallest and largest points 1.5-times beyond the interquartile range. Individuals were assigned discrete ancestries based on overall fine-scale ancestry probabilities >50% and a total of 755,261 individuals were included. See Supplementary Table 1 for sample size breakdowns.
Extended Data Fig. 3
Extended Data Fig. 3. shet distribution across gene essentiality and disease categories, and evidence that a larger sample improves the precision of shet estimates.
a, Proportion of genes in each disease/essentiality annotation list (gathered from published literature and databases) that correspond to each shet decile. b, Ratio of variances from MCMC sampling for shet calculated on full dataset (824k) and randomly downsampled set of 60,000 individuals. The mean ratio around 0.05 suggests that gene-level variance from the full dataset is 20x smaller than variance for the same gene using the downsampled set. This is the case despite similar, or even higher, shet mean estimates as shown by the colour bar. c, Mean (points) and 95% HPD (green bars) from MCMC sampling for shet estimates of genes in each CDS length quantile for downsampled 60k (left) and full 822K (right) samples. HPD and variance in panels b,c were derived from MCMC sampling for 8,000 final iterations.
Extended Data Fig. 4
Extended Data Fig. 4. Comparisons between shet computed with RGC-ME and other gene constraint metrics.
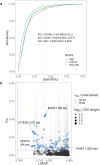
a, Receiver operator curves showing the discrimination between the “high” and “low” constraint genes using different constraint metrics: shet-RGCME, shet-ABC, and LOEUF for transcripts with values from all three methods. The highly constrained category comprised 1,476 haploinsufficient and autosomal dominant (including developmental-specific) genes and the comparison group was represented by 3,893 haplosufficient and genes with rare, biallelic pLOFs in RGC-ME. Dotted lines indicate specificity and sensitivity for shet = 0.073. Sensitivity = TP / (TP+FN), Specificity = TN / (TN+FP). Spearman rank correlations between shet from RGC-ME with these estimates are high (-0.768 with LOEUF, 0.778 with shet-ABC). b, shet vs LOEUF results for 973 genes with ≤5 expected LOFs. 5 genes are highlighted for short coding sequence length (CDS), that are constrained according to shet (both mean>0.073 and lower bound>0.021) and unconstrained according to LOEUF. LOEUF is an alternate measure of pLOF-based gene constraint and ranges from 0 to around 2; a value < 0.35 is considered constrained. Error bars (grey lines) around shet denote 95% highest posterior density.
Extended Data Fig. 5
Extended Data Fig. 5. Determination of the MAPS score threshold to define constrained regions and SAVs.
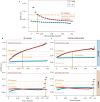
ac, To systematically evaluate the deleteriousness of missense variants at various MTR scores, we compared MAPS scores across MTR (a) and splice score (b,c) thresholds. a, MTR was divided from 5% to 100% with step size of 5% (lower MTR percentile is more constrained). For each MTR percentile threshold, we divided variants into two sets: variants that pass the percentile threshold (red dots), and variants greater than the percentile (blue dots). The y axis represents MAPS score for each set of variants; the x-axis shows the tested MTR percentile threshold. Error bars represent standard deviation around the mean proportion of singletons per bin. A total of 68,636,473 variants were included in this analysis. b,c, Schematic of MAPS-derived filters for SpliceAI and MMSplice for all variants (b) and coding nonSS variants (c), respectively. A list of prediction score thresholds were set up for both SpliceAI and MMSplice, ranging from 0.1 to 0.99, with step size of 0.02. For each threshold, we divided variants into two sets: the set of variants that passed the threshold, represented as red dots, and the set of variants that failed the filter, represented as blue dots. The y axis represents MAPS score for each set of variants; the x-axis shows the tested score threshold. All MAPS scores were calculated based on the set of variants that pass QC metrics and have splice prediction scores in RGC-ME unrelated samples. Error bars represent standard deviation around the mean proportion of singletons per bin. For all variants (b), the total number of variants were n = 12,886,467 and 20,604,651 for SpliceAI and MMSplice, respectively. For coding nonSS variants (c), n = 5,468,779 and 4,013,820 for SpliceAI and MMSplice, respectively.
Extended Data Fig. 6
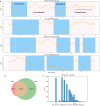
Extended Data Fig. 6. MTR-based segmentation and comparison of constrained regions in 2,832 genes that have constrained regions in both MTR and MPC (matched on transcript IDs).
a, Dashed line indicates the top-15-percentile exome-wide MTR threshold used for MTR-based segmentation (0.841). Blue and red regions represent MTR-constrained and unconstrained regions, respectively. b, Constrained MTR regions that overlap with MPC segments. 80% of MTR-constrained regions (represented by the combined area of red and yellow) overlap with MPC-constrained segments (yellow), whereas 40% of constrained MPC segments (represented by the combined area of green and yellow) are included in the intersection (yellow). The numbers indicated on the Venn diagram represent number of amino acids. Aside from 2,832 genes that had both MTR- and MPC-constrained regions, an additional 297 genes had only MPC-constrained segments, and 9,514 genes had only MTR-constrained regions (not included in the Venn diagram). c, Distribution of the fold change of the number of MTR-constrained regions and constrained MPC segments (γ0.6) per gene. Dashed line indicates the median fold change of 3. Data shown is for the 2,832 genes that have constrained region annotations both in MTR and MPC segments.
Extended Data Fig. 7
Extended Data Fig. 7. Constrained MTR regions are enriched in ClinVar pathogenic variants and shorter than LOF-specific constrained genes.
a, Odds ratios (points) comparing enrichment of pathogenic versus benign ClinVar variants (solid line) and de novo variants in cases versus controls (dotted line) in MTR-constrained regions. Error bars represent 95% CIs (Fisher’s exact test). The total number of variants in each comparison are shown in b for the MTR-percentile cut-offs highlighted in yellow. In total, 5,818 case and 553 control variants were used in the de novo analysis and 7,944 pathogenic and 11,993 benign variants were used in the ClinVar analysis. b, Table of case and control variants in constrained and unconstrained regions to compute statistical tests for ClinVar (“CV”) and de novo (“DN”) variants across 5 different MTR-percentile thresholds (13-17%, yellow boxed region in a). Statistics include hypergeometric tests (p-value for enrichment of case and control variants in constrained regions) and odds ratios comparing enrichment of case vs control in constrained regions. The background rate of constrained regions among variants in the comparison set represented by “% constrained background”. c, CDS length comparison between 1,482 missense-specific constrained genes (defined where >15% of gene is in the top 15 percentile of MTR, based on one-sided binomial tests with π0 = 0.15, p < 0.05, Bonferroni corrected) and 1,424 LOF-specific constrained genes with shet score <0.073. Log10 CDS length for all 19,644 genes (canonical transcripts) shown in the grey curve. The missense-specific constrained genes had significantly shorter CDS length than LOF-specific constrained genes (p = 2.9 × 10−40, two-sided Wilcoxon test).
Extended Data Fig. 8
Extended Data Fig. 8. Characteristics of predicted deleterious SAVs.
a, Summary of unique variant-transcript pairs of predicted deleterious SAVs in different functional categories using MAPS-defined prediction score thresholds for SpliceAI and MMSplice. Percents are computed out of total variants in each effect class. b, Distribution of different functional categories of predicted deleterious SAVs. (HC: High confidence, LC: Low confidence. These annotation tags are derived from LOFTEE). c, Empirical validation of MAPS-predicted deleterious coding nonSS SAVs: enrichment of predicted coding nonSS deleterious SAVs in experimentally validated SDVs compared to non-SDVs. Odds ratios (points) were derived using two-sided Fisher’s exact test and error bars show 95% CIs. A total of n = 17,395 variants, of which 147 SAVs were validated SDVs, were included. d,e, Fraction of predicted deleterious SAVs (d) and coding nonSS SAVs (e) that were validated as SDVs by any of the three splice reporter assays.
Extended Data Fig. 9
Extended Data Fig. 9. ClinVar variant counts.
a, Counts of autosomal pathogenic ClinVar high-confidence variants (two stars or more) observed in large-scale exome sequencing studies, including RGC-ME, gnomAD (exomes, v2.1.1), and ExAC, are indicated on the top of each bar. The left axis indicates the total coverage of ClinVar pathogenic variants represented in each dataset. b, Bars and points both depict the mean per cent difference of per-individual counts in ClinVar categories (pathogenic 0+, 1+, 2+, VUS+CI) across continental ancestries using all unrelated samples, with respect to EUR (e.g. [countAFR – countEUR]/countAFR × 100). CV0, 1, and 2 refer to ClinVar pathogenic star rating 0+, 1+, and 2+ categories, respectively. VUS/CI combines variants annotated as “variants of unknown significance” and “conflicting interpretations”. All per-individual counts in non-EUR were significantly different compared to counts in EUR (e.g. per-individual counts of ClinVar 2+ variants in AFR were 0.576 [0.567, 0.585] lower than those in EUR) except for ClinVar 0+ counts in IAM compared with EUR (t-tests with Bonferroni correction). Error bars show 95% CI of mean per cent difference from t-test. c, Per-individual count of VUSs and conflicting information (CI, left); and pathogenic variants (right) in RGC-ME for all unrelated samples. The lower bound, centre and upper bound of each box plot represents the 25, 50, and 75 percentiles of the distributions of counts. Points represent outliers, and whisker minima and maxima represent the smallest and largest points 1.5-times beyond the interquartile range. For b,c, a total of 749,584 unrelated individuals were included across 4 ancestries and individuals were assigned discrete ancestries based on overall FSA probabilities >50%; see Supplementary Table 1a for sample size breakdowns. The x-axis indicates ClinVar star rating which is a measure of the confidence of the annotation (pathogenic/benign).

References

    1. Baxter, S. M. et al. Centers for Mendelian Genomics: a decade of facilitating gene discovery. Genet. Med.24, 784–797 (2022). - PMC - PubMed
    1. Musunuru, K. et al. Exome sequencing, ANGPTL3 mutations, and familial combined hypolipidemia. N. Engl. J. Med.363, 2220–2227 (2010). - PMC - PubMed
    1. Soutar, A. K. & Naoumova, R. P. Mechanisms of disease: genetic causes of familial hypercholesterolemia. Nat. Clin. Pract. Cardiovasc. Med.4, 214–225 (2007). - PubMed
    1. Karczewski, K. J. et al. The mutational constraint spectrum quantified from variation in 141,456 humans. Nature581, 434–443 (2020). - PMC - PubMed
    1. Lek, M. et al. Analysis of protein-coding genetic variation in 60,706 humans. Nature536, 285–291 (2016). - PMC - PubMed