. 2024 Aug 12;52(14):8466-8482.
doi: 10.1093/nar/gkae387.

Arabidopsis AGO1 N-terminal extension acts as an essential hub for PRMT5 interaction and post-translational modifications

Affiliations

Arabidopsis AGO1 N-terminal extension acts as an essential hub for PRMT5 interaction and post-translational modifications

Andrea Martín-Merchán et al. Nucleic Acids Res. .

Abstract

Plant ARGONAUTE (AGO) proteins play pivotal roles regulating gene expression through small RNA (sRNA) -guided mechanisms. Among the 10 AGO proteins in Arabidopsis thaliana, AGO1 stands out as the main effector of post-transcriptional gene silencing. Intriguingly, a specific region of AGO1, its N-terminal extension (NTE), has garnered attention in recent studies due to its involvement in diverse regulatory functions, including subcellular localization, sRNA loading and interactions with regulatory factors. In the field of post-translational modifications (PTMs), little is known about arginine methylation in Arabidopsis AGOs. In this study, we show that NTE of AGO1 (NTEAGO1) undergoes symmetric arginine dimethylation at specific residues. Moreover, NTEAGO1 interacts with the methyltransferase PRMT5, which catalyzes its methylation. Notably, we observed that the lack of symmetric dimethylarginine has no discernible impact on AGO1's subcellular localization or miRNA loading capabilities. However, the absence of PRMT5 significantly alters the loading of a subgroup of sRNAs into AGO1 and reshapes the NTEAGO1 interactome. Importantly, our research shows that symmetric arginine dimethylation of NTEs is a common process among Arabidopsis AGOs, with AGO1, AGO2, AGO3 and AGO5 undergoing this PTM. Overall, this work deepens our understanding of PTMs in the intricate landscape of RNA-associated gene regulation.


Figures

Graphical Abstract
Graphical Abstract
Figure 1.
Figure 1.
Arginine methylation of NTEAGO1 in Arabidopsis thaliana. (A) Schematic representation of putative arginine methylation sites predicted for AGO1. Globular domains are shown in grey, NTE in yellow and putative methylated arginine residues in blue. (B) Modelling views of AGO1 structure predicted using AlphaFold2. Globular domains are shown in grey cartoon, NTE in yellow cartoon and ribbon, and the putative methylated arginine residues in blue sticks. (C-E) Western blot assays showing methylation status of endogenous and transgenic versions of AGO1. Upon normalization of plant extracts by total content of protein, endogenous AGO1 was immunoprecipitated with anti-AGO1 antibody (C) and transgenic versions with anti-GFP magnetic agarose beads (D, E). Input and IP fractions were incubated with the corresponding antibody. IP fractions were also incubated with anti-sDMA antibody to test methylation status. Membranes containing input fractions were afterwards stained with Coomassie to serve as a loading control. All extracts were obtained from wild-type background (Col-0) plants. In (D), (-) refers to non-transgenic Col-0 plants. Transgenic versions of AGO1 fused to GFP or GFPGUS were cloned under the endogenous AGO1 promoter. AGO1_ΔNTE: AGO1 lacking the NTE; NTEAGO1: wild type NTEAGO1; NTEmAGO1: NTEAGO1 in which predicted R30, R34, R48, R59, R62, R83, R85, R94 and R101 putative methylated arginine residues were replaced by alanine residues.
Figure 2.
Figure 2.
PRMT5 interacts and induces NTEAGO1 methylation. (A) Protein abundance estimates and sequence coverages of PRMT5 and AGO1 detected by mass spectrometry analysis of immunoprecipitated AGO1 from Arabidopsis plants expressing pAGO1:GFP-AGO1. Non-transgenic Arabidopsis plants have been used as a control. (B) Confocal images of Bimolecular Fluorescence Complementation (BiFC) assays showing the interaction between AGO1 and PRMT5 in N. benthamiana leaf cells. AGO1 versions and PRMT5 were tagged with the N-terminal (NtYFP-) or C-terminal (CtYFP-) parts of YFP, respectively, and expressed under the Cauliflower mosaic virus 35S promoter. H2B-mCherry reporter was co-infiltrated as nuclear marker. The upper panels show the YFP channel. The middle and lower panels show YFP and mChFP merged channels (see also Supplementary Figure S2B). All images were taken three days after infiltration. Scale bars correspond to 25 μm. (C) Western blot assays showing expression levels of the tagged proteins. After SDS-PAGE, protein extracts from N. benthamiana’ leaves used in the BiFC experiment shown in panel B were transferred to a PDVF membrane and incubated with anti-NtYFP or anti-CtYFP antibodies to confirm the expression of the Nt- and Ct- YFP tagged versions. Due to the no specificity of anti-NtYFP antibody at low molecular weight range proteins, the anti-AGO1 antibody (which recognizes the NTE of AGO1) was used to detect the expression of NtYFP-NTEAGO1. Plants infiltrated with MES buffer were used as controls. Membranes were afterwards stained with Coomassie to serve as loading controls. (DE) Western blot assays showing methylation status of endogenous AGO1 and transgenic NTEAGO1 in wild-type background (Col-0) and prmt5 (skb1-1) mutant background plants. Upon normalization of plant extracts by the total content of protein, endogenous AGO1 was immunoprecipitated with anti-AGO1 (D) while transgenic NTEAGO1 with anti-GFP magnetic agarose beads (E). Input and IP fractions were incubated with the corresponding antibody, and the IP fraction was also incubated with anti-sDMA antibody to test methylation status. Membranes containing input fractions were afterwards stained with Coomassie to serve as loading controls. AGO1_ΔNTE: AGO1 lacking the NTE; NTEAGO1: wild type NTEAGO1. NTEAGO1 fused to GFPGUS was cloned under the endogenous AGO1 promoter.
Figure 3.
Figure 3.
Identification of specific PRMT5-mediated methylation sites in NTEAGO1. (A) Schematic representation of the strategy employed to analyse arginine methylation sites in NTEAGO1 by mass spectrometry (MS). The coverage of NTEAGO1 amino acid sequence detected is highlighted in green. Putative methylated arginine residues are highlighted in blue. (B) Table summarizing the methylation status of the different arginine residues (R6, R30, R34, R48, R59, R62, R83, R85, R94 and R101) found by MS analysis of immunoprecipitated NTEAGO1 after trypsin (wild-type background (Col-0) and prmt5 background (skb1-1)) or chymotrypsin (Col-0) treatment. MMA: arginine monomethylation; DMA: arginine dimethylation; No met: no-methylation detected; N.D.: no coverage of arginine detected (see Supplementary Figure S3C for trypsin cleavage sites detected). (C) Schematic representation of the methylation status of arginine residues detected by MS. Green: not methylated in Col-0, purple: not methylated/not detected in skb1-1, orange: methylated in skb1-1. (D) AGO1 regions holding methylatable arginine residues were locally aligned with AGO1 orthologs from other plant species using MEGA with MUSCLE algorithm. Conservation is represented by a colour gradient (from highly conserved residues in blue to poorly conserved in white). A. thaliana: Arabidopsis thaliana; A. lyrate: Arabidopsis lyrate; C. sinensis: Citrus sinensis; G. max: Glycine max; G. raimondii: Gossypium raimondii; O. sativa: Oryza sativa; P. trichocarpa: Populus trichocarpa; Z. mays: Zea mays. (E) Schematic representation showing the length of the different NTEAGO1 fragments used in sections F-G: NTEAGO1 (M1-A196), NTE-L (M1-Q111), NTE-R (Q111-A196), NTE-L1 (M1-Q55), NTE-L2 (Q55-Q111), NTE-L2a (Q55-Q81), and NTE-L2b (Q81-Q111). (FG) Western blot assays showing methylation status of specific regions of NTEAGO1. After normalization of plant extracts by the total content of protein, the seven versions of the NTEAGO1 fused to GFPGUS were incubated and immunoprecipitated with anti-GFP magnetic agarose beads. Input and IP fractions were incubated with anti-GFP antibody, and the IP fractions were also incubated with anti-sDMA antibody to check methylation status. Membrane containing input fractions was afterwards stained with Coomassie to serve as the loading control. All transgenic versions of NTEAGO1-GFPGUS were cloned under the endogenous AGO1 promoter and expressed in Col-0 plants.
Figure 4.
Figure 4.
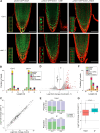
Implication of PRMT5 in AGO1’s subcellular localization and sRNA loading. (A) Confocal images of wild-type background (Col-0) and prmt5 (skb1-1) mutant background plants showing AGO1 subcellular localization. Roots from transgenic lines expressing pAGO1:GFP-AGO1 were analysed under normal conditions and Leptomycin B (LMB+) treatment (left and middle panels, respectively). Roots from transgenic lines expressing pAGO1:GFP-AGO1_mNES under normal conditions are also shown (right panels). Bottom-left insets show magnification of 4–6 epidermal cells (for whole photos see Supplementary Figure S4B). Propidium iodide fluorescence is shown in red. Scale bars correspond to 50 μm. (B–G) Analysis of the RNA sequencing data obtained from input and AGO1 IP fractions from Col-0 and skb1-1 mutant plants. Three biological replicates of each genotype were included in the analysis. (B) Size distribution of total sRNAs extracted and sequenced from IP fractions. Colours represent the identity (genomic source) of the sRNAs: miRNAs (green), tasiRNAs (yellow), protein-coding genes (orange), transposons/repeats (blue), non-annotated regions (grey) and other ncRNA (including transfer/ribosomal/small nuclear/small nucleolar RNAs) (pink). (C) Scatter plots comparing the log2 of the means of three biological replicates of miRNA co-immunoprecipitated with AGO1. The central line represents a log2 fold change of 0, and the dashed lines correspond with log2 fold change >1.5 and <�1.5. Magenta dots represent the miRNAs enriched in Col-0 plants, and aquamarine dots represent the miRNAs enriched in skb1-1 mutant plants. (D) Volcano plot representing the sRNAs differentially loaded in AGO1 in Col-0 and skb1-1 mutant plants. Each dot corresponds with a window of 100nt generated along the Arabidopsis genome. Dots highlighted in red are windows containing RDR6-dependent sRNA. The horizontal dashed line represents the threshold of the adjusted P-value (0.05) and the vertical, the log2 fold change of 1.5. (E) Proportion of 21nt and 22nt miRNA and siRNA sequenced from input and IP fractions. P-adj values shown were calculated using t-test. (F) Size distribution of the sRNA enriched in Col-0 (depleted in skb1-1 mutant plants). Colours represent the identity of sRNAs as in section B. (G) Boxplot representing the log2 fold change in the skb1-1 mutant compared to Col-0 plants of the sRNA RDR6-dependent that were found to be depleted in IP fractions of skb1-1 mutant plants. On the left, in pink are plotted the values of log2 fold change of windows from input fractions. On the right, in blue the log2 fold change of the same windows from IP fractions. Wilcoxon test was applied, and the adjusted P-value is shown above the boxes.
Figure 5.
Figure 5.
PRMT5-driven remodelling of NTEAGO1 interactome. (A) Western blot assay of input and AGO1 IP fractions showing the interaction between AGO1 and TSN1/2. After normalization of plant extracts obtained from wild-type background (Col-0) and tsn1/2 mutant plants by the total content of protein, the endogenous AGO1 was immunoprecipitated with anti-AGO1 antibody. Input and IP fractions were incubated with anti-AGO1 antibody. IP fraction was also incubated with an anti-TSN1/2 serum to check the interaction between both proteins. Membrane containing input fractions was afterwards stained with Coomassie to serve as loading control. (B) Volcano plot representing proteins that were found enriched interacting with NTEAGO1-GFPGUS in prmt5 (skb1-1) mutant background plants (in purple) compared to NTEAGO1-GFPGUS in Col-0 (in blue) plants. The y and x axes display log10 values from adjusted P values and log2 fold changes, respectively. The horizontal dashed line represents the threshold of −Log P of 1.3 and the vertical, the log2 fold change of 1.5. For this analysis, extracts from Col-0 and skb1-1 mutant background plants expressing pAGO1: NTEAGO1-GFPGUS were normalized by total content of protein and NTEAGO1-GFPGUS was immunoprecipitated with anti-GFP magnetic agarose beads. Three biological replicates of each genotype were included in the analysis. (C) Bar graph showing enrichment in specific protein clusters after analysing interactors co-immunoprecipitated with NTEAGO1-GFPGUS in skb1-1 mutant background plants compared with NTEAGO1-GFPGUS in Col-0. A log2 fold change of 6 was chosen for ON/OFF proteins (i.e. not present in co-IPs using Col-0 extracts).
Figure 6.
Figure 6.
sDMA as a common post-translational modification in Arabidopsis AGO proteins. (A) Schematic representation of putative arginine methylation sites predicted for AGO2, AGO3 and AGO5. Globular domains are shown in grey, NTEAGOs in yellow, and putative methylated arginine residues in blue. (B) Modelling views of AGO2, AGO3 and AGO5 structures predicted using AlphaFold2. Globular domains are shown in grey cartoon, NTEAGOs in yellow cartoon and ribbon, and the putative methylated arginine residues in blue sticks. (C) Western blot assays showing methylation status of transgenic NTEs versions of the different AGOs. Leaves from N. benthamiana were processed three days after infiltration, and upon normalization by total content of protein, the different NTEs were immunoprecipitated with anti-GFP magnetic agarose beads. IP fractions were incubated with anti-GFP and anti-sDMA antibody to check transgenic protein expression and methylation status, respectively. Membrane was developed at short (Exp.t1) and long (Exp.t2) exposure times. All NTEs were fused to GFPGUS and expressed under the Cauliflower mosaic virus 35S promoter in N. benthamiana. Expression of GFPGUS and NTEAGO4-GFPGUS were used as negative controls. (D, E) Western blot assays showing methylation status of endogenous AGO2 and AGO5 in wild-type background (Col-0), or transgenic NTEAGO2 and NTEAGO3 in Arabidopsis plants. Upon normalization of plant extracts by total content of protein, endogenous AGO2 and AGO5 were immunoprecipitated with the specified anti-AGO antibody (D), while transgenic versions, with anti-GFP magnetic agarose beads (E). IP fractions were incubated with the corresponding antibody, and with anti-sDMA antibody to test methylation status. Transgenic versions of NTEAGO2 and NTEAGO3 fused to GFPGUS were cloned under their respective endogenous promoter. Membrane was developed at short (Exp.t1) and long (Exp.t2) exposure times.

References

    1. Bologna N.G., Voinnet O.. The diversity, biogenesis, and activities of endogenous silencing small RNAs in Arabidopsis. Annu. Rev. Plant Biol. 2014; 65:473–503. - PubMed
    1. Zhan J., Meyers B.C.. Plant small RNAs: their biogenesis, regulatory roles, and functions. Annu. Rev. Plant Biol. 2023; 74:21–51. - PubMed
    1. Fang X., Qi Y.. RNAi in plants: an argonaute-centered view. Plant Cell. 2016; 28:272–285. - PMC - PubMed
    1. Zhang H., Xia R., Meyers B.C., Walbot V.. Evolution, functions, and mysteries of plant ARGONAUTE proteins. Curr. Opin. Plant Biol. 2015; 27:84–90. - PubMed
    1. Nakanishi K. Anatomy of four human Argonaute proteins. Nucleic Acids Res. 2022; 50:6618–6638. - PMC - PubMed

MeSH terms