. 2024 Nov;8(11):1453-1468.
doi: 10.1038/s41551-024-01214-6. Epub 2024 May 20.

Antibody-displaying extracellular vesicles for targeted cancer therapy

Affiliations

Antibody-displaying extracellular vesicles for targeted cancer therapy

Oscar P B Wiklander et al. Nat Biomed Eng. 2024 Nov.

Abstract

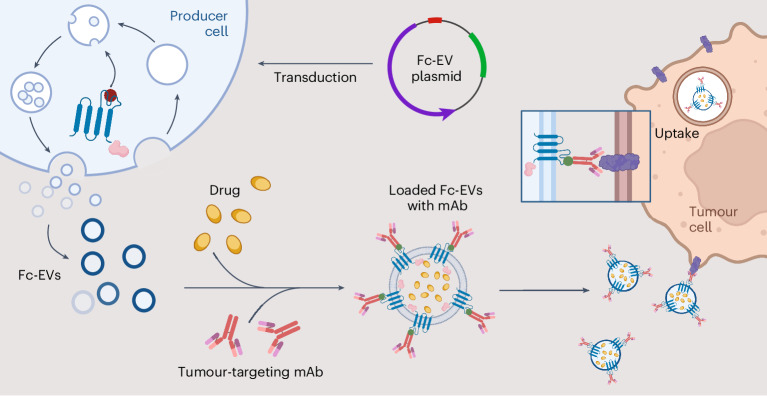
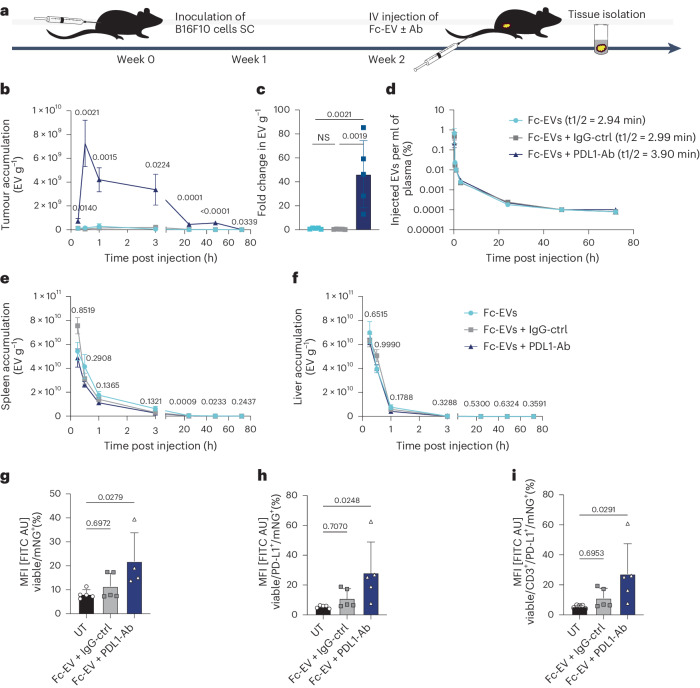
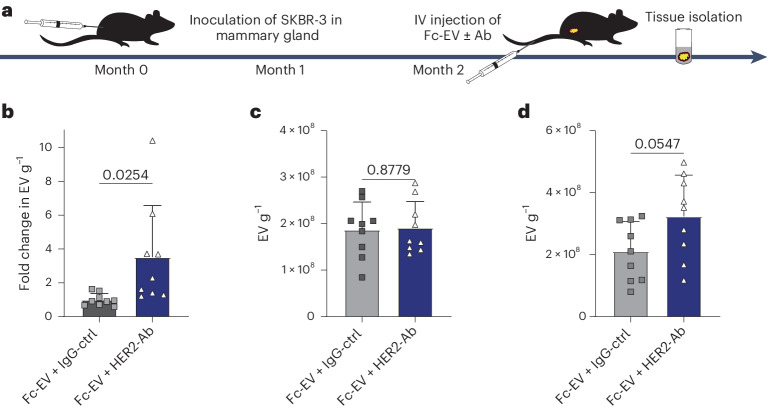
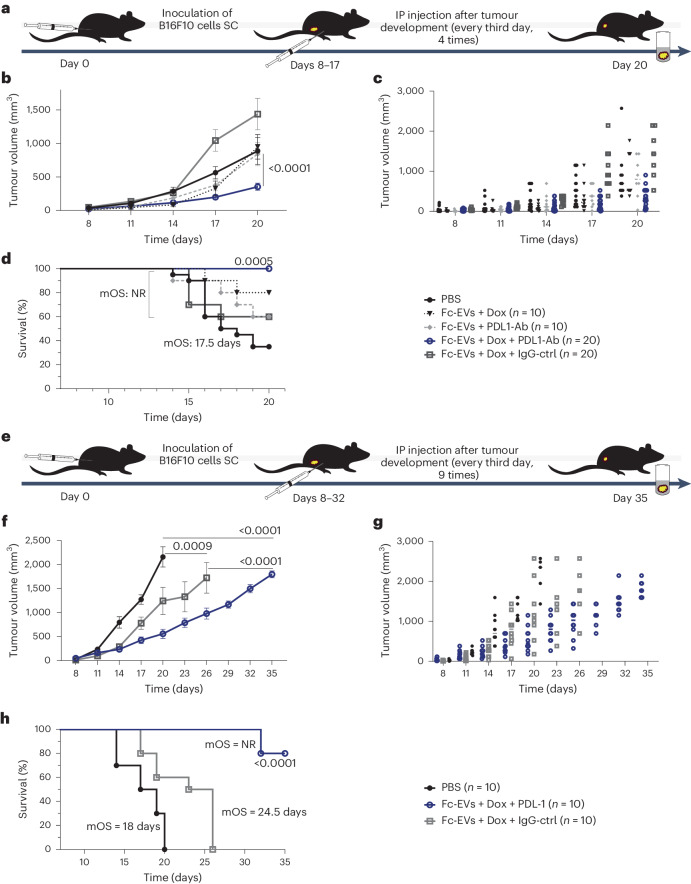
Extracellular vesicles (EVs) function as natural delivery vectors and mediators of biological signals across tissues. Here, by leveraging these functionalities, we show that EVs decorated with an antibody-binding moiety specific for the fragment crystallizable (Fc) domain can be used as a modular delivery system for targeted cancer therapy. The Fc-EVs can be decorated with different types of immunoglobulin G antibody and thus be targeted to virtually any tissue of interest. Following optimization of the engineered EVs by screening Fc-binding and EV-sorting moieties, we show the targeting of EVs to cancer cells displaying the human epidermal receptor 2 or the programmed-death ligand 1, as well as lower tumour burden and extended survival of mice with subcutaneous melanoma tumours when systemically injected with EVs displaying an antibody for the programmed-death ligand 1 and loaded with the chemotherapeutic doxorubicin. EVs with Fc-binding domains may be adapted to display other Fc-fused proteins, bispecific antibodies and antibody-drug conjugates.


Conflict of interest statement

Competing interests: S.E.A. is a founder of and a consultant for Evox Therapeutics. D.G., J.Z.N. and A.G. are consultants for Evox Therapeutics. O.P.B.W., D.G., J.Z.N., A.G. and S.E.A. have stock interest in Evox Therapeutics. H.S. and A.L. are employees of Evox Therapeutics. The other authors declare no competing interests.

Figures

Fig. 1
Fig. 1. Engineering cells to produce EVs decorated with an antibody-binding moiety specific for the Fc domain.
The producer cells are transduced with a construct to produce EVs that display an Fc-binding domain (Fc-EVs) that can be decorated with different types of antibody (mAb), loaded with therapeutic cargo (drug) and targeted to virtually any tissue of interest, such as cancer cells. Created with BioRender.com.
Fig. 2
Fig. 2. Screening of EV-sorting proteins and Fc-binding domains.
a, Nine EV-sorting domains and nine Fc-binding domains used in different combinations, as illustrated by the examples in the centre, for the screen to optimize Fc-EVs. b, IFC of transient transfection of HEK293T cells with nine different EVs sorting domains, intraluminally fused via the N- or C-terminal to the fluorescent protein mNG (TNFR only have one intraluminal terminus, C-terminus). Wt, wild type. c, IFC comparison of engineered mNG EVs from cells in both configurations based on events in conditioned media. d, IFC analysis of the expression of the Fc binder based on the mean fluorescence intensity (MFI) of mNG for the top candidate combinations of different Fc binders (z, 4z, protein A) with different EVs sorting domains (CD63, CD9, CD81, TNFR). e, IFC analysis of the expression of the Fc binder based on the percentage of double positive (APC Abs binding mNG-Fc-EVs) for the top candidate combinations of different Fc binders (z, 4z, protein A) with different EV-sorting domains (CD63, CD9, CD81, TNFR). Other combinations can be found in Supplementary Fig. 2. Illustrations created with BioRender.com. GAPDH, first 148 amino acids (aa) of glyceraldehyde-3-phosphate dehydrogenase; ARRDC1, arrestin domain-containing protein; ApoE lipid binding sites (v1 corresponds to 355 aa, v2 corresponds to 1,009 aa); z domain, synthetic Fc region-binding domain originated from the B domain of protein A; 4z, four repetitive z domains; MRP4, multidrug resistance protein 4; PIP, prolactin-induced protein; hFcγr, human Fc gamma receptor. Panels d and e are shown as mean ± s.d. n = 3 biological replicates. Statistical significance was calculated using two-way ANOVA with Dunnett’s post-test compared with each value; P values are indicated above the plots of d and e.
Fig. 3
Fig. 3. Fc-EV characterization.
a, NTA showing similar size distribution of Fc-EVs and control (ctrl-EVs) with and without antibody (REA(S)-APC, human IgG1, Ab). b, Fluorescence reading of 0.5 ml fractions from SEC of mNG representing EV, and APC representing Ab. Upper panel: association of Fc-EVs and Ab at EV expected fractions 3–6; lower panel: no association in the EV fractions between ctrl-EVs and Ab. a.u., arbitrary units. c, IFC data including example event images that show binding of APC-labelled human IgG isotype control antibodies to mNG-Fc-EVs but not to mNG-ctrl-EVs. d, Binding affinity of IgG subtypes to Fc-EVs based on binding of mNG+ Fc-EVs with PE+ IgG-subtypes (expressed as percentage of double positive (DP) (PE and mNG) over mNG). APC mean fluorescence intensities following staining of Fc-EVs with increasing doses of human isotype control IgG antibodies. e, Fluorescence reading of fractions from SEC. Upper panel: Fc-EVs alone; lower panel: association of Fc-EVs and Ab at EV expected fractions. f, Nanoimager microscopy images of selected fractions from SEC (e), showing green fluorescent EVs (without detectable red antibody) only for the ctrl-EVs, but double positivity (yellow) for the Fc-EVs and Ab. gi, Quantification of antibodies per EVs was performed using the SPP. Histogram of number of hIgG to Fc-EVs (g), number of mIgG to Fc-EVs (h) and number of hIgG to ctrl-EVs (i).
Fig. 4
Fig. 4. Fc-EV targeting using antibodies.
a, Flow cytometry measurement of uptake by MFI of mNG+ EVs (Fc-EVs versus ctrl-EVs versus no EVs) in HER2 positive breast cancer cells (SKBR-3 cells) when incubated with HER2-Ab (trastuzumab), control-Ab (IgG ctrl) or no Ab, showing significant increase in uptake of Fc-EVs by trastuzumab. b, Flow cytometry measurement of uptake (by MFI) of mNG+ Fc-EVs decorated with the PD-L1-Ab atezolizumab in PD-L1 expression stimulated (IFNγ) or unstimulated malignant melanoma (B16F10) cells. c, Fluorescence microscopy images of B16F10 cells stained with DAPI (blue), untreated (UT) or treated with mNG+ (green) Fc-EVs alone or with the PD-L1-Ab atezolizumab, showing increased uptake of the Fc-EVs when decorated with PD-L1-Ab. Panels a and b are shown as mean ± s.d. n = 3 biological replicates. Statistical significance was calculated using one-way (b) or two-way (a) ANOVA with Tukey’s post-test compared with each value; P values are indicated above the plots throughout.
Fig. 5
Fig. 5. Fc-EV tumour targeting using PD-L1-Ab.
IV injection of Fc-EVs with PD-L1-Ab (atezolizumab, Fc-EV + PD-L1-Ab), control-Ab (Fc-EV + IgG-ctrl) or no Ab (Fc-EV) in malignant melanoma (B16F10) tumour-bearing mice. a, The experimental set-up with inoculation of B16F10 cells followed by tumour formation for 2 weeks before IV injection of Fc-EVs (nLuc+ Fc-EVs for bf, mNG+ Fc-EVs for gi) with or without Ab, followed by tissue or blood collection. SC, subcutaneously. b, Detected EVs (based on luminescence) per gram tumour tissue at indicated time points post injection. c, Fold change in detected EVs in tumour at 30 min post injection. d, Percentage of injected EV dose found in plasma at different time points with indicated half-life based on one phase decay. e,f, Detected EVs per gram spleen (e) or liver (f), at indicated time points post injection. gi, Flow cytometry analysis of single-cell suspensions of tumour tissue following IV injection of mNG+ Fc-EV with PD-L1-Ab or control-Ab. g, Percentage of tumour cells that have taken up mNG+ Fc-EVs, based on viable cells from single-cell suspension of the tumour that are mNG+. h, Percentage of PD-L1+ tumour cells that have taken up mNG+ Fc-EVs. i, Percentage of PD-L1+ T cells (CD3+) in tumour tissue that have taken up mNG+ Fc-EVs. All data are shown as mean ± s.d. n = 5 biological replicates. Statistical significance was calculated using one-way ANOVA with Tukey’s (bf) or Dunnett’s (gi) post-test compared with each value; P values are indicated above the plots throughout.
Fig. 6
Fig. 6. Fc-EV tumour targeting using HER2-Ab.
IV injection of Fc-EVs with HER2-Ab (trastuzumab, Fc-EV + HER2-Ab) compared to control-Ab (Fc-EV + IgG-ctrl) in HER2+ breast cancer (SKBR-3) tumour-bearing Swiss nude mice. a, The experimental set-up with inoculation of SKBR-3 cells followed by tumour formation for 2 months before IV injection of nLuc+ Fc-EVs with Abs, followed by tissue collection 30 min post injection. b, Fold change in detected EVs (based on luminescence) per gram tumour tissue compared to Fc-EV + IgG-ctrl. c,d, Accumulation of Fc-EV + HER2-Ab (based on luminescence) compared to Fc-EV + IgG-ctrl per gram spleen (c) and liver (d). All data are shown as mean ± s.d. n = 10 mice. Statistical significance was calculated using two-tailed unpaired t-test analysis compared with each value; P values are indicated above the plots throughout.
Fig. 7
Fig. 7. Tumour treatment with Dox-loaded Fc-EVs displaying PD-L1-Ab.
a, The experimental set-up. Mice were inoculated with malignant melanoma (B16F10) cells on day 0. After tumour formation, mice were treated every third day for four cycles until day 20. d, day(s). bd, Tumour volume (b, average volume and c, individual tumour volume of live mice) and survival (d) over time for mice treated with combinations consisting of Dox-loaded Fc-EVs (Fc-EVs + Dox) without Ab or with PD-L1-Ab (atezolizumab, Fc-EVs + Dox + PD-L1-Ab) or with control-Ab (Fc-EVs + Dox + IgG-ctrl) compared to Fc-EVs with PD-L1-Ab without Dox (Fc-EVs + PD-L1-Ab) or mock treatment (PBS), displaying significant improvement only for Fc-EVs + Dox + PD-L1-Ab. Mean overall survival (mOS) was not reached (NR) for any group except PBS. e, The set-up for prolonged experiment. After tumour formation, mice were treated every third day for nine cycles until day 35. f,g, Tumour volume (f, average volume and g, individual tumour volume of live mice) over time for live mice treated with Dox-loaded Fc-EVs with PD-L1-Ab (Fc-EVs + Dox + PD-L1-Ab) or control-Ab (Fc-EVs + Dox + IgG-ctrl) compared to mock treatment (PBS), displaying significant improvement for Fc-EVs + Dox + PD-L1-Ab. h, Survival over time for the same treatment as in f and g, showing mOS for the different treatment groups, which was not reached on day 35 for Fc-EVs + Dox + PD-L1-Ab. All data are shown as mean ± s.d. n = 10–20 mice (as indicated per group). Statistical significance was calculated using two-way ANOVA with Dunnett’s (b and c) or Tukey’s (f) post-test or Mantel–Cox test (d and h) compared with each value; P values are indicated above the plots throughout.

References

    1. Pardoll, D. M. The blockade of immune checkpoints in cancer immunotherapy. Nat. Rev. Cancer12, 252–264 (2012). - PMC - PubMed
    1. Borcoman, E. et al. Novel patterns of response under immunotherapy. Ann. Oncol.30, 385–396 (2019). - PubMed
    1. Couch, Y. et al. A brief history of nearly EV-erything—the rise and rise of extracellular vesicles. J. Extracell. Vesicles10, e12144 (2021). - PMC - PubMed
    1. Wiklander, O. P. B. et al. Advances in therapeutic applications of extracellular vesicles. Sci. Transl. Med.11, eaav8521 (2019). - PMC - PubMed
    1. Kooijmans, S. A. A., de Jong, O. G. & Schiffelers, R. M. Exploring interactions between extracellular vesicles and cells for innovative drug delivery system design. Adv. Drug Deliv. Rev.173, 252–278 (2021). - PubMed

Publication types