. 2024 May 20;15(1):3816.
doi: 10.1038/s41467-024-48055-0.

Fatal COVID-19 pulmonary disease involves ferroptosis

Affiliations

Fatal COVID-19 pulmonary disease involves ferroptosis

Baiyu Qiu et al. Nat Commun. .

Abstract

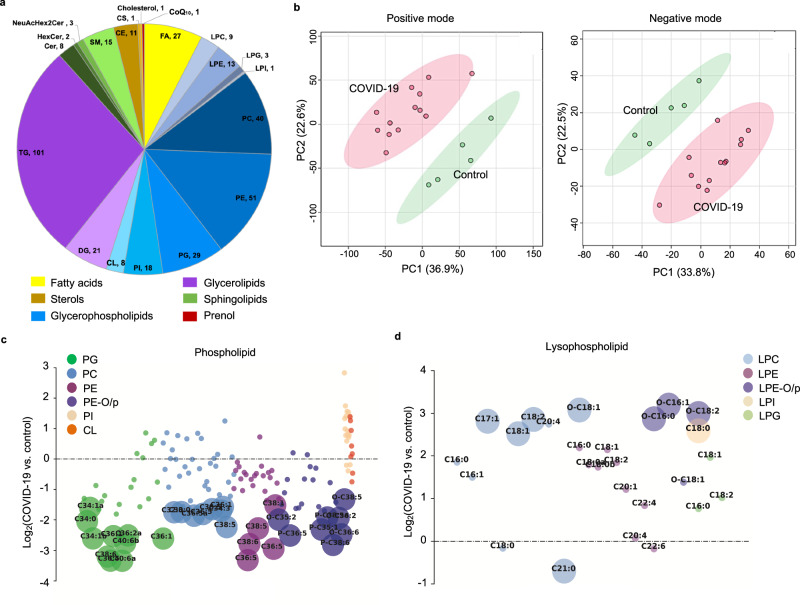
SARS-CoV-2 infection causes severe pulmonary manifestations, with poorly understood mechanisms and limited treatment options. Hyperferritinemia and disrupted lung iron homeostasis in COVID-19 patients imply that ferroptosis, an iron-dependent cell death, may occur. Immunostaining and lipidomic analysis in COVID-19 lung autopsies reveal increases in ferroptosis markers, including transferrin receptor 1 and malondialdehyde accumulation in fatal cases. COVID-19 lungs display dysregulation of lipids involved in metabolism and ferroptosis. We find increased ferritin light chain associated with severe COVID-19 lung pathology. Iron overload promotes ferroptosis in both primary cells and cancerous lung epithelial cells. In addition, ferroptosis markers strongly correlate with lung injury severity in a COVID-19 lung disease model using male Syrian hamsters. These results reveal a role for ferroptosis in COVID-19 pulmonary disease; pharmacological ferroptosis inhibition may serve as an adjuvant therapy to prevent lung damage during SARS-CoV-2 infection.


Conflict of interest statement

B.R.S. is an inventor on patents and patent applications involving ferroptosis; co-founded and serves as a consultant to ProJenX, Inc. and Exarta Therapeutics; holds equity in Sonata Therapeutics; serves as a consultant to Weatherwax Biotechnologies Corporation and Akin Gump Strauss Hauer & Feld LLP. B.R.S. and H.T. are inventors on a patent application related to ferrostatin-1 analog development. B.Q. is now a Post Doc Scientist at Gilead Sciences, Inc. The remaining authors declare no competing interests.

Figures

Fig. 1
Fig. 1. Ferroptosis is elevated in post-mortem COVID-19 lungs.
a Representative images of H&E-stained COVID-19 lung autopsies with ALI and non-ALI pathology and non-infected control lungs. ALI case shows characteristic hyaline membranes lining the alveolar walls (asterisks). Non-ALI case shows congestion and hemangiomatosis-like changes in the alveolar wall (arrows). Scale bar = 100 μm. b Representative images of immunofluorescence (IF) staining using anti-TfR1 antibody (clone 3F3-FMA) and anti-MDA antibody (clone 1F83). Nuclei are shown in blue, and antibodies are shown in red. Scale bar = 20 μm. c The mean intensity of TfR1 signal of each case is normalized to the mean of non-infected control group. Data shown as mean ± SEM, n = 9 (control), n = 11 (ALI), n = 10 (non-ALI), one-way ANOVA (p value indicated). d Non-COVID-19 ALI cases were immunohistochemistry (IHC) stained with anti-TfR1 antibody (clone H68.4). Positive stain area is normalized to control group. Data shown as mean ± SEM, n = 6 (control), n = 13 (non-COVID), unpaired two-sided t test. e The mean intensity of MDA signal is normalized to the non-infected control group. Data shown as mean ± SEM, n = 9 (control), n = 11 (ALI), n = 10 (non-ALI), one-way ANOVA (p value indicated). f COVID-19 and control cases were stained with anti-phospho-MLKL, anti-cleaved Caspase 3, and anti-cleaved Gasdermin D antibodies. The mean intensity of each antibody is normalized to the control group. Data shown as mean ± SEM, n = 9 (control), n = 11 (ALI), n = 10 (non-ALI) (left and middle panel), one-way ANOVA. n = 5 (control), n = 10 (non-ALI) (right panel), unpaired two-sided t test.
Fig. 2
Fig. 2. Dysregulation of iron homeostasis contributes to ferroptosis.
a The initial and last serum ferritin level in deceased COVID-19 patient (n = 12) during hospitalization. Gray area represents normal range (11–336 ng/mL). Connected dots represents the same patient. b Severe and mild COVID-19 explant/biopsy, and control cases were IHC stained with anti-TfR1 antibody (clone H68.4) and IF stained with anti-ferritin light chain (FTL) antibody. The positive stain area of TfR1 and mean intensity of FTL are normalized to the non-infected control group. Data shown as mean ± SEM, n = 4 (control), n = 7 (severe), n = 6 (mild) (left panel). n = 6 (control), n = 7 (severe), n = 6 (mild) (right panel). One-way ANOVA (p value indicated). c Reanalysis of single cell RNA sequencing dataset (GEO, GSE171524). Plot shows the scaling relative to each gene’s expression across all cells associated with each column label in the plot. Iron regulatory pathway genes are shown. d UMAP plot shows the expression of FTL and TfR1 across different alveolar cell types in COVID-19 vs. control groups. e Primary lung epithelial cells were treated with 20 mg/mL ferric ammonium citrate (FAC) with or without 10 μM ferrostatin-1 (Fer-1) or 10 μM liproxstatin-1 (Lip-1) for 5 h. Lipid peroxidation was measured by C11-BODIPY581/591 using flow cytometry. Data shown as representative result of 2 independent experiments. f Primary lung epithelial cells were co-treated with 2 mg/mL FAC with or without 10 μM Lip-1, and the dose responses to RSL3 and IKE at 24 h were measured. Data shown as mean ± SD of n = 3 technical replicates. g Dose response curve of FAC in Calu-1 cells at 24 h with or without 10 μM Fer-1. Data shown as mean ± SD of n = 3 technical replicates. h Western blot analysis of primary lung epithelial cells treated with 20 mg/mL FAC with or without 10 μM Lip-1 for 5 h. Whole cell lysate was collected and 40 μg of protein was loaded to each lane. FTL and α-Tubulin were blotted. Data shown as representative result of 2 independent experiments. Uncropped blots are provided in Supplementary Fig. 6.
Fig. 3
Fig. 3. Lipidomics reveals evidence of ferroptosis in fatal COVID-19 lung samples.
a Lipids were extracted from COVID-19 lung autopsy samples and analyzed using mass spectrometry. A total of 363 unique lipids were identified across 6 lipid categories and 20 subclasses combined in both positive and negative ESI modes. Values beside each subclass annotation represent the number of lipids identified in that particular subclass. b PCA plots show clear separation of COVID-19 groups (n = 13) from control (n = 5) groups in both positive and negative electrospray ionization modes. Bubble plots of log2 fold changes in abundance of identified (c), phospholipids and (d), lysophospholipids in COVID-19 lung relative to the control lung are shown. Bubble size represents the FDR-corrected p value from the Welch’s t test. CoQ10 coenzyme Q10, Cer ceramide, Hex2Cer dihexosylceramide, NeuAcHex2Cer ganglioside, SM sphingomyelin, CE cholesteryl ester, CS cholesteryl sulfate, FA fatty acid, LPC lyso phosphatidylcholine, PC phosphatidylcholine, LPE lysophosphatidylethanolamine, PE phosphatidylethanolamine, LPG lysophosphatidylglycerol, PG phosphatidylglycerol, LPI lysophosphatidylinositol, PI phosphatidylinositol, CL cardiolipin, DG diglyceride, TG triglyceride.
Fig. 4
Fig. 4. Ferroptosis correlates with lung disease severity in a COVID-19 Syrian hamster model.
a 10-week-old male hamsters were inoculated with 105 PFU SARS-CoV-2 and euthanized at several time points to examine lung tissue. Representative images showing H&E staining, IHC staining using anti-TfR1 antibody (clone H68.4), and TUNEL staining on SARS-CoV-2-infected hamster lung sections collected on 2, 4, 7, 14 days post infection (dpi). Scale bar = 50 μm. b The positive TfR1 stain area is normalized to the mock group. Data shown as mean ± SEM, n = 6 (mock), n = 7 (7 dpi), unpaired two-sided t test (p value indicated). c Injured area% and positive TfR1 area% in infected lungs (n = 24) were plotted and fitted with linear regression. R2 = 0.5329. Mock and infected lung section were IF stained with anti-4-HNE antibody (clone HNEJ-1) and anti-FTL antibody. The mean intensities of (d), HNEJ-1 and (e), FTL were normalized to the mock group. Data shown as mean ± SEM, n = 6 for both groups, unpaired two-sided t test (p value indicated). f Representative images of FTL and 4-HNE stain on mock and infected hamster lung at 7 dpi. Nucleus is in blue, 4-HNE in red, and FTL in green. Scale bar = 20 μm.

References

    1. Cardinal-Fernandez P, Lorente JA, Ballen-Barragan A, Matute-Bello G. Acute respiratory distress syndrome and diffuse alveolar damage. New insights on a complex relationship. Ann. Am. Thorac. Soc. 2017;14:844–850. doi: 10.1513/AnnalsATS.201609-728PS. - DOI - PubMed
    1. De Michele S, et al. Forty postmortem examinations in COVID-19 patients. Am. J. Clin. Pathol. 2020;154:748–760. doi: 10.1093/ajcp/aqaa156. - DOI - PMC - PubMed
    1. Martines RB, et al. Pathology and pathogenesis of SARS-CoV-2 associated with fatal coronavirus disease, United States. Emerg. Infect. Dis. 2020;26:2005–2015. doi: 10.3201/eid2609.202095. - DOI - PMC - PubMed
    1. Ruggiero V, Aquino RP, Del Gaudio P, Campiglia P, Russo P. Post-COVID syndrome: The research progress in the treatment of pulmonary sequelae after COVID-19 infection. Pharmaceutics. 2022;14:1135. doi: 10.3390/pharmaceutics14061135. - DOI - PMC - PubMed
    1. Stasi C, Fallani S, Voller F, Silvestri C. Treatment for COVID-19: An overview. Eur. J. Pharmacol. 2020;889:173644. doi: 10.1016/j.ejphar.2020.173644. - DOI - PMC - PubMed

MeSH terms