. 2024 May 20;15(1):4296.
doi: 10.1038/s41467-024-48307-z.

Targeting SOX13 inhibits assembly of respiratory chain supercomplexes to overcome ferroptosis resistance in gastric cancer

Affiliations

Targeting SOX13 inhibits assembly of respiratory chain supercomplexes to overcome ferroptosis resistance in gastric cancer

Hui Yang et al. Nat Commun. .

Abstract

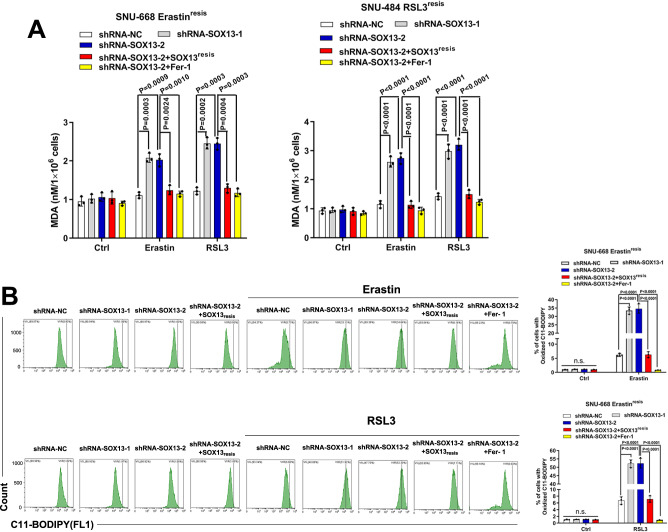
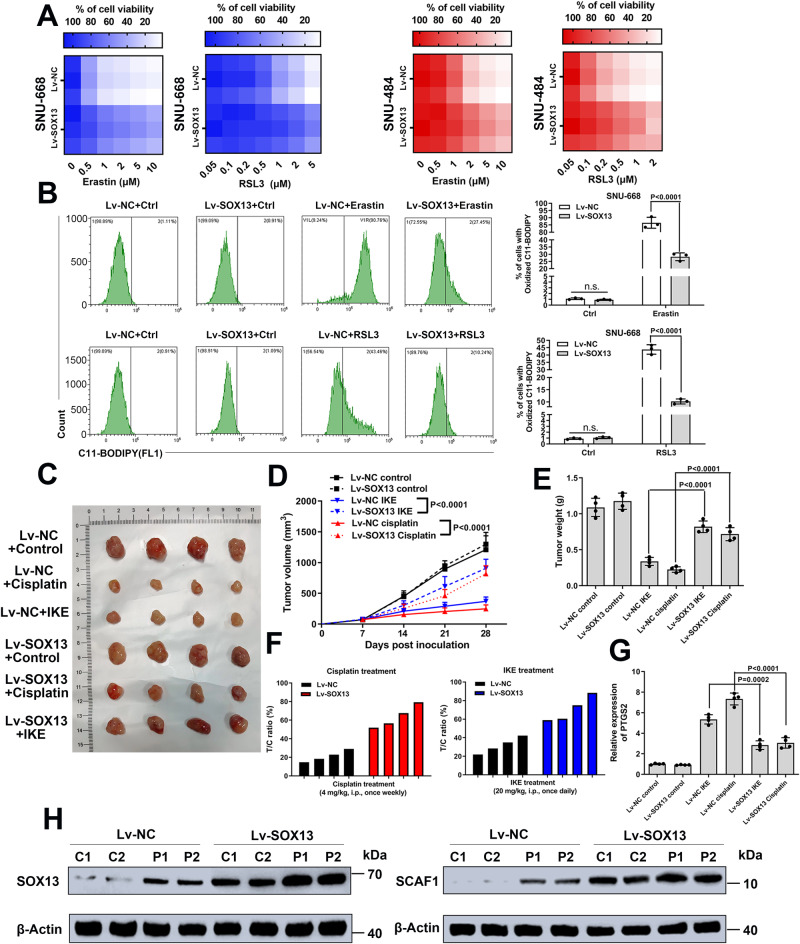
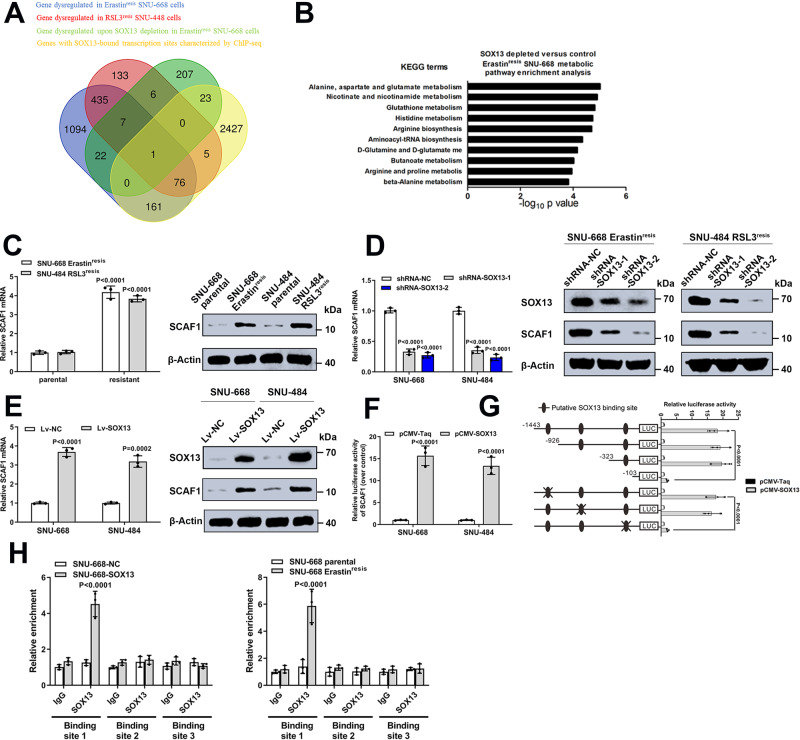
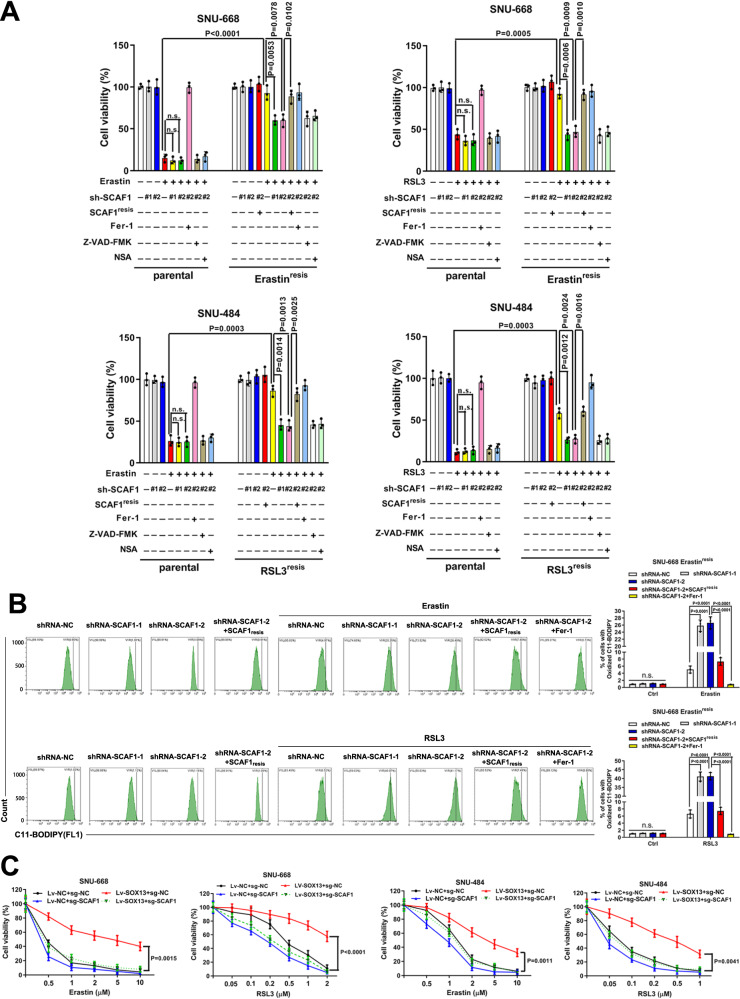
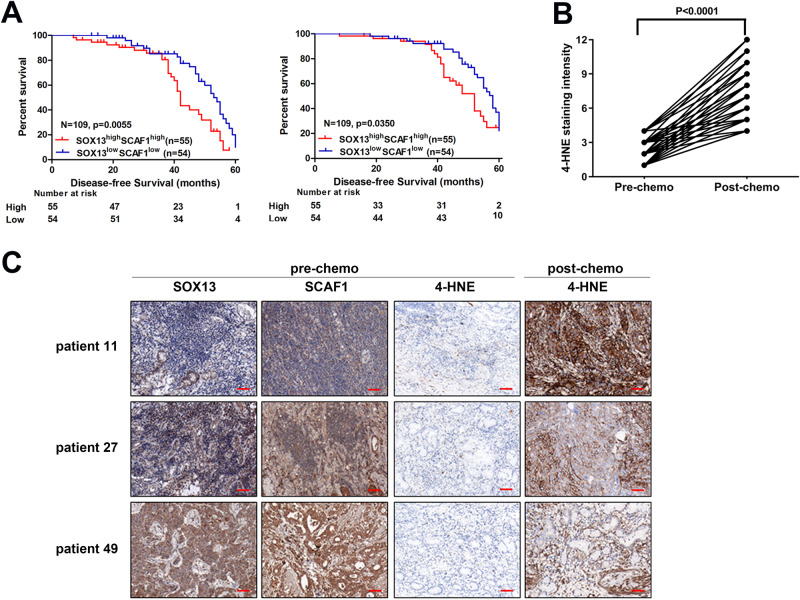
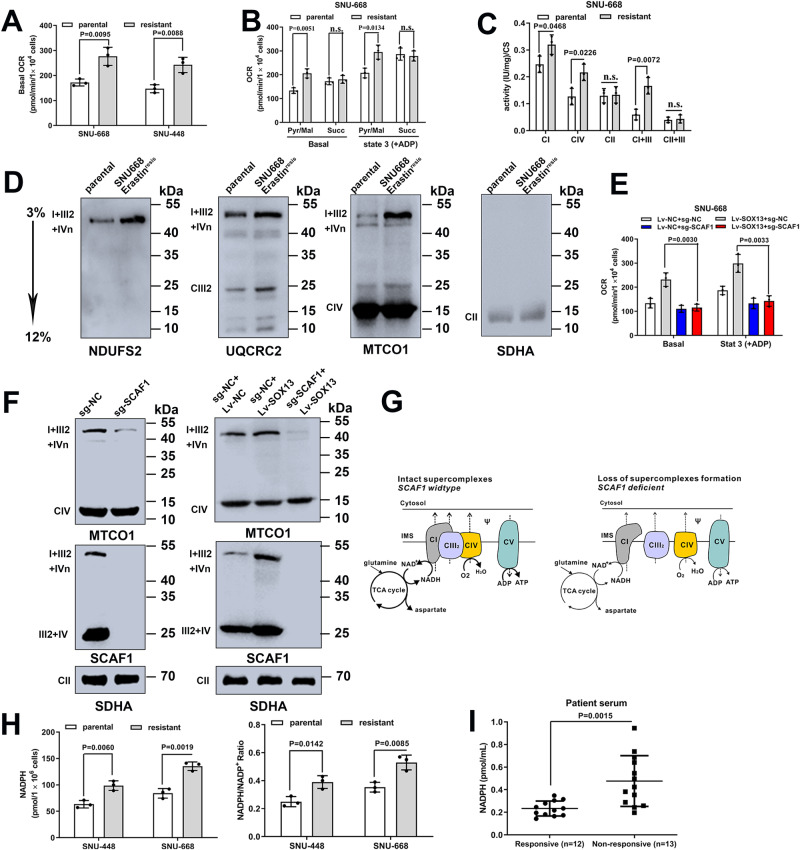
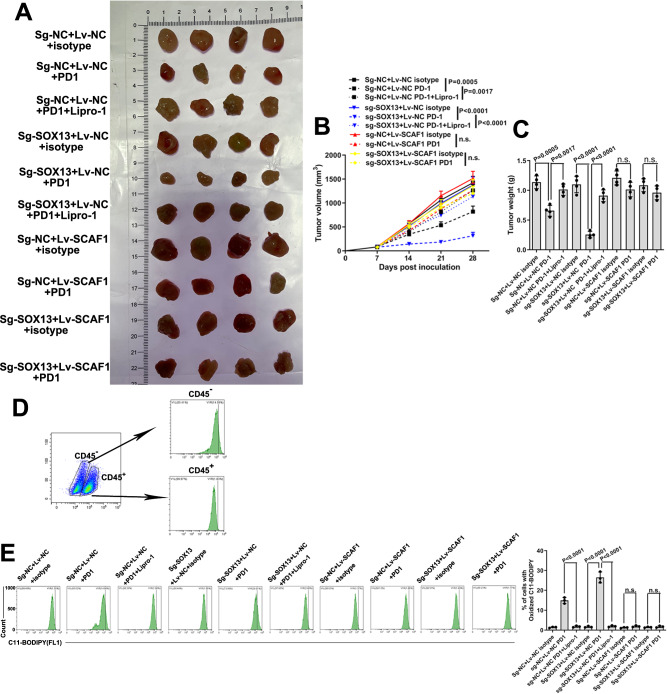
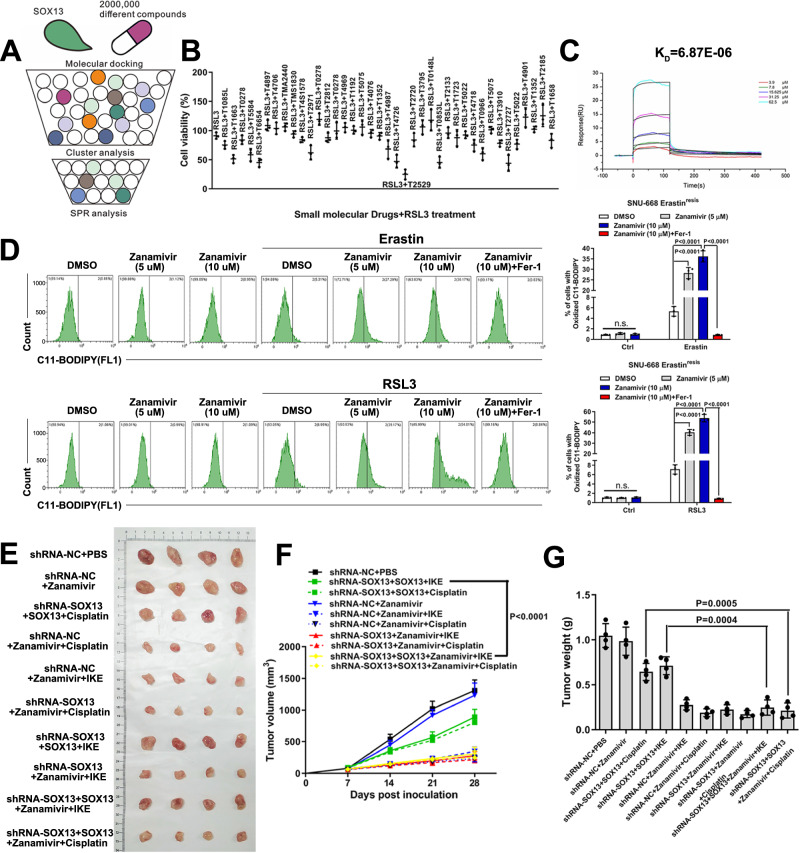
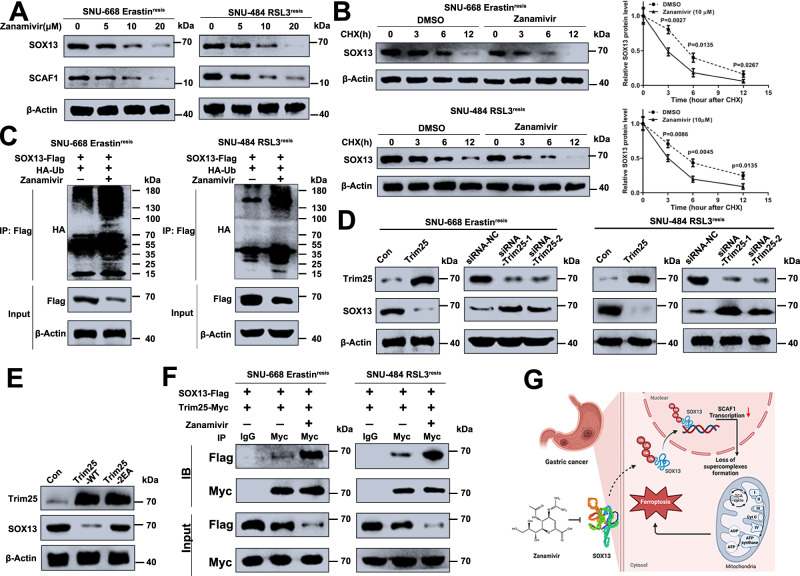
Therapeutic resistance represents a bottleneck to treatment in advanced gastric cancer (GC). Ferroptosis is an iron-dependent form of non-apoptotic cell death and is associated with anti-cancer therapeutic efficacy. Further investigations are required to clarify the underlying mechanisms. Ferroptosis-resistant GC cell lines are constructed. Dysregulated mRNAs between ferroptosis-resistant and parental cell lines are identified. The expression of SOX13/SCAF1 is manipulated in GC cell lines where relevant biological and molecular analyses are performed. Molecular docking and computational screening are performed to screen potential inhibitors of SOX13. We show that SOX13 boosts protein remodeling of electron transport chain (ETC) complexes by directly transactivating SCAF1. This leads to increased supercomplexes (SCs) assembly, mitochondrial respiration, mitochondrial energetics and chemo- and immune-resistance. Zanamivir, reverts the ferroptosis-resistant phenotype via directly targeting SOX13 and promoting TRIM25-mediated ubiquitination and degradation of SOX13. Here we show, SOX13/SCAF1 are important in ferroptosis-resistance, and targeting SOX13 with zanamivir has therapeutic potential.


Conflict of interest statement

The authors declare no competing interests. This work was supported by the following grants: M.Z.M. discloses support for the research of this work from National Nature Science Foundation of China [grant number 81972213] and Natural Science Foundation of Shanghai [grant number 22ZR1412700]. K.L. discloses support for publication of this work from the National Nature Science Foundation of China [grant number 82072370], Program for Excellent Sci-tech Innovation Teams of Universities in Anhui Province [grant number 2022AH010074] Funding of “Peak” Training Program for Scientific Research of Yijishan Hospital, Wannan Medical College [grant number GF2019T01] and Funding of Climbing Peak Training Program for Innovative Technology team of Yijishan Hospital, Wannan Medical College [grant number PF201904]. H.Y. discloses support for the research of this work from the Health Research Program of Anhui [grant number AHWJ2023A30252], National Nature Science Foundation of China [grant number 81802503], Open Project of Key Laboratory of Non-coding RNA Transformation Research of Anhui Higher Education Institution (Wannan Medical College) [grant number RNA202205], Science and Technology Application Basic Research Project of Wuhu [grant number 2022jc60], Funding of “Peak” Training Program for Scientific Research of Yijishan Hospital, Wannan Medical College [grant number GF2019G15], Outstanding Innovative Research Team for Molecular Enzymology and Detection in Anhui Provincial Universities (2022AH010012). Y.Z. discloses support for the research of this work from the Key University Science Research Project of Anhui Province [grant number KJ2020A0594] and Key Health Research Project in Anhui Province [grant number AHWJ2022A021]. X.C.L discloses support for the research of this work from the Key University Science Research Project of Anhui Province [grant number KJ2020A0607]. Y.B.S. discloses support for the research of this work from Shanghai Municipal Health Commission Research Project [grant number 20194Y0242].

Figures

Fig. 1
Fig. 1. SOX13 dependence in ferroptosis-resistant GC.
A Combinatorial analysis of genes differentially expressed between parental and ferroptosis-resistant cells and genes that are strongly correlated with sensitivity to ferroptosis inducers in CTRP. Six common genes were identified, among which was SOX13. B qRT–PCR analysis of SOX13 transcript levels in resistant cell lines (n = 3 independent experiments). RSL3resis, RSL3 resistance; Erastinresis, Erastin resistance. Data are presented as mean values ± SD. C Box-and-whisker plots show 5st and 95th percentile outlier compounds (red dots) where SOX13 expression levels are correlated with cell line sensitivity to the compounds in CTRP. Plotted values are Z-scored Pearson’s correlation coefficients. Line, median; box, 10th–90th percentiles. A positive z-score means that high expression is correlated with high resistance to compounds, and vice versa. D SOX13 was determined by immunoblotting assay and normalized to β-actin (n = 3 independent experiments). E Effect of SOX13 downregulation and SOX13 re-expression on Erastin (2 μM) or RSL3 (0.5 μM) sensitivity in the absence or presence of Z-VAD-FMK (10 μM), NSA (1 μM), or Fer-1 (1 μM) in parental versus resistant cells. The cells were treated with FINs for 24 h (n = 3 independent experiments). Cell viability was evaluated with a CellTiter-Glo luminescent cell viability assay (n = 3 independent experiments). Data are presented as mean values ± SD. Statistical significance in (B) and (E) is determined by two-tailed unpaired t test. Source data are provided as a Source Data file.
Fig. 2
Fig. 2. SOX13 dependence in ferroptosis-resistant GC.
A, B Effect of SOX13 downregulation and SOX13 re-expression on Erastin (2 μM) or RSL3 (0.5 μM) sensitivity in the absence or presence of Fer-1 (1 μM) in resistant cells. The cells were treated with FINs for 24 h. A Intracellular MDA was assayed with ELISA (n = 3 independent experiments). Data are presented as mean values ± SD. B Lipid peroxidation was determined with a lipid peroxidation C11-BODIPY assay in SNU-668 Erastinresis cells (n = 3 independent experiments), and a representative flow cytometry histogram plot is presented. Data are presented as mean values ± SD. Statistical significance in (A) and (B) is determined by two-tailed unpaired t test. Source data are provided as a Source Data file.
Fig. 3
Fig. 3. SOX13 is required and sufficient for ferroptosis-resistance.
A, B Effect of exogenous expression of SOX13 on sensitivity of parental SNU-668 cells (Left) or SNU-484 cells (Right) to the ferroptosis inducers RSL3 or Erastin. Cells were treated with lentivirus harboring the human SOX13 sequence or the empty vector, or in combination with various concentrations of Erastin (Left panel) or RSL3 (Right panel) for 24 h. The heatmap shows altered cell viability. B SNU-668 Cells were treated with lentivirus harboring the human SOX13 sequence or the empty vector, or in combination with Erastin (2 μM, Upper panel) or RSL3 (0.5 μM, Lower panel) for 24 h. Lipid peroxidation was determined using a lipid peroxidation C11-BODIPY assay (n = 3 independent experiments), and representative flow cytometry histogram plot is presented. Data are presented as mean values ± SD. (C-G) SNU-668-SOX13-CDX tumors and SNU-668-NC-CDX tumors were treated with cisplatin and IKE. Representative images of tumors formed (C), tumor growth curves (D), tumor weights (E), T/C ratio (F) and PTGS2 (G) expression analysis are shown. Treatment with IKE (20 mg/kg, i.p., once daily), cisplatin (4 mg/kg, i.p., once weekly) or PBS (100 µl, i.p., once daily) started on Day 7 and lasted for 3 consecutive weeks (n = 4 mice per group). T/C% = TRTV/CRTV × 100%; TRTV relative tumor volume after treatment; CRTV relative tumor volume of control group. Data are presented as mean values ± SD. H SOX13/SCAF1 expression in SNU-668 cell-derived xenografts was determined by immunoblotting and normalized to β-actin (Representative plot of experiments repeated in triplicate). C control, P cisplatin. Randomly selected two tumor samples per group are shown. Statistical significance in (B) and (D, E, G) is determined by two-tailed unpaired t test. Source data are provided as a Source Data file.
Fig. 4
Fig. 4. SCAF1 is a direct transcriptional target of SOX13.
A Combinatorial analysis of genes differentially expressed between ferroptosis-sensitive and ferroptosis-resistant cells, genes dysregulated in response to SOX13 downregulation in Erastinresis SNU-668 cells, and the genes with SOX13-bound transcription sites characterized by ChIP-seq. The core common gene SCAF1 was identified. B Metabolite set enrichment analysis (MSEA) was used to determine the top ten metabolic pathways enriched in SOX13-downregulated Erastinresis SNU-668 cells. C mRNA and protein levels of SCAF1 in resistant and parental SNU-668 and SNU-484 cell lines (n = 3 independent experiments). Data are presented as mean values ± SD. D Effect of SOX13 knockdown on SCAF1 protein abundance in resistant cells (Representative blot of three experimental replicates, quantification shows three independent experiments). Data are presented as mean values ± SD. E Effect of SOX13 overexpression on SCAF1 protein abundance in parental cells (n = 3 independent experiments). Data are presented as mean values ± SD. F Luciferase assay of GC cells cotransfected with firefly luciferase constructs containing the SCAF1 promoter and pCMV-SOX13 (n = 3 independent experiments). Data are presented as mean values ± SD. G Luciferase assay of GC cells cotransfected with firefly luciferase constructs containing a series of SOX13 promoter deletion mutants and pCMV-SOX13 (n = 3 independent experiments). Data are presented as mean values ± SD. H ChIP-qPCR analysis further verified that SOX13 directly accumulates at SCAF1 promoter regions in GC cells with SOX13 upregulation and in Erastinresis SNU-668 cells (n = 3 independent experiments). Data are presented as mean values ± SD. Statistical significance in (BH) is determined by two-tailed unpaired t-test. Source data are provided as a Source Data file.
Fig. 5
Fig. 5. SOX13 upregulated SCAF1 to boost ferroptosis-resistance.
A Effect of SCAF1 knockdown and SCAF1 re-expression on Erastin (2 μM) or RSL3 (0.5 μM) sensitivity in the absence or presence of Z-VAD-FMK (10 μM), NSA (1 μM), or Fer-1 (1 μM) in parental versus resistant cells. The cells were treated for 24 h. Cell viability was evaluated with a CellTiter-Glo luminescent cell viability assay (n = 3 independent experiments). Data are presented as mean values ± SD. B SNU-668 Erastinresis cells were treated with lentiviruses encoding SCAF1 shRNA-1 or shRNA-2 or a scrambled shRNA alone and/or resistant SOX13 cDNA (SOX13resis), or in combination with Erastin (2 μM) or RSL3 (0.5 μM) for 24 h. Lipid peroxidation was determined with a lipid peroxidation C11-BODIPY assay in SNU-668 Erastinresis cells (n = 3 independent experiments), and a representative flow cytometry histogram plot is presented. Data are presented as mean values ± SD. C Effect of SOX13 overexpression (Lv-SOX13) alone, SCAF1 KO (sg-SCAF1) alone, or the two in combination on Erastin or RSL3 sensitivity in parental SNU-668 and SNU-484 cells. The cells were treated for 24 h (n = 3 independent experiments). Data are presented as mean values ± SD. Statistical significance in (AC) is determined by two-tailed unpaired t test. Source data are provided as a Source Data file.
Fig. 6
Fig. 6. Ferroptosis induction correlates with GC patient response to chemotherapy.
A Kaplan–Meier survival curves and log-rank test analysis of DFS (left) and OS (right) rates in GC cancer patients who underwent cisplatin-based adjuvant chemotherapy. The GC patients were grouped according to the median coexpression value within their tumors. B Immunochemistry scoring of 4-hydroxy-2-nonenal (4-HNE) staining of matched GC samples before and after cisplatin-based chemotherapy from 52 GC patients. Error bars are means ± SD, n = 3 randomly selected magnification fields. C Representative images of 4-HNE, SOX13 and SCAF1 immunohistochemical staining of matched GC samples from the same patients before or after chemotherapy. Scale bar: 50 μm. Two-tailed paired t test (B) or two-sided log-rank test (A). Source data are provided as a Source Data file.
Fig. 7
Fig. 7. SOX13 boosted SCAF1-mediated assembly of respiratory chain supercomplexes and NADPH production.
Parental and resistant cells. Oxygen consumption analysis was performed in (A) intact cells or (B) isolated mitochondria using pyruvate-malate or succinate as specific substrates, respectively (n = 3 independent experiments). Data are presented as mean values ± SD. C Mitochondrial enzymatic activities of complex I (CI), complex IV (CIV), complex II (CII), CI+complex III (CIII), and CII + III normalized to citrate synthase (CS) levels in parental and resistant SNU-668 cells (n = 3 independent experiments). Data are presented as mean values ± SD. D Western blot analysis of the indicated proteins, including CI, CIII, CIV, and CII, after blue native PAGE (BN-PAGE) of digitonin-solubilized mitochondria from parental and resistant SNU-668 cells (Representative plot of experiments repeated in triplicate). E Oxygen consumption rates (OCR) of isolated mitochondria from parental SNU-668 cells with SOX13 overexpression (Lv-SOX13) alone, SCAF1 KO (sg-SCAF1) alone or the two in combination (n = 3 independent experiments). Data are presented as mean values ± SD. F SC levels in parental SNU-668 cells with SOX13 overexpression (Lv-SOX13) alone, SCAF1 KO (sg-SCAF1) alone or the two in combination (Representative plot of experiments repeated in triplicate). G Schematic illustrating the metabolic consequences from loss of supercomplex formation in GC cells. Intact supercomplexes (left) and loss of supercomplexes (right) are demonstrated using the respirasome (complexes I, III2, and IV). H NADPH levels and NADPH/NADP+ in parental and resistant cells (n = 3 independent experiments). Data are presented as mean values ± SD. I Abundance of NADPH in the blood of cisplatin treatment nonresponsive patients (TRG ≥ 3, n = 13) compared to patients sensitive to cisplatin (TRG ≤ 2, n = 12) from cohort 2. Data are presented as mean values ± SD. Two-tailed unpaired t-test (AC, E, H) or two-tailed Mann–Whitney test (I). Source data are provided as a Source Data file.
Fig. 8
Fig. 8. Targeting the SOX13–SCAF1 pathway potentiates the antitumor activity of immunotherapy.
A SOX13-KO (sg-SOX13), SCAF1-overexpressing (Lv-SCAF1) or control YTH16 (m) cells were grown as xenografts. Antibody to mouse PD1 treatment or lipoxstatin alone or in combination started on Day 7 after injection of C57BL/6 mice with cells to form xenografts. Tumor growth (B) and weight change (C) are shown (n = 4 mice per group). Data are presented as mean values ± SD. D Flow cytometry analysis of BODIPY fluorescence in CD45+ and CD45 tumor cells isolated from control YTH16 (m) derived xenografts treated with antibody to mouse PD1. E Representative flow cytometry analysis and quantification of BODIPY fluorescence in CD45 tumor cells from YTH16 (m)-derived xenografts with the treatment described above (data from randomly selected three tumors from each group). Data are presented as mean values ± SD. Statistical significance in (B,C,E) is determined by two-tailed unpaired t-test. Source data are provided as a Source Data file.
Fig. 9
Fig. 9. Zanamivir directly targets SOX13 to inhibit ferroptosis-resistance in GC.
A A schematic diagram demonstrating the screening strategy for SOX13-targeting compounds. B Effect of the top 40 candidate compounds (10 μM) on RSL3 (0.5 μM) sensitivity in Erastinresis SNU-668 cells. The cells were pretreated with candidate compounds (10 μM) for 12 h prior to being exposed to RSL3 (0.5 μM) for 24 h. Cell viability was examined (n = 3 independent experiments). Data are presented as mean values ± SD. C SPR analysis of the interaction between zanamivir and SOX13 protein. D The Erastinresis SNU-668 cells cells were pretreated with zanamivir (0 μM, 5 μM, 10 μM) for 12 h and then exposed to Erastin (2 μM) or RSL3 (0.5 μM) for 24 h. Lipid peroxidation was determined using a lipid peroxidation C11-BODIPY assay (n = 3 independent experiments), and representative flow cytometry histogram plot is presented. Data are presented as mean values ± SD. Tumors from Erastinresis SNU-668 cells transfected with desired vector were treated with zanamivir, cisplatin and IKE. Representative images of tumors formed (E), tumor growth curves (F) and tumor weights (G) are shown. Treatment with cisplatin (4 mg/kg, i.p., once weekly), IKE (20 mg/kg, i.p., once daily), zanamivir (5 mg/kg, i.p., once daily) or PBS (100 µl, i.p., once daily) started on Day 7 and lasted for 3 consecutive weeks (n = 4 mice per group). Data are presented as mean values ± SD. Statistical significance in (D, F, G) is determined by two-tailed unpaired t test. Source data are provided as a Source Data file.
Fig. 10
Fig. 10. The E3 ligase TRIM25 modulates zanamivir-induced polyubiquitination and proteasomal degradation of SOX13.
A The Erastinresis SNU-668 cells or RSL3resis SNU-484 cells were pretreated with zanamivir (0 μM, 5 μM, 10 μM, 20 μM) for 36 h. Western blot analysis of SOX13, and SCAF1 protein expression levels (Representative plot of experiments repeated in triplicate). B The Erastinresis SNU-668 cells or RSL3resis SNU-484 cells were treated with cycloheximide (100 μg/mL) as indicated in the presence or absence of zanamivir (10 μM) (n = 3 independent experiments). Data are presented as mean values ± SD. C The SNU-668 cells or SNU-484 cells were transfected with the desired plasmids, 36 h after transfection, they were treated with zanamivir (10 μM) for 24 h, and then subjected to IP using anti-Flag antibody followed by Western blot analysis (Representative plot of experiments repeated in triplicate). D Depletion of TRIM25 increased while forced expression of TRIM25 decreased the protein level of SOX13 in Erastinresis SNU-668 cells or RSL3resis SNU-484 cells (Representative plot of experiments repeated in triplicate). E Western blot analysis of SOX13 and TRIM25 protein levels in Erastinresis SNU-668 cells overexpressing TRIM25-WT, TRIM25-2EA or vector control (Representative plot of experiments repeated in triplicate). F Co-IP assay was used to determine the binding of SOX13 with TRIM25 in the presence or absence of zanamivir (Representative plot of experiments repeated in triplicate). G Ferroptosis-sensitization mechanism of SOX13-targeting compound zanamivir. Zanamivir targets SOX13 protein and thus downregulates SCAF1, which leads to decreased supercomplexes (SCs) assembly, mitochondrial respiration, mitochondrial energetics, and increased ferroptosis sensitivity. Statistical significance in (B) is determined by two-tailed unpaired t test. Source data are provided as a Source Data file.

References

    1. Sung H, et al. Global cancer statistics 2020: GLOBOCAN estimates of incidence and mortality worldwide for 36 cancers in 185 countries. CA Cancer J. Clin. 2021;71:209–249. doi: 10.3322/caac.21660. - DOI - PubMed
    1. Chen W, et al. Cancer statistics in China, 2015. CA Cancer J. Clin. 2016;66:115–132. doi: 10.3322/caac.21338. - DOI - PubMed
    1. Smyth EC, Nilsson M, Grabsch HI, van Grieken NC, Lordick F. Gastric cancer. Lancet. 2020;396:635–648. doi: 10.1016/S0140-6736(20)31288-5. - DOI - PubMed
    1. Kang YK, et al. S-1 plus leucovorin and oxaliplatin versus S-1 plus cisplatin as first-line therapy in patients with advanced gastric cancer (SOLAR): a randomised, open-label, phase 3 trial. Lancet Oncol. 2020;21:1045–1056. doi: 10.1016/S1470-2045(20)30315-6. - DOI - PubMed
    1. DePeaux K, Delgoffe GM. Metabolic barriers to cancer immunotherapy. Nat. Rev. Immunol. 2021;21:785–797. doi: 10.1038/s41577-021-00541-y. - DOI - PMC - PubMed

MeSH terms