. 2024 May 20;15(1):4297.
doi: 10.1038/s41467-024-48602-9.

Inflammatory and neurodegenerative serum protein biomarkers increase sensitivity to detect clinical and radiographic disease activity in multiple sclerosis

Affiliations

Inflammatory and neurodegenerative serum protein biomarkers increase sensitivity to detect clinical and radiographic disease activity in multiple sclerosis

Tanuja Chitnis et al. Nat Commun. .

Abstract

The multifaceted nature of multiple sclerosis requires quantitative biomarkers that can provide insights related to diverse physiological pathways. To this end, proteomic analysis of deeply-phenotyped serum samples, biological pathway modeling, and network analysis were performed to elucidate inflammatory and neurodegenerative processes, identifying sensitive biomarkers of multiple sclerosis disease activity. Here, we evaluated the concentrations of > 1400 serum proteins in 630 samples from three multiple sclerosis cohorts for association with clinical and radiographic new disease activity. Twenty proteins were associated with increased clinical and radiographic multiple sclerosis disease activity for inclusion in a custom assay panel. Serum neurofilament light chain showed the strongest univariate correlation with gadolinium lesion activity, clinical relapse status, and annualized relapse rate. Multivariate modeling outperformed univariate for all endpoints. A comprehensive biomarker panel including the twenty proteins identified in this study could serve to characterize disease activity for a patient with multiple sclerosis.


Conflict of interest statement

The authors declare the following competing interests: T.C. has received compensation for consulting from Biogen, Novartis Pharmaceuticals, Roche Genentech, and Sanofi Genzyme, and received research support from the National Institutes of Health, National MS Society, US Department of Defense, EMD Serono, I-Mab Biopharma, Novartis Pharmaceuticals, Octave Bioscience, Inc, Roche Genentech, and Tiziana Life Sciences. V.M.G., M.B., and A.K. were employees of Octave Bioscience, Inc at the time the study was completed. R.B. is funded by the NMSS Harry Weaver Award, NIH, DOD, NSF, as well as Biogen, Novartis, and Roche Genentech. She has received personal fees for consulting from Alexion, EMD Serono, Horizon, Janssen, Sanofi-Genzyme, and TG Therapeutics. B.A.C.C. has received personal compensation for consulting from Alexion, Atara, Autobahn, Avotres, Biogen, Boston Pharma, EMD Serono, Gossamer Bio, Hexal/Sandoz, Horizon, Immunic AG, Neuron23, Novartis, Sanofi, Siemens, and TG Therapeutics, and received research support from Genentech. S.L.H. currently serves on the scientific advisory board of Accure, Alector, and Annexon; board of directors of Neurona; and has previously consulted for BD, Moderna, and NGM Bio. Dr. Hauser also has received travel reimbursement and writing support from F. Hoffmann-La Roche and Novartis AG for anti-CD20 therapy-related meetings and presentations and is supported by grants from the NIH/NINDS (R35NS111644). R.G. H. has received fees for consultation from Roche/Genentech, Novartis, Neuron23, QIA Consulting, and research funding from Roche/Genentech and Atara. H.L. has received research support from the US Department of Defense and Octave Bioscience, Inc. A.P. is currently an employee of Moderna Therapeutics. F.Q. is an employee of Octave Bioscience, Inc. N.S. has received the Sylvia Lawry Physician Fellowship Award from the National MS Society. She has also received compensation for consulting from EMD Serono. H.W. has received research support from the Department of Defense, Genentech, Inc., National Institutes of Health, National Multiple Sclerosis Society, Novartis, and Sanofi Genzyme. He has received compensation for consulting from Genentech, Inc., IM Therapeutics, IMAB Biopharma, MedDay Pharmaceuticals, Tiziana Life Sciences, and vTv Therapeutics. S.E.B. is co-Founder of Mate Bioservices. H.Y., R.G., S.S., S.J.C., and A.S. declare no competing interests.

Figures

Fig. 1
Fig. 1. Univariate dependence of the 20 CAP protein concentrations on Gd-enhanced lesion count.
Different color boxes correspond to the lesion count in that population of samples (blue for zero lesions, yellow for one, orange for two, and red for three or more). Sample counts for each lesion bin are 138 for 0 lesions, 126 for 1, 148 for 2, and 89 for 3 or more. The black line through each box shows the median (50th percentile) of the population. The height of each box shows the interquartile range (25th–75th percentile). The whiskers show the central 90% of the distribution (5th–95th percentile). The 5% of outliers furthest from the median are drawn as open black circles. Source data are provided as a Source Data file. CAP custom assay panel, Gd gadolinium, NPX normalized protein expression.
Fig. 2
Fig. 2. Univariate box plots for the CAP proteins separation of samples (a) and box plots of the univariate separation of CAP proteins for low and high ARR (b).
a Univariate box plots for the CAP proteins separation of samples taken during quiescence (remission, blue boxes, 64 samples) or exacerbation (relapse, red boxes, 60 samples). b Box plots of the univariate separation of CAP proteins for low ( ≤ 0.2/year, blue boxes, 148 samples) and high ( ≥ 1.0/year, red boxes, 13 samples) ARR. The black line through each box shows the median (50th percentile) of the population. The height of each box shows the interquartile range (25th–75th percentile). The whiskers show the central 90% of the distribution (5th–95th percentile). The 5% of outliers furthest from the median are drawn as open black circles. Source data are provided as a Source Data file. ARR annualized relapse rate, CAP custom assay panel.
Fig. 3
Fig. 3. Univariate statistical tests for all endpoints.
Top: Spearman’s ⍴ correlation between NPX concentration and Gd lesion count (green bars, left axis) and Student’s t statistic (two-sided) for separation of samples associated with zero lesions from those with one or more by NPX concentration (purple bars, right axis) for each protein. Bottom: Student’s t statistic (two-sided) for separation of samples associated with clinically inactive from those with clinically active disease state (left axis) and those associated with low from high ARR (right axis) by NPX concentration. Bars corresponding to statistical tests showing a p-value > 0.05 have been drawn in a lighter shade of the same color to denote their lack of statistical significance. Source data are provided as a Source Data file. ARR annualized relapse rate, Gd gadolinium, NPX normalized protein expression.
Fig. 4
Fig. 4. GFS curve for the regression (top) and classification (bottom three) analysis of all endpoints.
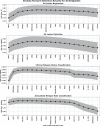
The points represent the mean over the bootstrap splits and the shaded region represents the standard deviation. The protein features selected for each of the multivariate analyses were Gd lesion regression (NfL, GH, IL-12B, CNTN2, MOG, TNFSF13B), Gd lesion classification (NfL, CNTN2, TNFRSF10A, CXCL13, TNFSF13B), Clinical relapse status (NfL, SERPINA9, TNFSF13B, FLRT2), and annualized relapse rate (NfL, OPG, CD6). Note that the regression analysis was clipped at a lesion count of five (only 5.6% of our samples had more than five lesions, making any model behavior above that range unreliable). Source data are provided as a Source Data file. AUROC area under the receiver operator characteristic, ARR annualized relapse rate, CRS clinical relapse status, Gd gadolinium, GFS greedy forward selection, NfL neurofilament light chain.
Fig. 5
Fig. 5. Multivariate modeling results for all four analyses: Gd lesion count estimation (zero through five or more, left panel), Gd lesion detection (center left panel), CRS classification (center right panel), and ARR classification (right panel).
For Gd lesion count estimation, the R2 is reported as the mean and standard deviation across the bootstrap splits. A heat map of the scatter plot probability density is represented by lighter to darker shades of red. The black line is the best fit to the scatter plot of actual vs. predicted lesion counts, and the gray shaded region is the RMSE. For comparison, we also include a dashed line for perfect agreement (actual equals predicted). ROC curves for the three classification analyses are represented as a solid line for the mean and shaded region for the standard deviation across all bootstrap splits using the following colors: red represents the model built with the greedy forward selection proteins, green represents the model built with NfL/NEFL only, and blue represents the model built with every protein but NfL/NEFL. Each analysis was plotted with the model performance plot above a feature importance bar graph for the GFS proteins. Source data are provided as a Source Data file. ARR annualized relapse rate, CRS clinical relapse status, Gd gadolinium, GFS greedy forward selection, R2 square of Pearson’s correlation coefficient.
Fig. 6
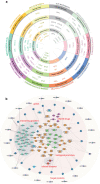
Fig. 6. CAP proteins sorted into biological processes and grouped into 10 MS hallmarks (a) and SPOKE graph visualization of biological neighborhood of CAP proteins (b).
a CAP proteins sorted into 10 MS hallmarks, categorically grouped by color, representing associated biological processes using each protein’s correlation to spatial, functional, and gene expression data. b SPOKE graph visualization of biological neighborhood of CAP proteins. Using proteins as inputs (light blue circles with purple borders) results in a fully connected module including encoding genes (dark blue circles), directly interacting proteins (teal circles), their domains (sky blue circles), biological processes (orange circles) and a short list of related diseases (red circles). CAP custom assay panel, MS multiple sclerosis, SPOKE Scalable Precision Medicine Open Knowledge Engine.

Update of

References

    1. Baecher-Allan C, Kaskow BJ, Weiner HL. Multiple sclerosis: mechanisms and immunotherapy. Neuron. 2018;97:742–768. doi: 10.1016/j.neuron.2018.01.021. - DOI - PubMed
    1. Reich DS, Lucchinetti CF, Calabresi PA. Multiple sclerosis. N. Engl. J. Med. 2018;378:169–180. doi: 10.1056/NEJMra1401483. - DOI - PMC - PubMed
    1. Chitnis T, Weiner HL. CNS inflammation and neurodegeneration. J. Clin. Invest. 2017;127:3577–3587. doi: 10.1172/JCI90609. - DOI - PMC - PubMed
    1. Macaron G, Ontaneda D. Diagnosis and management of progressive multiple sclerosis. Biomedicines. 2019;7:56. doi: 10.3390/biomedicines7030056. - DOI - PMC - PubMed
    1. Wingerchuk DM, Carter JL. Multiple sclerosis: current and emerging disease-modifying therapies and treatment strategies. Mayo Clin. Proc. 2014;89:225–240. doi: 10.1016/j.mayocp.2013.11.002. - DOI - PubMed

Substances