. 2024 Nov;49(12):1809-1818.
doi: 10.1038/s41386-024-01880-9. Epub 2024 May 20.

Temporal dissociation between local and global functional adaptations of the maternal brain to childbirth: a longitudinal assessment

Affiliations

Temporal dissociation between local and global functional adaptations of the maternal brain to childbirth: a longitudinal assessment

Leon D Lotter et al. Neuropsychopharmacology. 2024 Nov.

Abstract

The maternal brain undergoes significant reorganization during birth and the postpartum period. However, the temporal dynamics of these changes remain unclear. Using resting-state functional magnetic resonance imaging, we report on local and global brain function alterations in 75 mothers in their first postpartum week, compared to 23 nulliparous women. In a subsample followed longitudinally for the next six months, we observed a temporal and spatial dissociation between changes observed at baseline (cluster mass permutation: pFWE < 0.05). Local activity and connectivity changes in widespread neocortical regions persisted throughout the studied time period (ANCOVAs vs. controls: pFDR < 0.05), with preliminary evidence linking these alterations to behavioral and psychological adaptations (interaction effect with postpartum time: uncorrected p < 0.05). In contrast, the initially reduced whole-brain connectivity of putamen-centered subcortical areas returned to control levels within six to nine weeks postpartum (linear and quadratic mixed linear models: pFDR < 0.05). The whole-brain spatial colocalization with hormone receptor distributions (Spearman correlations: pFDR < 0.05) and preliminary blood hormone associations (interaction effect with postpartum time: uncorrected p < 0.05) suggested that the postpartum restoration of progesterone levels may underlie this rapid normalization. These observations enhance our understanding of healthy maternal brain function, contributing to the identification of potential markers for pathological postpartum adaptation processes, which in turn could underlie postpartum psychiatric disorders.


Conflict of interest statement

The authors declare no competing interests.

Figures

Fig. 1
Fig. 1. Clusters of differing local activity (fALFF), local connectivity (LCOR), and global connectivity (GCOR) in the nulliparous and postpartum groups at baseline.
Cluster-level and whole-brain results from baseline (T0) rsfMRI analyses. Brain maps for each rsfMRI metric (rows) and each contrast (columns) show voxel-level negative log10-transformed p values overlaid by cluster-level results in darker shades (non-parametric cluster mass permutation). PP postpartum, NP nulliparous, fALFF fractional amplitude of low frequency fluctuations, LCOR local correlation, GCOR global correlation.
Fig. 2
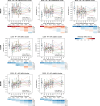
Fig. 2. Longitudinal development of rsfMRI clusters.
Development of baseline cluster-wise averaged local and global connectivity and activity metrics across 6 postpartum months. Boxplots: x-axes show time in weeks postpartum (dimensional scale), y-axes show the Z-standardized rsfMRI metric. Each dot represents one subject at one individual time point, lines connect longitudinal scans. Boxplots show the distribution across subjects at each time point (black dot = mean, middle line = median, boxes = quartile 1 and 3, whiskers = range if below 1.5 * interquartile range from quartile 1 or 3). Heatmaps show effect sizes (Hedge’s g) of within- and between-group comparisons, overlaid labels mark significances (filled star: q < 0.05, empty star: p < 0.05, none: p > 0.05). Significance of linear mixed models is printed in the lower right corner. fALFF fractional amplitude of low frequency fluctuations, LCOR local correlation, GCOR global correlation, PP postpartum, NP nulliparous, ns not significant.
Fig. 3
Fig. 3. Subject-level spatial colocalization between postpartum rsfMRI alterations and hormonal/neurotransmitter receptor densities.
Upper left: Baseline (T0) rsfMRI changes in postpartum women relative to the control cohort; average across subject-wise parcel-level Z score maps. E.g., for GCOR, the bright blue subcortical regions correpond to the initial GLM finding (PP < NP). Lower left: Parcellated receptor maps for which significant baseline colocalization with any rsfMRI metric was detected; normalized to range 0–1. E.g., the positive spatial colocalization of GCOR with PGR and OXTR is driven by decreased GCOR (PP < NP) and high PGR/OXTR density in subcortical regions. Upper right: Baseline analyses testing for colocalization between receptor distributions and rsfMRI data of each postpartum subject at baseline relative to the control group. X-axis: Z-transformed Spearman correlation coefficients, y-axis: rsfMRI metrics, scatter colors: colocalization strength. Lower right: Longitudinal analyses following up on each baseline results if associated group permutation q(norm) < 0.05 (filled stars). The plot design equals Fig. 2 with the y axis showing Z-transformed Spearman correlation coefficients. fALFF fractional amplitude of low frequency fluctuations, LCOR local correlation, GCOR global correlation, ns not significant.
Fig. 4
Fig. 4. Patterns of association over time between rsfMRI results and hormone levels as well as behavior.
Heatmaps: Results of linear mixed models to determine time-dependent associations between rsfMRI metrics (cluster-level results, spatial colocalizations with q < 0.05) and hormone levels (upper) as well as mother-child attachment and postpartum depression symptoms (lower). Heatmap colors represent standardized effect sizes of interaction effects between weeks postpartum and (upper) hormone levels to “predict” MRI estimates or (lower) MRI estimates to “predict” behavioral scales. Overlaid labels show p values (empty star: p < 0.05, no test survived false-discovery rate correction). The presented results are intended to identify general patterns of association rather than to interpret specific tests. Scatter-/Boxplots: Levels or scores, respectively, of the tested hormones (upper) and behavioral scales (lower) in the postpartum sample over time (see Fig. 2). fALFF fractional amplitude of low frequency fluctuations, LCOR local correlation, GCOR global correlation, PP postpartum, NP nulliparous, MPAS Maternal Postnatal Attachment Scale, EPDS Edinburgh Postnatal Depression Scale.

References

    1. Chechko N, Dukart J, Tchaikovski S, Enzensberger C, Neuner I, Stickel S. The expectant brain–pregnancy leads to changes in brain morphology in the early postpartum period. Cerebral Cortex. 2022;32:4025–38. - PMC - PubMed
    1. Nehls S, Losse E, Enzensberger C, Frodl T, Chechko N. Time-sensitive changes in the maternal brain and their influence on mother-child attachment. Transl Psychiatry. 2023;14:84. - PMC - PubMed
    1. Galea LAM, Frokjaer VG. Perinatal depression: embracing variability toward better treatment and outcomes. Neuron. 2019;102:13–16. - PubMed
    1. Sacher J, Chechko N, Dannlowski U, Walter M, Derntl B. The peripartum human brain: current understanding and future perspectives. Front Neuroendocrinol. 2020;59:100859. - PubMed
    1. Pritschet L, Santander T, Taylor CM, Layher E, Yu S, Miller MB, et al. Functional reorganization of brain networks across the human menstrual cycle. NeuroImage. 2020;220:117091. - PubMed

LinkOut - more resources