. 2024 May 20;17(1):232.
doi: 10.1186/s13071-024-06314-5.

Galectin-receptor interaction: a key player in liver fibrosis induced by Schistosoma japonicum infection

Affiliations

Galectin-receptor interaction: a key player in liver fibrosis induced by Schistosoma japonicum infection

Ziyun Huang et al. Parasit Vectors. .

Abstract

Background: Schistosoma japonicum eggs lodge in the liver and induce a fibrotic granulomatous immune response in the liver of host. Galectin 3 (Gal-3) is a protein implicated in fibrosis in multiple organs. However, the pathology and molecular mechanisms promoting hepatic granuloma formation remain poorly understood.

Methods: To investigate the effect of blocking galectin-receptor interactions by α-lactose on liver immunopathology in mice with S. japonicum infection, C57BL/6 mice were infected with S. japonicum and alpha (α)-lactose was intraperitoneally injected to block the interactions of galectins and their receptors.

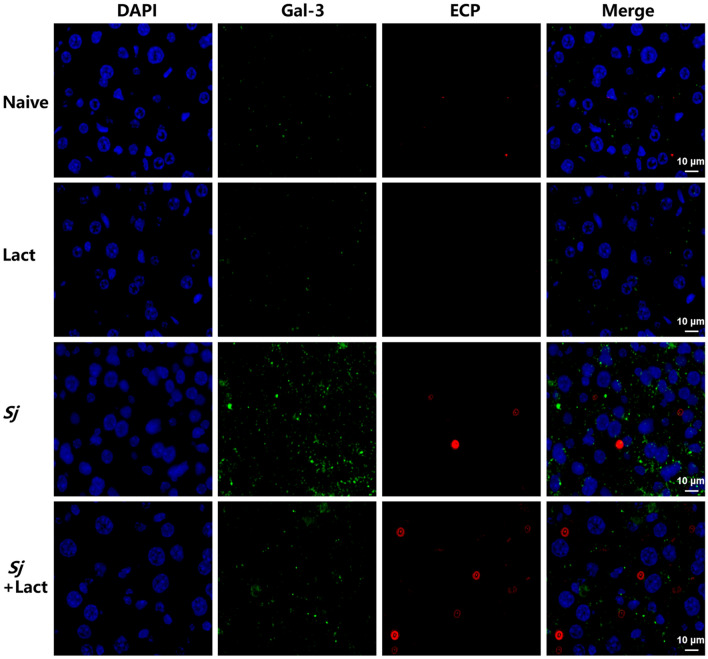
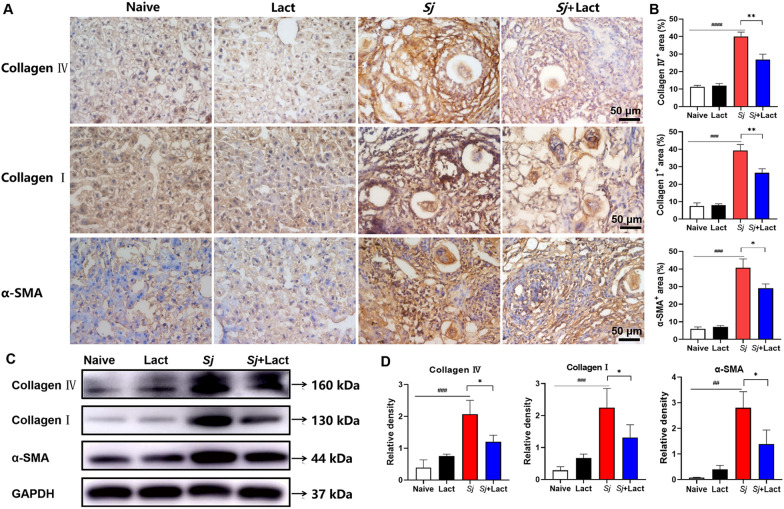
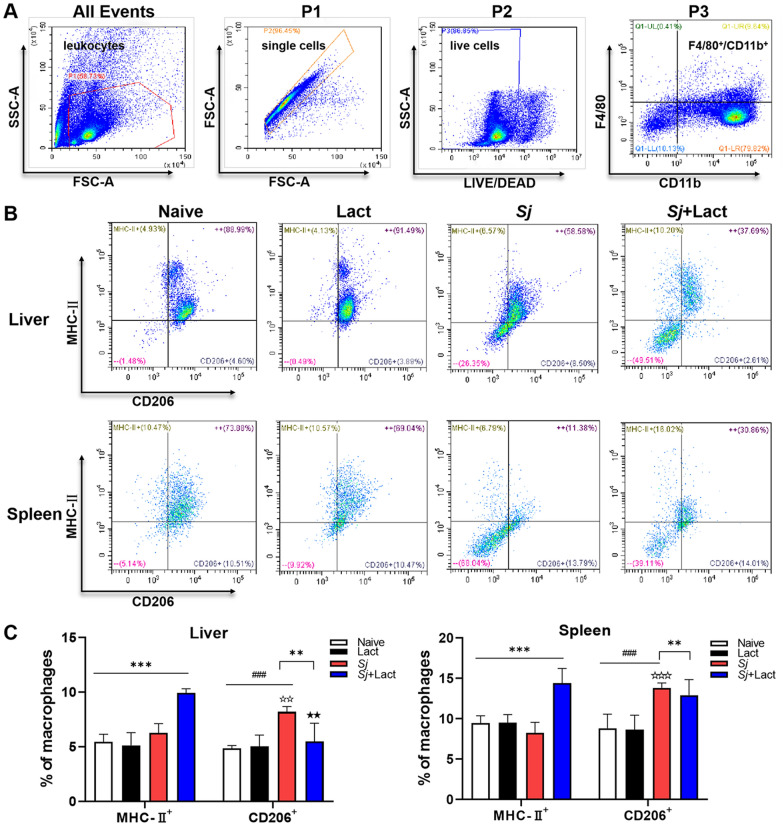
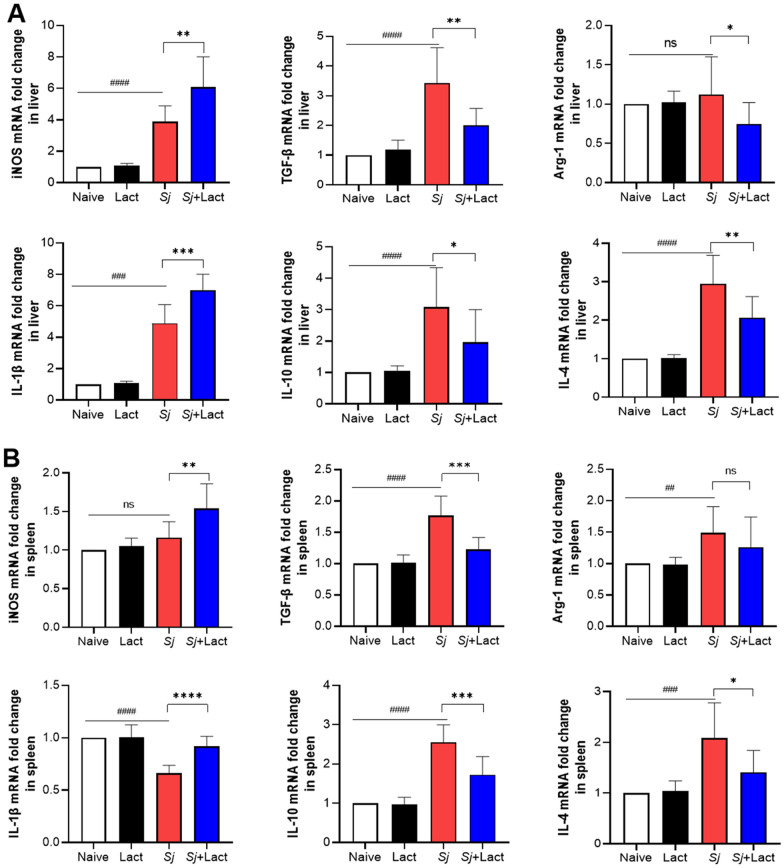
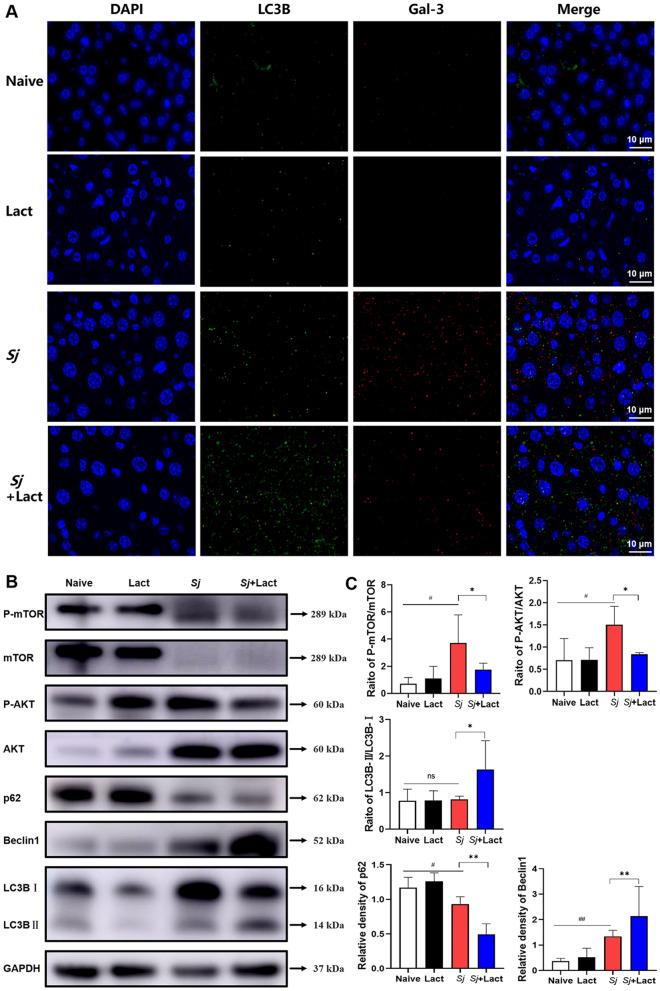
Results: Compared with S. japonicum-infected mice, there were significantly decreased Gal-3 mRNA and protein expression levels, decreased intensity of Gal-3 fluorescence in the liver, decreased serum ALT and AST levels, decreased egg numbers of S. japonicum in the liver section, attenuated hepatic and spleen pathology, and alleviated liver fibrosis accompanied with decreased protein expression levels of fibrosis markers [α-smooth muscle actin (α-SMA), collagen I, and collagen IV] in the liver of S. japonicum-infected mice blocked galectin-receptor interactions with hematoxylin-eosin staining, Masson's trichrome staining, immunohistochemistry, or Western blot analysis. Compared with S. japonicum-infected mice, blocking galectin-receptor interactions led to increased eosinophil infiltration and higher eosinophil cationic protein (ECP) expression in the liver, accompanied by increased mRNA levels of eosinophil granule proteins [ECP and eosinophil peroxidase (EPO)], IL-5, CCL11, and CCR3 in the liver and decreased mRNA levels of Gal-3 and M2 macrophage cytokines (TGF-β, IL-10, and IL-4) in the liver and spleen by using quantitative real-time reverse transcription-polymerase chain reaction. In addition, there were increased Beclin1 protein expression and protein expression ratio of LC3B-II/LC3B-I and decreased p62 protein expression and protein expression ratios of phospho-mTOR/mTOR and phospho-AKT/AKT by Western blot; increased double-labeled F4/80+/LC3B+ cells by immunofluorescence staining; increased M1 macrophage polarization in the liver of S. japonicum-infected mice blocked galectin-receptor interactions by flow cytometric analysis and immunofluorescence staining.

Conclusions: Our data found that blockage of galectin-receptor interactions downregulated Gal-3, which in turn led to reduced liver functional damage, elevated liver eosinophil recruitment, promoted macrophage autophagy through the Akt/mTOR signaling pathway, and alleviated liver pathology and fibrosis. Therefore, Gal-3 plays a pivotal role during S. japonicum infection and could be a target of pharmacologic potential for liver fibrosis induced by S. japonicum infection.

Keywords: Schistosoma japonicum; Galectin-receptor interactions; Liver fibrosis; Macrophage autophagy; Mice.


Conflict of interest statement

The authors declare that they have no competing interests.

Figures

Fig. 1
Fig. 1
The expression of Gal-1, Gal-3, and Gal-9 in the livers of different groups of mice. A Immunohistochemical staining of Gal-1, Gal-3, and Gal-9 positive cells in the livers of different groups of mice. Original magnification 400 × (scale bar = 50 µm). B The numbers of Gal-1, Gal-3, and Gal-9 positive cells were counted in five random fields to quantify them. Data are expressed as mean ± SD (n = 4). C The protein expression levels of Gal-1, Gal-3, and Gal-9 in the liver were detected by Western blot. D Densitometric analysis of Gal-1, Gal-3, and Gal-9 normalized to the endogenous control (GAPDH) and expressed as fold change. Data are expressed as mean ± SD (n = 4). E The mRNA expression levels of Gal-1, Gal-3, and Gal-9 in the liver was detected by qRT-PCR (n = 8). ##P < 0.01, ###P < 0.001, ####P < 0.0001, Sj group compared with naive group and lact group; *P < 0.05, **P < 0.01, and ***P < 0.001, Sj + lact group compared with Sj group
Fig. 2
Fig. 2
Blockage of galectin-receptor interactions alleviated the liver function damage of S. japonicum-infected mice. A Gross specimens of liver and spleen of different groups of mice. B The liver indexes of different groups of mice. C The spleen indexes of different groups of mice. D Serum ALT levels of different groups of mice. E Serum AST levels of different groups of mice. Results are expressed as mean ± SD (n = 7). ##P < 0.01, ###P < 0.001, ####P < 0.0001, Sj group compared with naive group and lact group; *P < 0.05, **P < 0.01, Sj + lact group compared with Sj group
Fig. 3
Fig. 3
The liver and spleen histopathology of different groups of mice. Mice were infected with 30 Schistosoma japonicum cercariae and killed at 8 weeks p.i. A Representative microscopic pictures of the liver sections of different groups stained with H&E. No histological change was observed in the liver and spleen of naive group and lact group; egg granulomas and a large number of eosinophils around S. japonicum egg granulomas were observed in the liver and spleen of Sj group and Sj + lact group. Original magnifications of the images are 400 × (scale bar = 20 µm) and 1000 × (scale bar = 9 µm). B Eosinophil count analysis in the liver tissues. Data are represented as mean ± SD. There were six mice per group. C The mRNA expressions of ECP, EPO, IL-5, CCL11, and CCR3 in the livers of different groups of mice at 8 weeks p.i. Values are means from triplicate measurements, and data are presented as means ± SD (n = 10). D The egg numbers of S. japonicum in the livers. Data are represented as mean ± SD (n = 5). E Histopathological score analysis of the liver tissues. F Representative microscopic pictures of the spleen sections of different groups of mice stained with H&E. G Histopathological score analysis of the spleen tissues. Original magnification 200 × (scale bar = 100 µm). Data are represented as mean ± SD (n = 4). ###P < 0.001 and ####P < 0.0001, Sj group compared with naive group and lact group; *P < 0.05 and **P < 0.01, Sj + lact group compared with Sj group
Fig. 4
Fig. 4
Double immunofluorescence staining of Gal-3 and ECP in the liver tissues of different groups of mice. Fluorescence microscopy observation of liver tissues in different groups of mice stained with anti-Gal-3 (green) and anti-ECP (eosinophils marker, red). Tissues were counterstained with DAPI (blue). Original magnification 1000 × (scale bar = 10 µm)
Fig. 5
Fig. 5
Hepatic fibrosis was relieved in Schistosoma japonicum-infected mice with blockage of galectin-receptor. A Representative liver granulomas were observed by Massonʼs trichrome staining at 8 weeks p.i. after S. japonicum infection. Collagen is in blue color. Original magnification 100 × (scale bar = 200 µm). B Collagen deposition positive areas were digitized and analyzed on Image Pro Plus software. Results are expressed as mean ± SD (n = 6). ####P < 0.0001, Sj group compared with naive group and lact group; ***P < 0.001, Sj + lact group compared with Sj group
Fig. 6
Fig. 6
Immunohistochemical staining of α-SMA, collagen I, and collagen IV in the liver. A Immunohistochemical staining of α-SMA, collagen I, and collagen IV positive cells in the livers of different groups of mice. Original magnification 400 × (scale bar = 50 µm). B α-SMA, collagen I, and collagen IV positive areas were digitized and analyzed by Image Pro Plus software. Data are expressed as mean ± SD (n = 4). C The protein expression levels of α-SMA, collagen I, and collagen IV in the liver were detected by Western blot. D Densitometric analysis of α-SMA, collagen I, and collagen IV normalized to GAPDH and expressed as fold change. Data are expressed as mean ± SD (n = 4). ##P < 0.01, ###P < 0.001, ####P < 0.0001, Sj group compared with naive group and lact group; *P < 0.05 and **P < 0.01, Sj + lact group compared with Sj group
Fig. 7
Fig. 7
Double immunofluorescence staining of macrophage subtypes in the livers of different groups of mice. A Liver sections of different groups of mice were co-stained with anti-F4/80 (macrophage marker, red) and anti-MHC-II (M1 marker, green). DAPI was used to visualize nuclei (blue). Original magnification 600 × (scale bar = 20 µm). B F4/80 positive cells and MHC-II positive cells in the liver tissue sections counted in five random fields were quantified. Data are shown as the means ± SD (n = 4). C Liver sections of different groups of mice were co-stained with anti-F4/80 (red) and anti-CD206 antibodies (M2 marker, green). DAPI was used to visualize nuclei (blue). Original magnification 600 × (scale bar = 20 µm). D F4/80 positive cells and CD206 positive cells in the liver tissue sections counted in five random fields were quantified. Data are shown as the means ± SD (n = 4). ####P < 0.0001, Sj group compared with naive group and lact group; ****P < 0.001, Sj + lact group compared with Sj group
Fig. 8
Fig. 8
Flow cytometry for M1/M2 macrophages in the liver and spleen of different groups of mice. A Gating strategy of the flow cytometry data. P1 represented the leukocyte subsets gated from all the events; P2 represented the single cells gated from the P1; P3 represented the live cells gated from the P2; F4/80+/CD11b+ cells (Q1-UR, top right corner) were the macrophage subtypes gated from the cells of the P3. B Representative data of the M1/M2 macrophage subtypes in different groups. The quadrants show MCH-II+/CD206 cells (MCH-II+, upper left), MCH-UII+/CD206+ cells (+ +, upper right), MCH-II/CD206 cells (– –, lower left), and MCH-II/CD206+ cells (CD206+, lower right). C The percentage of MCHII+/CD206 cells and MCH-II/CD206+ cells in the liver and spleen. Data are shown as the means ± SD (n = 4). ###P < 0.001, Sj group compared with naive group and lact group; **P < 0.01 and ***P < 0.001, Sj + lact group compared with naive group, lact group, and Sj group. ☆☆P < 0.01 and ☆☆☆P < 0.001, MCH-II+ cells compared with CD206+ cells in Sj group; ★★P < 0.01, MCH-II+ cells compared with CD206+ cells in Sj + lact group
Fig. 9
Fig. 9
mRNA expression levels of M1 and M2 macrophage cytokines of different groups of mice. A mRNA expression levels of M1 and M2 macrophage cytokines in the liver. B mRNA expression levels of M1 and M2 macrophage cytokines in the spleen. Values are means from triplicate measurements, and data are presented as means ± SD (n = 10); Y axis represents the mRNA expression levels of different genes. ns: no significance; ##P < 0.01, ###P < 0.001, and ####P < 0.0001, Sj group compared with naive group and lact group; *P < 0.05, **P < 0.01, ***P < 0.001, and ****P < 0.0001, Sj + lact group compared with Sj group
Fig. 10
Fig. 10
Correlation analysis between the mRNA expression levels detected in the livers of different groups of mice. Correlation analysis between the mRNA expression levels of Gal-3 and iNOS/IL-1β/TGF-β/IL-10/Arg-1/IL-4 in the livers of Sj group A and Sj + lact group B (n = 8). The r value generates the theoretical line of best fit, and the P value indicates the significance of the correlation
Fig. 11
Fig. 11
Effects of α-lactose on autophagy Akt/mTOR signaling pathway in the livers of different groups of mice. A Liver sections of different groups of mice were co-stained with anti-Gal-3 (red) and anti-LC3B (autophagy marker, green). DAPI was used to visualize nuclei (blue). Original magnification 1000 × (scale bar = 10 µm). B Western blot analysis for p-mTOR, mTOR, p-AKT, AKT, p62, Beclin1, LC3B, and GAPDH. C p-mTOR, p-AKT, and LC3B-II band density normalized to mTOR, AKT, and LC3B-I, respectively; the relative densitometry of p62 and Beclin1 (relative to the endogenous control, GAPDH) expressed as fold change. The values are expressed as mean ± SD (n = 4). ns: no significance; #P < 0.05 and ##P < 0.01, Sj group compared with naive group and lact group; *P < 0.05 and **P < 0.01, Sj + lact group compared with Sj group
Fig. 12
Fig. 12
Double immunofluorescence staining of F4/80 and LC3B in the liver tissues of different groups of mice. A Liver sections of different groups of mice were co-stained with anti-F4/80 (macrophage marker, red) and anti-LC3B (autophagy marker, green). DAPI was used to visualize nuclei (blue). Original magnification 1000 × (scale bar = 10 µm). B F4/80+/LC3B+ cells in the liver tissue sections counted in five random fields were quantified. Data are shown as the means ± SD (n = 4). ###P < 0.001, Sj group compared with naive group and lact group; ***P < 0.001, Sj + lact group compared with Sj group

References

    1. Colley DG, Bustinduy AL, Secor WE, King CH. Human schistosomiasis. Lancet. 2014;383:2253–2264. doi: 10.1016/S0140-6736(13)61949-2. - DOI - PMC - PubMed
    1. World Health Organization. Schistosomiasis (Bilharzia). https://www.who.int/health-topics/schistosomiasis#tab=tab_1
    1. Hams E, Aviello G, Fallon PG. The Schistosoma granuloma: friend or foe? Front Immunol. 2013;4:89. doi: 10.3389/fimmu.2013.00089. - DOI - PMC - PubMed
    1. Johannes L, Jacob R, Leffler H. Galectins at a glance. J Cell Sci. 2018;131:208884. doi: 10.1242/jcs.208884. - DOI - PubMed
    1. Maeda N, Kawada N, Seki S, Arakawa T, Ikeda K, Iwao H, et al. Stimulation of proliferation of rat hepatic stellate cells by galectin-1 and galectin-3 through different intracellular signaling pathways. J Biol Chem. 2003;278:18938–18944. doi: 10.1074/jbc.M209673200. - DOI - PubMed

Substances