. 2024 Dec 3;147(12):4169-4184.
doi: 10.1093/brain/awae167.

Scn1a haploinsufficiency in the prefrontal cortex leads to cognitive impairment and depressive phenotype

Affiliations

Scn1a haploinsufficiency in the prefrontal cortex leads to cognitive impairment and depressive phenotype

Maurizio S Riga et al. Brain. .

Abstract

Altered development and function of the prefrontal cortex (PFC) during adolescence is implicated in the origin of mental disorders. Deficits in the GABAergic system prominently contribute to these alterations. Nav1.1 is a voltage-gated Na+ channel critical for normal GABAergic activity. Here, we studied the role of Nav1.1 in PFC function and its potential relationship with the aetiology of mental disorders. Dysfunction of Nav1.1 activity in the medial PFC (mPFC) of adolescent mice enhanced the local excitation/inhibition ratio, resulting in epileptic activity, cognitive deficits and depressive-like behaviour in adulthood, along with a gene expression profile linked to major depressive disorder (MDD). Additionally, it reduced extracellular serotonin concentration in the dorsal raphe nucleus and brain-derived neurotrophic factor expression in the hippocampus, two MDD-related brain areas beyond the PFC. We also observed alterations in oscillatory activity and impaired hippocampal-mPFC coherence during sleep. Finally, we found reduced expression levels of SCN1A, the gene encoding Nav1.1, in post-mortem PFC samples from human MDD subjects. Collectively, our results provide a novel mechanistic framework linking adolescence-specific alterations in Nav1.1 function in the PFC to the pathogenesis of epilepsy and comorbidities such as cognitive impairment and depressive disorders.

Keywords: GABAergic interneurons; Nav1.1 channel; excitatory/inhibitory balance (E/I balance); mayor depressive disorder; prefrontal cortex.


Conflict of interest statement

The authors declare no competing interests.

Figures
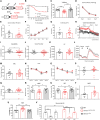
Figure 1
Figure 1
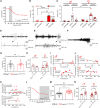
Phenotypic characterization of Scn1a+/A1783V  (PFC)  mice 2–6 months after Nav1.1 channel dysfunction in the medial prefrontal cortex (mPFC). (A) Generation of Scn1a+/A1783V (PFC) mice by Cre-LoxP recombination to selectively induce functional loss of Nav1.1 in the mPFC. (B) Survival curve for wild-type (WT), Scn1a+/A1783V (PFC) and Scn1aA1783V (PFC)/A1783V (PFC) mice; all the animals used in the present study were included (Supplementary Table 1 and Supplementary Fig. 2) (WT, n = 35 males, 32 females; Scn1a+/A1783V (PFC), n = 48 males, 45 females; Scn1a A1783V (PFC)/A1783V (PFC), n = 4 males, 4 females). (C) Y-maze for working memory analysis [WT, n = 8 males, 7 females; Scn1a+/A1783V (PFC), n = 17 males, 10 females]. (D and E) Barnes maze (training and probe) ([WT, n = 7 males, 7 females; Scn1a+/A1783V (PFC), n = 15 males, 8 females]. (F and G) Contextual fear conditioning (FC, training and test) for associative and spatial memory/learning analysis. In the training section (F), % freezing was calculated during exploration (E) and stimulations (S1–S4) [WT, n = 5 males, 6 females; Scn1a+/A1783V (PFC), n = 12 males, 7 females]. (H) Fear extinction after cued fear conditioning test [WT, n = 6 males, 7 females; Scn1a+/A1783V (PFC), n = 11 males, 5 females]. Note that extinction on Day 3 was not performed. (I) Social interaction (preference of interaction with other mice versus an object) and (J) social novelty (preference of interaction with familiar versus novel mice) evaluated in the three-chamber test [WT, n = 7 males, 7 females; Scn1a+/A1783V (PFC), n = 17 males, 10 females]. (K) Spontaneous locomotor activity measured in the open field (OF) test [WT, n = 8 males, 7 females; Scn1a+/A1783V (PFC), n = 17 males, 10 females]. (L) Amphetamine (2.5 mg/kg intraperitoneally) sensitivity test [WT, n = 7 males, 6 females; Scn1a+/A1783V (PFC), n = 7 males, 6 females]. (M) Anxiety behaviour evaluated in the dark and light box [WT, n = 8 males, 7 females; Scn1a+/A1783V (PFC), n = 17 males, 10 females]. (N) Conditional taste avoidance (CTA) [WT, n = 3 males, 4 females; Scn1a+/A1783V (PFC), n = 7 males, 3 females] and (O) Latent inhibition (LI, conditional taste aversion) [WT, n = 4 males, 3 females; Scn1a+/A1783V (PFC), n = 8 males, 3 females] tests. (P and Q) Prepulse Inhibition (PPI) test to evaluate sensorimotor gating [WT, n = 7 males, 7 females; Scn1a+/A1783V (PFC), n = 15 males, 6 females]. (R) Marble burying test (MBT) for repetitive task performance [WT, n = 6 males, 5 females; Scn1a+/A1783V (PFC), n = 13 males, 5 females]. (S) Sucrose preference test (SPT) for anhedonia evaluation ([WT, n = 6 males, 7 females; Scn1a+/A1783V (PFC), n = 13 males, 5 females]. (T) Novelty-Suppressed Feeding Test (NFST) for hyponeophagia related to stress [WT, n = 5 males, 5 females; Scn1a+/A1783V (PFC), n = 13 males, 4 females] and (U) tail suspension test (TST) for resiliency to stress and depression analysis [WT, n = 6 males, 7 females; Scn1a+/A1783V (PFC), n = 13 males, 5 females]. Note that an additional control group (Scn1a+/flox, n = 11 males, 3 females) was included in those tests where we observed significant differences between WT and Scn1a+/A1783V (PFC) mice. (V) Reversals induced by antidepressant drugs (AD; ketamine, KET and citalopram, CIT) on the TST performance of Scn1a+/A1783V (PFC) mice [Vehicle (VEH) group: WT, n = 6 males, 7 females; Scn1a+/A1783V (PFC), n = 5 males, 4 females; CIT group: WT, n = 5 males, 8 females; Scn1a+/A1783V (PFC), n = 3 males, 6 females; KET group: WT, n = 6 males, 7 females; Scn1a+/A1783V (PFC), n = 4 males, 5 females]. Statistical significance: *P < 0.05, **P < 0.01, ***P < 0.001, ****P < 0.0001 WT versus Scn1a+/A1783V (PFC); +++P < 0.001, ++++P < 0.0001 VEH versus CIT or KET.
Figure 2
Figure 2
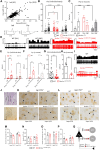
Scn1a+/A1783V  (PFC)  mice displays epileptic activity in parallel to depressive-like alterations. (A) Survival curve for Scn1a+/A1783V (PFC) mice. Grey shadow indicates the time window (5–9 weeks post-AAV injection) when epileptic activity (by EEG) and depressive-like alterations [by tail suspension test (TST)] were assessed. (B) Quantification of spikes and epileptiform discharges in Scn1a+/A1783V (PFC) mice during active and resting state and (C) gender differences [Scn1a+/A1783V (PFC), n = 8 males, 9 females]. (DF) Representative recording sections showing spikes (D), epileptiform discharges (E) and seizures (F). (G) TST performed just after EEG recordings (5–9 weeks post-AAV injection) and (H) gender differences [wild-type (WT), n = 11 males, 7 females; Scn1a+/A1783V (PFC), n = 8 males, 10 females]. (I and J) Linear regression tests showing correlations between spikes and TST immobility time during active and resting states. (K) Linear regression tests showing correlations between seizure frequency and TST immobility time of the whole cohort (top) or the six mice that developed seizures (bottom). (L) Survival curve for Scn1a+/A1783V (PFC) mice. Grey shadow indicates the time window (from 16 weeks post-AAV injection) when depressive-like alterations (TST) were evaluated. (M) Alterations in the TST and (N) gender differences 16 weeks post-AAV injection. Note that both graphs include mice subjected to the TST presented in Fig. 1U  and V [WT, n =12 males, 14 females; Scn1a+/A1783V (PFC), n =18 males, 9 females]. **P < 0.01, ***P < 0.001, ****P < 0.0001 WT versus Scn1a+/A1783V (PFC); #P < 0.05; ##P < 0.01; ####P < 0.0001 active versus resting states; ααααP < 0.0001 spikes versus discharges.
Figure 3
Figure 3
Increased excitatory/inhibitory (E/I) balance in the medial prefrontal cortex of Scn1a+/A1783V  (PFC)  mice. (A) Identification of putative pyramidal (Pyr) and GABAergic interneurons (Inh) according to their action potential characteristics (Supplementary material ‘Materials and methods’ section and Supplementary Figs 3 and 4; hyperpolarization and depolarization widths, in ms, are indicated by double ended arrows). Two representative examples of Pyr and Inh action potentials are also shown. (B and C) Effect of Nav1.1 activity dysfunction on firing rate of putative pyramidal neurons in the medial prefrontal cortex (mPFC). Bar graphs showing the mean values of all the recorded neurons (B) and the averaged mean discharge per mouse (C) in each experimental condition [control (SAL) and gabazine, a GABAA-R antagonist (GBZ)]. [(B) SAL group: wild-type (WT), n = 62, Scn1a+/A1783V (PFC), n = 64, Scn1a+/flox, n = 43, GBZ group: WT, n = 74, Scn1a+/A1783V (PFC), n = 43, Scn1a+/flox, n = 68) and (C) WT, n = 3 males, 3 females; Scn1a+/A1783V (PFC), n = 3 males, 3 females; Scn1a+/flox, n = 2 males, 3 females]. (D) Representative recordings (2-min each) of putative pyramidal neurons for each genotype and treatment. (E and F) Effect of Nav1.1 activity dysfunction on the discharge of putative pyramidal neurons in the prelimbic (PrL) and infralimbic (IL) subdivision of the PFC. Bar graphs showing the mean values of all the recorded neurons (E) and the averaged mean discharge per mouse (F) in each experimental condition (SAL and GBZ). [(E) PrL: WT, n = 26; Scn1a+/A1783V (PFC), n = 32 or IL: WT, n = 35; Scn1a+/A1783V (PFC), n = 31 and (F) WT, n = 3 males, 3 females; Scn1a+/A1783V (PFC), n = 3 males, 3 females]. (G and H) Effect of Nav1.1 hypofunction on putative inhibitory (Inh) GABAergic interneurons and (I) representative recordings. As for pyramidal neurons, data were statistically treated as individual firing discharge (G) [WT, n = 18; Scn1a+/A1783V(PFC), n = 23] and as averaged firing rate per mouse [WT, n = 4; Scn1a+/A1783V (PFC), n = 5] (H). Remarkably, two-way ANOVAs of both data sets yielded essentially the same result. (J) Cresyl-violet staining showing regions of interest (ROIs) for the quantification of Egr-1 positive cells in layers I, II/III and V/VI of the mPFC. (K and L) Erg1 mRNA colocalization with parvalbumin (PV) (K) and somatostatin (STT) (L) positive interneurons. (MP) Bar graphs showing the number of double Erg1+/PV+ (M) and PV+ (N) cells and the number of double Erg1+/STT+ (O) and STT+ (P) cells [WT, n = 4–5 females; Scn1a+/A1783V (PFC), n = 5 females]. (Q) Schematic representation of a layer V/VII pyramidal neuron in the mPFC of Scn1a+/A1783V (PFC). Note that PV inhibitory tone might be decreased, according to our data. *P < 0.05, **P < 0.01, ***P < 0.001, ****P < 0.0001 WT versus Scn1a+/A1783V (PFC); +P < 0.05, ++P < 0.01, +++P < 0.001, ++++P < 0.0001 SAL versus GBZ; aP = 0.054 PrL versus IL in Scn1a+/A1783V (PFC).
Figure 4
Figure 4
Alterations in medial prefrontal cortex rhythms and hippocampal-prefrontal coherence in Scn1a+/A1783V  (PFC)  mice. (AD) Examples of representative EEG recordings (5-min segments) and their corresponding spectrograms (top) in the medial prefrontal cortex (mPFC) and dorsal hippocampus (dHPC) of wild-type (WT, black) and Scn1a+/A1783V (PFC) (red) mice during active (A and B) and resting (C and D) states. Graphic representations of mPFC and dHPC power spectra, as well as dHPC-mPFC cohereograms, for each min of the selected segments are also shown (bottom). Dotted lines indicate delta (0.5–4 Hz) and theta (4–12 Hz) wave intervals. (EJ) Graphs showing averaged relative power spectra and coherence values (medians ± confidence intervals) from WT (n = 3 males, 3 females) and Scn1a+/A1783V (PFC) (n = 3 males, 3 females) mice. Power values were represented as relative power (%), whereas coherence values interval was from 0 (minimum) to 1 (maximum). (EG) mPFC, dHPC power spectra and dHPC-mPFC coherence (COH) during active state, respectively. (HJ) mPFC, dHPC power spectra and dHPC-mPFC coherence during resting state, respectively. *P ≤ 0.05, **P < 0.01, WT versus Scn1a+/A1783V (PFC).
Figure 5
Figure 5
Alterations in dorsal raphe serotonin neurotransmission and hippocampal BDNF expression in Scn1a+/A1783V (PFC)  mice. (A) Schematic representation of reciprocal connections between medial prefrontal cortex (mPFC) and dorsal raphe (DR). 1A, 2A, 1B = serotonin (5-HT) receptors; Glu = glutamate receptors; GABAA and GABAB = GABA receptors. (B) 5-HT basal values in DR in Scn1a+/A1783V (PFC) compared with the control group. (C) Effect of local infusion of bicuculline (BIC, GABAA receptor antagonist, 30 μM) by reverse dialysis on 5-HT extracellular concentrations in the DR of Scn1a+/A1783V (PFC) and wild-type (WT) mice [WT, n = 1 male and 10 females; Scn1a+/A1783V (PFC), n = 7 females]. (D) Representative coronal slices showing BDNF mRNA expression in the dorsal hippocampus (dHPC). (EG) BDNF mRNA levels in hippocampal CA1 (E), CA2/3 (F) and dentate gyrus (DG) (G). [WT, n = 4 females; Scn1a+/A1783V (PFC), n = 4 females]. *P < 0.05 and **P < 0.01, WT versus Scn1a+/A1783V (PFC); P < 0.001 two-way ANOVA Genotype × Time interaction in C.
Figure 6
Figure 6
Differential expression profile in Scn1a+/A1783V  (PFC)  mice. RNA-sequencing was performed on medial prefrontal cortex (mPFC) samples and analysed for differential gene expression. (A) Principal component (PC) analysis was used to examine the relationships between wild-type (WT) and Scn1a+/A1783V (PFC) samples; n = 4 independent replicates. (B) MA-plot, generated by the DESeq2 tool, showing the log2 fold-change (thresholds of −0.5 and 0.5) attributable to Nav1.1 deficit in the mPFC over the mean of normalized counts for all the samples. (C) Gene Ontology (GO) enrichment analysis of the top 100 differentially expressed genes. Numbered dots show the most significant GO terms associated to molecular function (MF:GO); biological process (BP:GO); cellular component (CC:GO); and biological pathways (KEGG and Reactome). Table 1 shows the corresponding number and ID of the top enriched significant terms for each category with their adjusted significance value (Bonferroni corrected P-values). (D) Heat map showing expression levels of selected significant transcripts related to major depressive disorder (MDD) that were differentially expressed in Scn1a+/A1783V (PFC) mice. (E) Protein-protein interaction network analysis of the top 100 differentially expressed genes associated with MDD. Degree and betweenness topological parameters were obtained for each node (red-blue colour scale). (F) GO enrichment analysis of those node genes with the highest degree and betweenness scores (red filled circles in E). Table 1 shows a selection of significant GO terms corresponding to the numbered dots in C. (G) GO enrichment analysis of the genes included in the satellite network (framed in cyan in E), clustering cell adhesion and extracellular matrix proteins. Table 1 shows a selection of significant GO terms corresponding to the numbered dots in C.
Figure 7
Figure 7
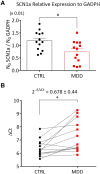
SCN1A expression levels in the prefrontal cortex of control and major depressive disorder patients. (A) Real-time quantitative (RT) PCR analysis of SCN1A expression relative to GADPH in control (CTRL) subjects and patients with major depressive disorder (MDD). (B) Representation of the RT-PCR ΔCt values for SCN1A. Grey lines link matched samples from control and MDD individuals of similar age, sex and race (see the Supplementary material ‘Materials and methods’ section and Supplementary Table 5) to calculate the fold-change using the 2−ΔΔCt method. *P < 0.05 wild-type versus Scn1a+/A1783V (PFC); two-sided Mann–Whitney test.

References

    1. Insel T, Cuthbert B, Garvey M, et al. Research domain criteria (RDoC): Toward a new classification framework for research on mental disorders. Am J Psychiatry. 2010;167:748–751. - PubMed
    1. Luscher B, Fuchs T. GABAergic control of depression-related brain states. Adv Pharmacol. 2015;73:97–144. - PMC - PubMed
    1. Grace AA. Dysregulation of the dopamine system in the pathophysiology of schizophrenia and depression. Nat Rev Neurosci. 2016;17:524–532. - PMC - PubMed
    1. Marazziti D. Understanding the role of serotonin in psychiatric diseases. F1000Res. 2017;6:180. - PMC - PubMed
    1. Ferguson BR, Gao WJ. PV interneurons: Critical regulators of E/I balance for prefrontal cortex-dependent behavior and psychiatric disorders. Front Neural Circuits. 2018;12:37. - PMC - PubMed