. 2024 Apr 26;27(6):109821.
doi: 10.1016/j.isci.2024.109821. eCollection 2024 Jun 21.

Hypomethylation-enhanced CRTC2 expression drives malignant phenotypes and primary resistance to immunotherapy in hepatocellular carcinoma

Affiliations

Hypomethylation-enhanced CRTC2 expression drives malignant phenotypes and primary resistance to immunotherapy in hepatocellular carcinoma

Ruizhi Zhang et al. iScience. .

Abstract

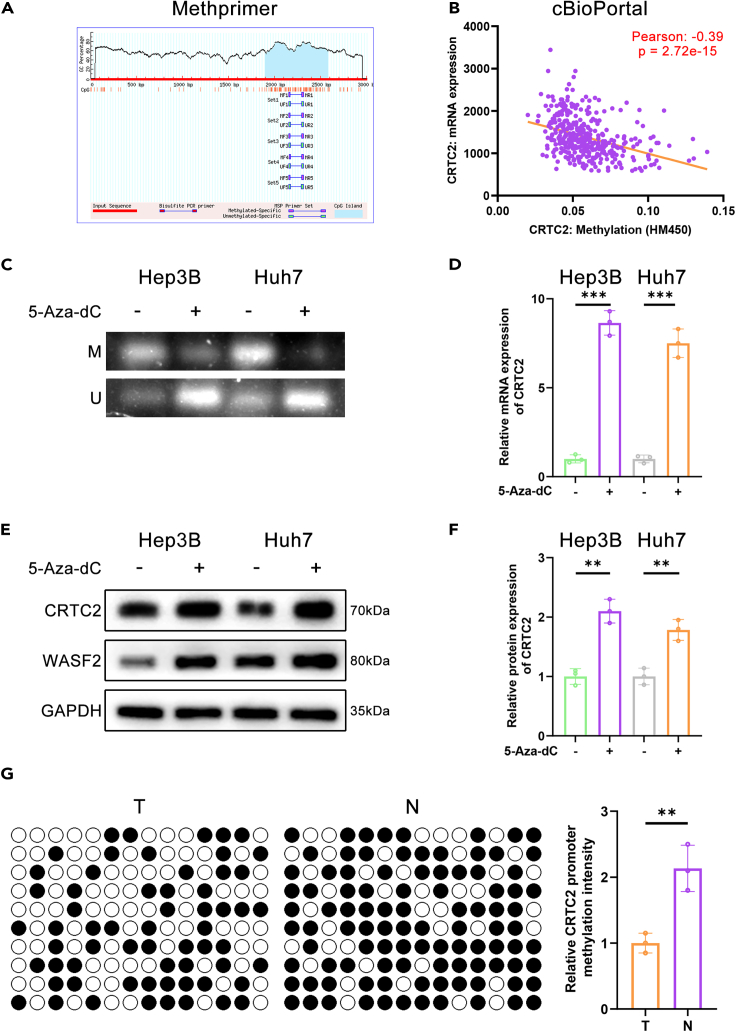
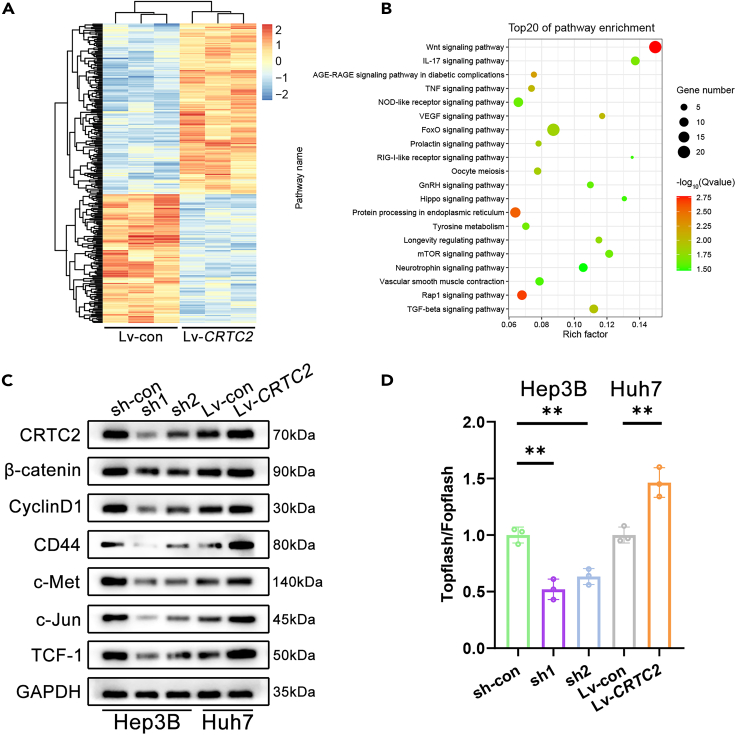
The cyclic AMP-responsive element-binding protein (CREB)-regulated transcription coactivator 2 (CRTC2) is a crucial regulator of hepatic lipid metabolism and gluconeogenesis and correlates with tumorigenesis. However, the mechanism through which CRTC2 regulates hepatocellular carcinoma (HCC) progression is largely unknown. Here, we found that increased CRTC2 expression predicted advanced tumor grade and stage, as well as worse prognosis in patients with HCC. DNA promoter hypomethylation led to higher CRTC2 expression in HCC. Functionally, CRTC2 contributed to HCC malignant phenotypes through the activated Wnt/β-catenin pathway, which could be abrogated by the small-molecular inhibitor XAV-939. Moreover, Crtc2 facilitated tumor growth while concurrently downregulating the PD-L1/PD-1 axis, resulting in primary resistance to immunotherapy. In immunocompetent mice models of HCC, targeting Crtc2 in combination with anti-PD-1 therapy prominently suppressed tumor growth by synergistically enhancing responsiveness to immunotherapy. Collectively, targeting CRTC2 might be a promising therapeutic strategy to sensitize immunotherapy in HCC.

Keywords: Cancer; Immunology; Molecular biology.


Conflict of interest statement

The authors declare no competing interests.

Figures

None
Graphical abstract
Figure 1
Figure 1
CRTC2 is overexpressed in HCC and correlated with poor prognosis (A) Dot plot showing the mRNA expression levels of CRTC2 in HCC tissues compared to normal liver tissues from the TCGA database. (B) Dot plots demonstrating stage-dependent expression of CRTC2 during HCC progression in the GSE6764 dataset. (C and D) Upregulated CRTC2 mRNA expression was significantly associated with patient tumor grade and stage in HCC. Tumor grade information was not available for 14 samples and undetermined for 5 samples. Cancer stage information was not available for 31 samples. (E and F) Kaplan-Meier analysis showing the overall survival and disease-free survival of patients with diverse CRTC2 expression. (G and H) The levels of CRTC2 mRNA and protein expression in normal liver cell line and HCC cell lines. (I) CRTC2 mRNA expression was detected in 50 paired HCC tissues and matched adjacent normal tissues. (J) Protein expression of CRTC2 was detected in 6 paired HCC tissues and matched adjacent normal tissues. GAPDH was used for normalization. (K and L) Representative images of CRTC2 expression in paired HCC specimens and IHC analysis, n = 50 per group, scale bars, 50 μm. (M and N) Survival analysis using the Kaplan-Meier method after dividing patients with HCC into the low or high CRTC2 expression groups, n = 25 per group. All data are presented as the means ± SD, ∗∗p < 0.01; ∗∗∗p < 0.001; ns, not significant.
Figure 2
Figure 2
CRTC2 upregulation in HCC is attributed to DNA hypomethylation (A) The online bioinformatic tool was utilized to screen the possible CpG islands in CRTC2 promoter sequence. (B) The cBioPortal database was employed to analyze the association between DNA methylation level and CRTC2 mRNA expression in HCC. (C) DNA methylation level in HCC cells as determined using methylation-specific PCR (MSP); M, methylation; U, unmethylation. (D) The expression of CRTC2 mRNA was evaluated in Hep3B and Huh7 cells after 5-Aza-dC treatment. (E and F) Detection and quantitation of CRTC2 protein expression in Hep3B and Huh7 cells after 5-Aza-dC treatment. (G) The DNA methylation status of CRTC2 CpG islands in three randomly chosen HCC tissues and matched adjacent normal tissues as determined by bisulfite sequencing PCR (BSP). Unmethylated CpG sites were represented by open circles, while methylated CpG sites were indicated by filled circles. n = 3 per group. All data are presented as the means ± SD of three independent experiments, ∗∗p < 0.01; ∗∗∗p < 0.001.
Figure 3
Figure 3
CRTC2 drives HCC malignant phenotypes in vitro (A) Colony formation assays were carried out to evaluate the impact of CRTC2 knockdown or overexpression on HCC cell proliferation. (B) EdU assays were utilized to determine the impact of CRTC2 knockdown or overexpression on the proliferation of HCC cells (scale bars, 50 μm). (C) Flow cytometry assays were used to assess the effect of CRTC2 knockdown or overexpression on cell apoptosis. (D) The effects of CRTC2 knockdown or overexpression on HCC cell migration as evaluated by wound healing assays (scale bars, 200 μm). (E) Transwell assays were used to evaluate the migration and invasion of transfected HCC cells (scale bars, 50 μm). All data are presented as the means ± SD of three independent experiments, ∗p < 0.05; ∗∗p < 0.01; ∗∗∗p < 0.001.
Figure 4
Figure 4
CRTC2 facilitates HCC growth and metastasis in vivo (A) Four weeks after subcutaneous injections of CRTC2-knockdown cells into nude mice, the tumors were isolated for analysis. (B and C) The size and weight of subcutaneous tumors, n = 6 per group. (D) Four weeks after subcutaneous injections of CRTC2-overexpression cells into nude mice, the tumors were isolated for analysis. (E and F) The size and weight of subcutaneous tumors, n = 6 per group. (G) Representative CRTC2, Ki-67, and TUNEL immunostaining of subcutaneous tumors (scale bars, 100 μm), and the quantitation of immunohistochemical staining score was shown, n = 6 per group. (H and I) Bioluminescence images of lung metastasis model and the quantitation of the corresponding luciferase activity were shown, n = 6 per group. (J and K) Survival analysis of the lung metastasis model in each group, n = 10 per group. All data are presented as the means ± SD, ∗p < 0.05; ∗∗p < 0.01; ∗∗∗p < 0.001.
Figure 5
Figure 5
CRTC2 overexpression activates the Wnt/β-catenin pathway in HCC (A) Heatmap showing changes in gene expression after CRTC2 upregulation. (B) Top 20 pathways of KEGG enrichment analysis. (C) Protein levels of β-catenin, cyclinD1, CD44, c-Met, c-Jun, and TCF-1 in HCC cells following CRTC2 knockdown or overexpression. (D) The dual luciferase reporter assay was conducted to analyze the transcriptional activity of TCF/LEF in transfected HCC cells. All data are presented as the means ± SD of three independent experiments, ∗∗p < 0.01.
Figure 6
Figure 6
Inhibition of the Wnt/β-catenin pathway suppresses CRTC2-induced promotion of HCC malignant phenotypes (A) Western blot analysis of β-catenin, cyclinD1, CD44, c-Met, c-Jun, and TCF-1 in the transfected Huh7 cells exposed or unexposed to XAV-939. (B) The dual luciferase reporter assay was conducted to assess the transcriptional activity of TCF/LEF. (C and D) Cell proliferation was determined using colony formation assays. (E and F) Transwell assays were used to measure the migration and invasion of transfected Huh7 cells exposed or unexposed to XAV-939 (scale bars, 50 μm). All data are presented as the means ± SD of three independent experiments, ∗∗p < 0.01; ∗∗∗p < 0.001.
Figure 7
Figure 7
Crtc2 downregulates the PD-L1/PD-1 axis (A) There were 27 cell clusters in total, which were defined in the respective groups. (B) The t-distributed stochastic neighbor embedding (t-SNE) plot showing the 27 major cell clusters. (C) Distribution of 27 major cell clusters in each group, as shown by t-SNE plots. (D) Distribution of PD-1+ cell clusters in each group, as shown by t-SNE plots. (E) Relative expression of PD-1+ immune cells in each group. (F and G) The protein expression of PD-L1 in transfected human HCC cells and mouse HCC cells. (H) Representative orthotopic tumors collected from H22-bearing C57BL/6 (upper) and BALB/c mice (lower). (I) Volume statistics of orthotopic tumors for each group, n = 6 per group. (J and K) Flow cytometry analysis of CD8+ in CD3+ T cells and PD-1+ in CD8+ T cells from C57BL/6 orthotopic tumors and their quantitation, n = 6 per group. (L and M) Flow cytometry analysis of CD8+ in CD3+ T cells and PD-1+ in CD8+ T cells from BALB/c orthotopic tumors and their quantitation, n = 6 per group. All data are presented as the mean ± SD, ∗∗p < 0.01; ∗∗∗p < 0.001.
Figure 8
Figure 8
Targeting Crtc2 sensitizes anti-PD-1 therapy in HCC (A) Diagram showing the treatment strategy for subcutaneous tumors (upper) and orthotopic tumors (lower) in C57BL/6 mice. (B) Photographs of the subcutaneous tumors (left) and orthotopic tumors (right), n = 6 per group. (C and D) Weight and volume statistics of subcutaneous tumors, n = 6 per group. (E) Volume statistics of orthotopic tumors, n = 6 per group. (F) Flow cytometry analysis of CD8+ in CD3+ T cells and PD-1+ in CD8+ T cells from C57BL/6 orthotopic tumors and their quantitation, n = 6 per group. (G) Diagram showing the treatment strategy for subcutaneous tumors (upper) and orthotopic tumors (lower) in BALB/c mice. (H) Photographs of the subcutaneous tumors (left) and orthotopic tumors (right), n = 6 per group. (I and J) Weight and volume statistics of subcutaneous tumors, n = 6 per group. (K) Volume statistics of orthotopic tumors, n = 6 per group. (L) Flow cytometry analysis of CD8+ in CD3+ T cells and PD-1+ in CD8+ T cells from BALB/c orthotopic tumors and their quantitation, n = 6 per group. All data are presented as the mean ± SD, ∗∗p < 0.01; ∗∗∗p < 0.001.

Similar articles

Cited by

References

    1. Villanueva A. Hepatocellular Carcinoma. N. Engl. J. Med. 2019;380:1450–1462. doi: 10.1056/NEJMra1713263. - DOI - PubMed
    1. Sung H., Ferlay J., Siegel R.L., Laversanne M., Soerjomataram I., Jemal A., Bray F. Global Cancer Statistics 2020: GLOBOCAN Estimates of Incidence and Mortality Worldwide for 36 Cancers in 185 Countries. CA Cancer J. Clin. 2021;71:209–249. doi: 10.3322/caac.21660. - DOI - PubMed
    1. Li Q., Ni Y., Zhang L., Jiang R., Xu J., Yang H., Hu Y., Qiu J., Pu L., Tang J., Wang X. HIF-1alpha-induced expression of m6A reader YTHDF1 drives hypoxia-induced autophagy and malignancy of hepatocellular carcinoma by promoting ATG2A and ATG14 translation. Signal Transduct. Target. Ther. 2021;6:76. doi: 10.1038/s41392-020-00453-8. - DOI - PMC - PubMed
    1. Huang D.Q., El-Serag H.B., Loomba R. Global epidemiology of NAFLD-related HCC: trends, predictions, risk factors and prevention. Nat. Rev. Gastroenterol. Hepatol. 2021;18:223–238. doi: 10.1038/s41575-020-00381-6. - DOI - PMC - PubMed
    1. Forner A., Reig M., Bruix J. Hepatocellular carcinoma. Lancet. 2018;391:1301–1314. doi: 10.1016/S0140-6736(18)30010-2. - DOI - PubMed