. 2024 Oct;18(10):2569-2585.
doi: 10.1002/1878-0261.13667. Epub 2024 May 21.

Targeting chondroitin sulfate suppresses macropinocytosis of breast cancer cells by modulating syndecan-1 expression

Affiliations

Targeting chondroitin sulfate suppresses macropinocytosis of breast cancer cells by modulating syndecan-1 expression

Hung-Rong Yen et al. Mol Oncol. 2024 Oct.

Abstract

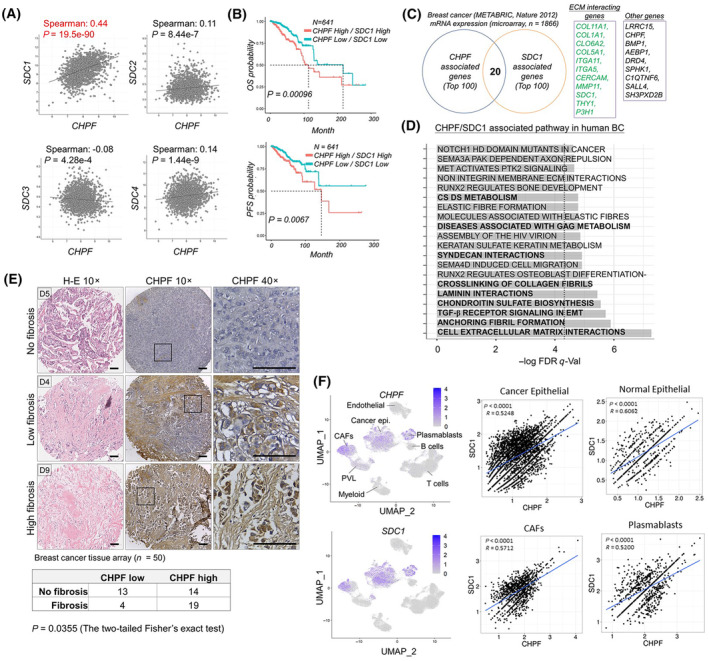
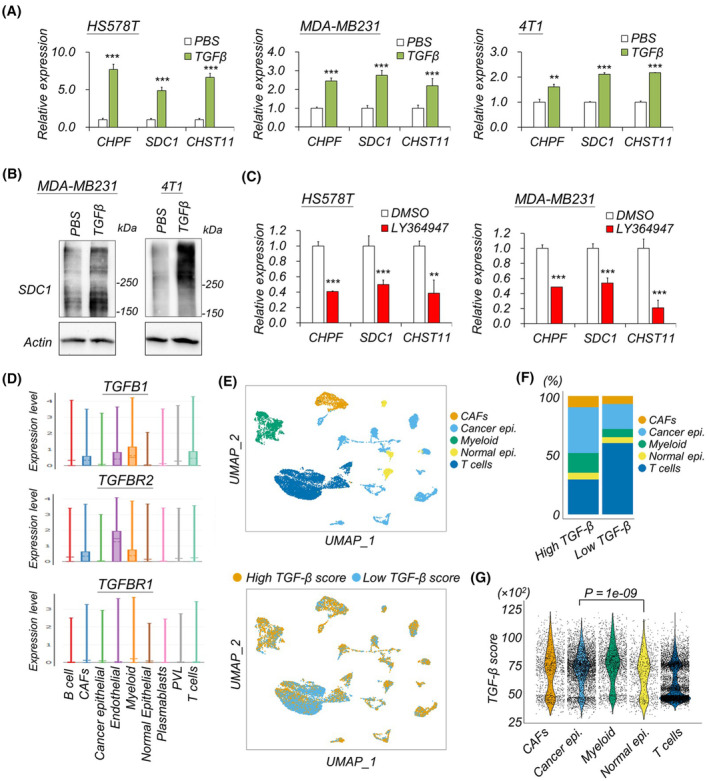
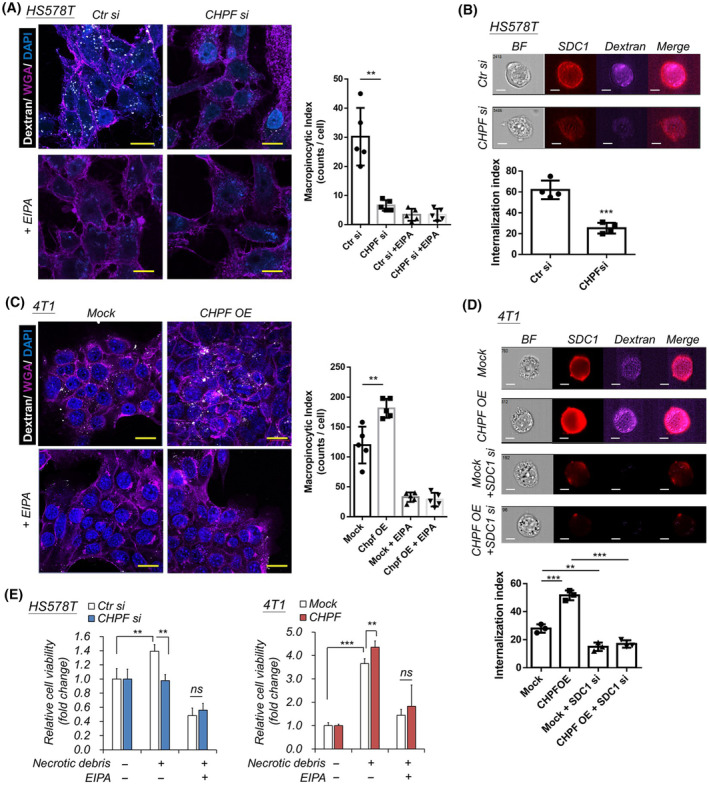
Accumulation of abnormal chondroitin sulfate (CS) chains in breast cancer tissue is correlated with poor prognosis. However, the biological functions of these CS chains in cancer progression remain largely unknown, impeding the development of targeted treatment focused on CS. Previous studies identified chondroitin polymerizing factor (CHPF; also known as chondroitin sulfate synthase 2) is the critical enzyme regulating CS accumulation in breast cancer tissue. We then assessed the association between CHPF-associated proteoglycans (PGs) and signaling pathways in breast cancer datasets. The regulation between CHPF and syndecan 1 (SDC1) was examined at both the protein and RNA levels. Confocal microscopy and image flow cytometry were employed to quantify macropinocytosis. The effects of the 6-O-sulfated CS-binding peptide (C6S-p) on blocking CS functions were tested in vitro and in vivo. Results indicated that the expression of CHPF and SDC1 was tightly associated within primary breast cancer tissue, and high expression of both genes exacerbated patient prognosis. Transforming growth factor beta (TGF-β) signaling was implicated in the regulation of CHPF and SDC1 in breast cancer cells. CHPF supported CS-SDC1 stabilization on the cell surface, modulating macropinocytotic activity in breast cancer cells under nutrient-deprived conditions. Furthermore, C6S-p demonstrated the ability to bind CS-SDC1, increase SDC1 degradation, suppress macropinocytosis of breast cancer cells, and inhibit tumor growth in vivo. Although other PGs may also be involved in CHPF-regulated breast cancer malignancy, this study provides the first evidence that a CS synthase participates in the regulation of macropinocytosis in cancer cells by supporting SDC1 expression on cancer cells.

Keywords: CHPF; breast cancer; chondroitin sulfate; macropinocytosis; syndecan 1.


Conflict of interest statement

The authors declare no conflict of interest.

Figures

Fig. 1
Fig. 1
Expression of CHPF associated with SDC1 predicts poor prognosis of patients with breast cancer. (A) Correlation of gene expression of CHPF and syndecans (SDC1, SDC2, SDC3, and SDC4) in human breast cancer tissues. (B) Kaplan Meier analysis of overall survival (OS) and progress free survival (PFS) of breast cancer patients with high expression of both CHPF and SDC1 and low expression of both CHPF and SDC1. (C) Overlapping of CHPF and SDC1 positive associated genes in METABRIC‐breast invasive carcinoma dataset. ECM, extracellular matrix. (D) Pathway enrichment analysis using the Reactome knowledgebase. Bold text indicates the pathways involved in GAG formation and extracellular matrix interactions. (E) Representative images of H&E stain and immunohistochemistry on breast cancer tissue array (n = 50; case number: D4, D5, and D9 are shown) using anti‐CHPF antibody. Tissues were counterstained with hematoxylin. Amplified images were shown at right. Scale bar = 150 μm. (F) Analysis of cellular expression levels of CHPF and SDC1 using a single‐cell RNA‐sequencing dataset (scRNA‐seq) [37] with 26 primary breast cancer tissues. Smart‐seq2 data were downloaded with cell type annotations. CAFs, cancer‐associated fibroblasts; PVL, perivascular‐like cells.
Fig. 2
Fig. 2
CHPF modulates SDC1 expression. (A) Western blots of SDC1 in breast cancer cells. Lysates were treated with heparinase (Hsase I + II + III) and/or chondroitin ABC (ChaseABC). Chondroitin sulfate SDC1 (CS‐SDC1) and GAG removed SDC1 core protein (SDC1‐core) were indicated. Representative images were shown from four independent experiments. (B) Immunofluorescence of SDC1 and CS56 in Chpf overexpressed (Chpf OE) and mock transfected (empty vector) 4T1 cells. White arrow indicates CS‐SDC1 on the cell surface. Scale bar = 10 μm. Representative images were shown from four independent experiments. (C) q‐PCR of CHPF and SDC1 in CHPF siRNA silenced or overexpressed cells. Expression was normalized to 18S, and relative expression to control were shown. CHPF si, CHPF‐specific siRNA transfected cells; Ctr si, control siRNA transfected cells. Mean ± SD was shown. *P < 0.05; **P < 0.01; ***P < 0.001 by two side t‐test. Representative data were shown from four independent experiments with similar results. (D, E) Western blots of CHPF and SDC1 in CHPF siRNA silenced or overexpressed cells. β‐Actin (Actin) was taken as loading control. Representative images were shown from four independent experiments. (F) Flow cytometry revealed cell surface SDC1 after overexpression of Chpf in 4T1 cells. Mean ± SD was shown. **P < 0.01 by two side t‐test. All experiments were repeated four times, and representative images were shown.
Fig. 3
Fig. 3
TGF‐β signal regulates both CHPF and SDC1 expression. (A) q‐PCR of CHPF, SDC1, and CHST11 in TGF‐β treated cells. Mean ± SD was shown. **P < 0.01; ***P < 0.001 by two side t‐test. Representative data were shown from three independent experiments with similar results. (B) Protein levels of SDC1 after TGF‐β treatment. Representative images were shown from four independent experiments. (C) q‐PCR of CHPF, SDC1, and CHST11 in TGF‐β type‐I receptor inhibitor, LY364947, treated cells. Mean ± SD was shown. **P < 0.01; ***P < 0.001 by two side t‐test. Representative data were shown from three independent experiments with similar results. (D) Expression level of TGFB1, TGFBR1, and TGFBR2 in major cell types of primary breast cancer tissue. Data generated by single‐cell portal (https://singlecell.broadinstitute.org/single_cell) using dataset from Wu et al. [37]. Note that the gene expression levels were the corrected counts transformed using LogNormalize function in seurat. (E) Top, overview of the reanalysis of GSE176078 scRNA‐seq dataset. Bottom, UMAP plot of cells colored by high or low TGF‐β groups, calculated by ssGSEA. (F) Percentage composition of cell types for high or low TGF‐β signaling groups. (G) Violin and jitter plot of TGF‐β score across major cell types in breast cancer tissue. The P value is calculated by a two‐sample Wilcoxon test. CAFs, cancer‐associated fibroblasts; epi., epithelium; PVL, perivascular‐like cells.
Fig. 4
Fig. 4
CHPF modulates macropinocytosis of breast cancer cells. (A) Silencing of CHPF suppressed macropinocytosis in low‐nutrient culture conditions. The uptake of dextran in HS578T cells displayed as white dots. Wheat germ agglutinin (WGA) was used to label cell membranes to outline the cell boundary (purple). EIPA was used as a macropinocytosis suppressor. CHPF si, CHPF‐specific siRNA transfected cells; Ctr si, control siRNA transfected cells. Mean ± SD was shown from five independent experiments (right). **P < 0.01; by two side t‐test. Scale bar 20 μm. (B) Measuring dextran internalization using imaging flow cytometry. Representative images were shown at top. Scale bar 7 μm. Mean ± SD was shown from four independent experiments. ***P < 0.001 by two side t‐test. (C) Overexpression of CHPF (CHPF OE) increased macropinocytosis in 4T1 cells. Mean ± SD was shown from five independent experiments (right). **P < 0.01; by two side t‐test. Scale bar 20 μm. (D) Imaging flow cytometry of dextran internalization in CHPF overexpressed cells and SDC1‐silenced cells. Mean ± SD was shown from three independent experiments. Representative images were shown at top. Scale bar 7 μm. **P < 0.01; ***P < 0.001 by two side t‐test. (E) Fold change of breast cancer cell viability in low‐nutrient culture condition feed with or without cell debris. Mean ± SD was shown from three independent experiments. **P < 0.01; ***P < 0.001 by two side t‐test. ns, not significant.
Fig. 5
Fig. 5
Chondroitin sulfate‐binding peptide enhances SDC1 degradation and suppresses macropinocytosis. (A) 6‐O‐sulfated chondroitin sulfate‐binding peptide (C6S‐p) pull‐down assay of protein lysate from mock (empty vector) and CHPF overexpressed (CHPF OE) cells. Scrambled peptide (Scr‐p) with an identical amino acid composition to C6S‐p was used as control. Representative images were shown from three independent experiments. (B) Breast cancer cells were treated with peptide for 48 h and analyzed by western blots. β‐Actin (Actin) was taken as loading control. Representative images were shown from four independent experiments. (C) Western blotting of SDC1 degradation. 4T1 cells or HS578T cells were treated with peptides and 20 μm cycloheximide (CHX) for 1, 3, and 6 h. Actin was taken as loading control. The relative protein levels were calculated from three independent experiments and shown on the right. Mean ± SD was shown. *P < 0.05; **P < 0.01 by two side t‐test. (D) C6S‐p suppresses cell debris‐enhanced cell viability. Mean ± SD was shown from three independent experiments. ***P < 0.001 by two side t‐test. (E) C6S‐p inhibits macropinocytosis in 4T1 cells. Cells were pretreated with Scr‐p or C6S‐p for 1 h, and dextran was added for uptake for 30 min. Wheat germ agglutinin (WGA) was used to label cell membranes (purple). EIPA was used as a macropinocytosis suppressor. Mean ± SD was shown from five independent experiments (right). **P < 0.01; by two side t‐test. Scale bar 20 μm.
Fig. 6
Fig. 6
6‐O‐sulfated chondroitin sulfate‐binding peptide (C6S‐p) inhibits tumor progression in vivo. (A) Protocol of 4T1 tumor model and peptide treatments. (B) Measurement of tumor size and weight. Red arrow indicated the time point of peptide treatment. Tumor mass was surgically removed on day 21. Mean ± SD was shown. *P < 0.05; by two side t‐test. Scale bar 1 cm. Ten mice for each group. (C) Spontaneous cancer metastasis to lung. Blue arrow indicates tumor nodules. Incidence of metastasis was shown at bottom. Mean ± SD was shown. *P < 0.05; by two side t‐test. Ten mice for each group. Scale bar 1 cm. (D) Pathway enrichment analysis of differential expressed genes between C6S‐p and Scr‐p treated tumor tissue. (E) A proposed model illustrating that TGF‐β and CHPF enhanced cell surface SDC1 and promoted macropinocytosis of breast cancer cells. This model also demonstrated that C6S‐p promoted the degradation of SDC1 and suppressed cancer cells uptake cell debris for surviving in low‐nutrient microenvironment.

References

    1. Hanahan D, Weinberg RA. Hallmarks of cancer: the next generation. Cell. 2011;144:646–674. 10.1016/j.cell.2011.02.013 - DOI - PubMed
    1. Munkley J, Elliott DJ. Hallmarks of glycosylation in cancer. Oncotarget. 2016;7:35478–35489. 10.18632/oncotarget.8155 - DOI - PMC - PubMed
    1. Djerbal L, Lortat‐Jacob H, Kwok J. Chondroitin sulfates and their binding molecules in the central nervous system. Glycoconj J. 2017;34:363–376. 10.1007/s10719-017-9761-z - DOI - PMC - PubMed
    1. Kwok JC, Warren P, Fawcett JW. Chondroitin sulfate: a key molecule in the brain matrix. Int J Biochem Cell Biol. 2012;44:582–586. 10.1016/j.biocel.2012.01.004 - DOI - PubMed
    1. Neill T, Painter H, Buraschi S, Owens RT, Lisanti MP, Schaefer L, et al. Decorin antagonizes the angiogenic network: concurrent inhibition of Met, hypoxia inducible factor 1alpha, vascular endothelial growth factor A, and induction of thrombospondin‐1 and TIMP3. J Biol Chem. 2012;287:5492–5506. 10.1074/jbc.M111.283499 - DOI - PMC - PubMed